Abstract
Described herein is a first-in-man attempt to both genetically modify T cells with an imagable suicide gene and track these transduced donor T cells in allogeneic stem cell transplantation recipients using noninvasive positron emission tomography/computerized tomography (PET/CT) imaging. A suicide gene encoding a human CD34-Herpes Simplex Virus-1-thymidine kinase (CD34-TK75) fusion enabled enrichment of retrovirally transduced T cells (TdT), control of graft-versus-host disease and imaging of TdT migration and expansion in vivo in mice and man. Analysis confirmed that CD34-TK75-enriched TdT contained no replication competent γ-retrovirus, were sensitive to ganciclovir, and displayed characteristic retroviral insertion sites (by targeted sequencing). Affinity-purified CD34-TK75+-selected donor T cells (1.0–13 × 105)/kg were infused into eight patients who relapsed after allogeneic stem cell transplantation. Six patients also were administered 9-[4-(18F)fluoro-3-hydroxymethyl-butyl]guanine ([18F]FHBG) to specifically track the genetically modified donor T cells by PET/CT at several time points after infusion. All patients were assessed for graft-versus-host disease, response to ganciclovir, circulating TdT cells (using both quantitative polymerase chain reaction and [18F]FHBG PET/CT imaging), TdT cell clonal expansion, and immune response to the TdT. This phase 1 trial demonstrated that genetically modified T cells and [18F]FHBG can be safely infused in patients with relapsed hematologic malignancies after allogeneic stem cell transplantation.
Introduction
Severe or life-threatening graft-versus-host disease (GvHD) often follows allogeneic stem cell transplantation, the only potentially curative treatment for many hematological malignancies.1 Because T effector cells mediate both graft versus leukemia (GvL) and GvHD, grafts that effectively control the cancer are most apt to cause GvHD.2 Efforts to limit GvHD while retaining GvL have met with some success in clinical trials in which “suicide genes” were transduced into donor T cells ex vivo so that they could be specifically destroyed when an appropriate metabolic substrate was provided.3,4,5 Such a safety mechanism allows for the in vivo elimination of T cells, thus limiting GvHD and other off-target effects.
Efforts to identify biomarkers that are predictive of future GvHD have yielded contradictory results.6 We hypothesized that the use of novel noninvasive imaging of genetically modified donor T cells to assess both donor T-cell trafficking and T-cell expansion in vivo would provide both insights and potentially valuable biomarkers for GvHD risk and severity. Using human T cells transduced with γ-retroviruses carrying Click Beetle Red luciferase, we previously identified a distinctive migration pattern for these genetically modified T cells in sublethally irradiated NOD-SCID-γc -/- (NSG) recipient mice that develop life-threatening xenogeneic GvHD after retro-orbital injection. The TdT traffick to and expand in the thymus and regional neck lymph nodes only in those mice that go on to develop life threatening xenogeneic GvHD.7
Genetically-encoded imaging reporters introduced into cells and transgenic organisms enable noninvasive, longitudinal studies of dynamic biological processes in intact cells and living animals including humans.8 The most common reporters include firefly luciferase (bioluminescence imaging (BLI)), green fluorescence protein (fluorescence imaging), Herpes Simplex Virus-1 thymidine kinase (positron emission tomography (PET)), and variants with enhanced spectral and kinetic properties optimized for use in vivo. Whole body optical imaging strategies using fluorescence and BLI have not been possible in humans due to attenuation of the low-energy signals from optical reporters and probes through the long distances necessary for visualization deep within the body and, for luminescent approaches, the lack of available approved luciferase substrates for human clinical trials. In contrast, nuclear imaging (PET) is highly sensitive (detecting fmole levels of probe), quantitative, and inherently tomographic, enabling the visualization of deep structures. The high-energy emissions of various radiolabeled substrates that exist for the suicide gene Herpes Simplex Virus-1 thymidine kinase (HSV-TK) and optimized mutants readily enable whole body imaging.9,10,11 Thus, to examine TdT migration in patients, we transduced donor human T cells with γ-retroviruses carrying a CD34-TK75 fusion gene permitting PET/CT imaging in mouse and man, suicide gene-mediated control of GvHD by administration of ganciclovir (GCV) in vivo, and rapid affinity purification of transduced T cells during GMP manufacture. Unlike mammalian thymidine kinases, HSV-TK converts the penciclovir analog, [18F] 9-[4-fluoro-3-hydroxymethylbutyl]guanine ([18F]FHBG), into a phosphorylated membrane-impermeable product, thus selectively entrapping it in transduced cells.12 The purine selective mutant HSV-TK75 with its high substrate specificity and decreased Km was chosen for the studies described herein both to increase sensitivity to GCV and to further improve the signal to background noise ratio during PET imaging.13
[18F]FHBG has been used in humans to track HSV-TK-TdT cells14 and to observe tumors following intratumoral injection of an adenovirus encoding HSV-TK.10 Our phase 1 trial explored the safety and feasibility of manufacturing both TdT and [18F]FHBG onsite and then administering these to patients. TdT migration was tracked with the hope that, as in preclinical studies, a distinctive pattern predictive of GvHD might be detected.
Results
Trial design
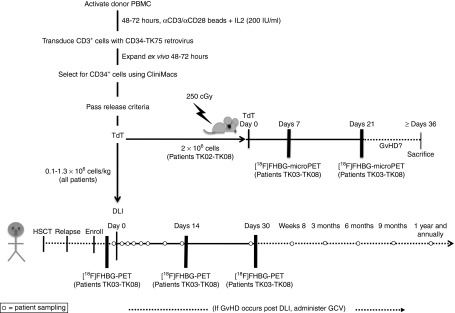
Four acute myeloid leukemia and four myelodysplastic syndrome patients who relapsed after allogeneic transplantation were enrolled into the trial depicted in Figure 1. Study size was limited by the quantity of virus available for transduction of donor cells. The patients had a mean age of 59 years old, a mean interval from bone marrow transplantation to relapse of 501 days, and seven out of eight patients received chemotherapy before proceeding with donor lymphocyte infusion (DLI, Supplementary Table S1).
Figure 1.
Detailed study schema. Activated donor T cells were retrovirally transduced to express CD34-TK75. After in vivo expansion and selection for CD34, TdT, cells were required to meet the following release criteria: ≥50% viable, ≥ 10% transduced, ≥85% CD34+, ≥80% sensitive to ganciclovir (GCV) in vitro, ≥1 × 10⁵ TdT/kg patient weight, no detectable endotoxin or Mycoplasma, no growth in 14 days aerobic or anaerobic microbial culture medium. Patients received a donor lymphocyte infusion (DLI) of purified retrovirally transduced donor T cells on day 0. Blood samples were collected for patient safety assessments and correlative studies (open circles) at approximately 30 minutes, 2 hours, 24 hours; days 2, 5, and 7; weeks 2, 4, and 8; months 3, 6, 9, and 12; and then annually for as long as patients remained enrolled in the trial. Patients TK03 to TK08 were additionally enrolled in a subprotocol in which they were imaged at baseline and on days +14 and +30 using [18F]FHBG PET/CT to detect the TdT. If graft-versus-host disease (GvHD) developed post-DLI, GCV (5 mg/kg) was administered twice daily for 7 days to investigate the use of suicide-gene mediated treatment via selective killing of the transduced donor T cells. Collection of blood samples was then reinitiated on the same schedule as outlined above, but using the day of GCV administration as day 0. A portion of the TdT (≤2 × 10⁶ cells) prepared for patients TK02-TK08 was infused in parallel into NSG mice (Figure 8) that were followed for symptoms of GvHD and imaged via [18F]FHBG microPET/CT on days 7 and 21 postinfusion. HSCT, hematopoietic stem cell transplantation.
Transduction of donor cells
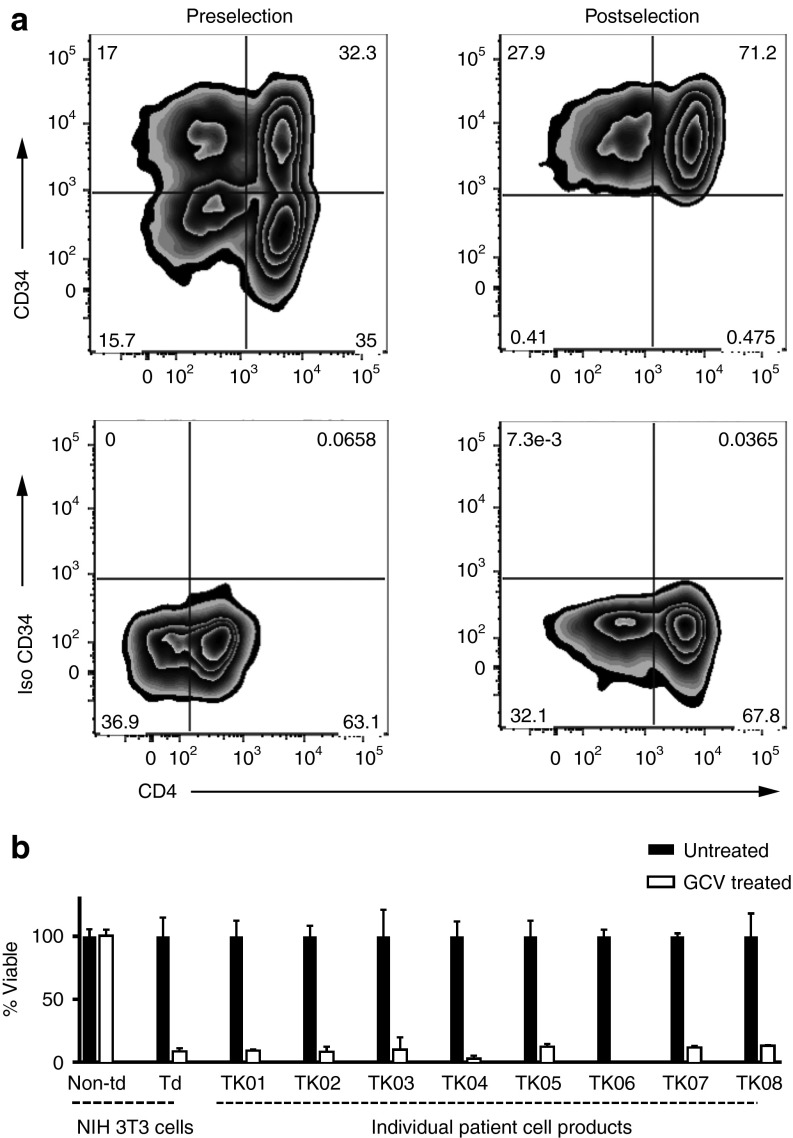
Activated donor peripheral blood mononuclear cells (PBMC) were transduced with the ΔU3CD34-TK75 γ-retrovirus at a multiplicity of infection set at 2 infectious units/cell to minimize the number of integrations and consequently the risk of insertional mutagenesis. A transduction efficiency of ~31% was achieved as determined by flow cytometry (Table 1 and Figure 2a) which correlates with ~2 copies of vector/cell.15
Table 1. Characteristics of the transduced donor cell product.
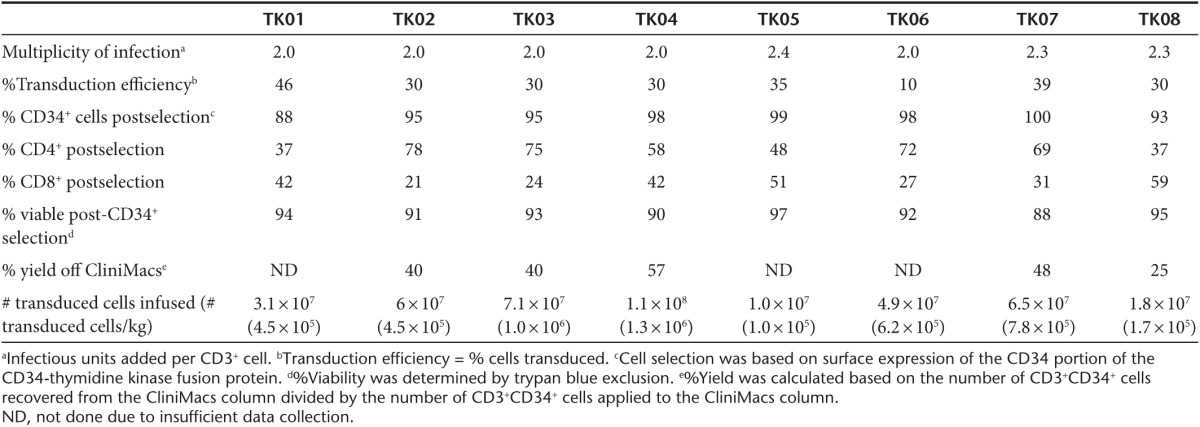
Figure 2.
Product purification and validation. (a) Flow cytometry was used to examine CD3+ cells for CD34 and CD4 expression to determine purity, transduction efficiency (% CD3+CD34+ cells/total CD3+ cells), and subtypes in all patient products (representative cell product for patient TK07). Upper left: CD3+CD34+ T cells prior to selection on the CliniMacs system. Upper right: CD34+ T cells postselection. Lower panels: isotype controls. (b) Survival of cells after incubation in 1 µmol/l ganciclovir for 5–7 days. The control used NIH 3T3 cells (nontransduced (Non-td) and ΔU3CD34-TK75-transduced (Td)). The donor T cells in individual patient cell products were activated for 48 hours in the presence of 1 anti-CD3/anti-CD28-coated bead per cell. After 5–7 days viability was assessed. Viability relative to untreated cells is shown. Data for control NIH 3T3 cells is pooled from all experiments. Error bars represent standard deviation.
Following expansion of the cells for 48–72 hours ex vivo, a CliniMacs system was used to rapidly select the TdT via surface expression of the CD34 extracellular domain in the CD34-TK75 fusion protein (Figure 2a). A mean of ~42% of the TdT that were applied to the column were recovered, ~93% of these were viable, and ~96% were CD3+CD34+. The products had normal ratios of CD4+:CD8+ T cells (Table 1). Product identity and potency were confirmed by testing an aliquot for susceptibility to killing by exposure to 1 µmol/l GCV for 5–7 days (~91% killed, Figure 2b).15
Clinical outcome
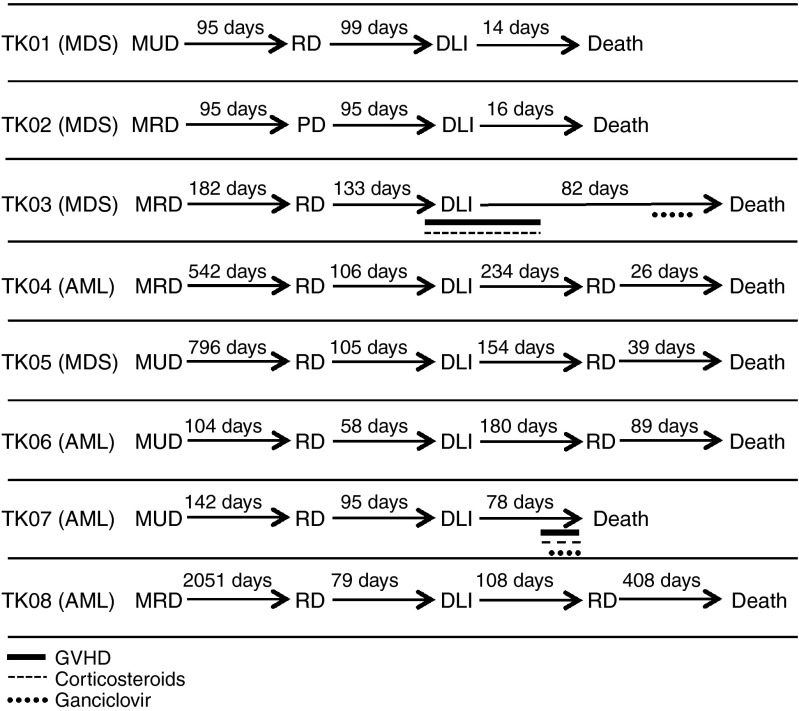
Following infusion of 0.1–1.3 × 10⁶ TdT/kg, four patients achieved complete remission, one had progressive disease after DLI, and three patients died prior to response evaluation (Supplementary Table S1). The mean overall survival after DLI was 165 days (Figure 3). Four out of eight patients were alive 6 months post-DLI, and one patient lived 408 days. TK03 developed grade 2 liver GvHD 1 week before infusion and was on low-dose steroids before receiving his DLI. His GvHD continued to progress to grade 3 2 weeks post-DLI, but because it rapidly resolved after an increased dose of steroids, he did not receive GCV at that time. Later, as his health failed and a CMV infection became evident, the treating physician chose to provide him with GCV on day 57 despite no evidence of GvHD. This patient died on day 82 due to relapsed leukemia. Patient TK07 did not respond to chemotherapy and DLI, but symptoms consistent with grade 4 liver GvHD were evident 64 days postinfusion. He was treated with high-dose steroids and GCV with no response. His primary cause of death on day 78 was relapsed/progressive disease. A liver biopsy was not performed and a postmortem examination was not performed at the family's request.
Figure 3.
Patient history. Displayed are each patient's diagnosis, type of transplantation (MUD, matched unrelated donor; MRD, matched related donor), and time elapsing between significant events: transplantation, relapsed disease (RD)34 donor lymphocyte infusion (DLI), graft-versus-host disease (GvHD) symptoms, GvHD treatment, and death. Four patients (TK04, TK05, TK06, and TK08) achieved complete remission, one had progressive disease (TK07), and three patients died prior to response evaluation after DLI (TK01, TK02, and TK03).
Using a quantitative polymerase chain reaction (qPCR) assay (Supplementary Materials, Supplementary Figure S1) capable of detecting five copies of the γ-retroviral VSV-G envelope protein in 100 ng human DNA (25,000 cells), no replication competent retrovirus was detected in patient samples (data not shown).
Detection of circulating TdT by quantitative PCR (qPCR)
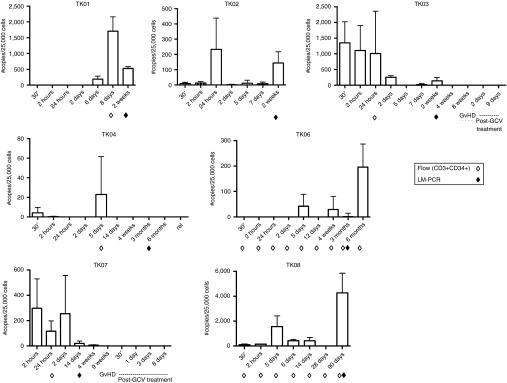
Flow cytometry failed to detect TdT in any patient at the time points tested. A more sensitive detection method, qPCR, successfully detected the genetically modified cells in the patients' peripheral blood, but in numbers that varied widely without a clearly discernable pattern (Figure 4). The patient who received the smallest dose of cells/kg (TK05, 1.0 × 10⁵/kg) had no detectable circulating TdT at any of the chosen time points (detection limit = 0.5 copies of CD34-TK75/100 ng genomic DNA, i.e., per ~25,000 cells, data not shown). However the patient receiving the next lowest dose (TK08, 1.7 × 10⁵/kg) lived the longest and had more circulating TdT than any other patient, occurring 3 months postinfusion. The two patients who were the longest survivors (TK06 and TK08) both had high levels of peripheral blood CD34-TK75 DNA at later time points (6 months and 90 days, respectively). TK04 survived nearly as long as TK06, but had the fewest detectable circulating TdT despite receiving the highest dose (1.3 × 10⁶/kg). No TdT were detected in the peripheral blood at the time patients TK03 or TK07 began GCV treatment or thereafter. Due to the limited sample size, the possibilities that CD34-TK75 was no longer expressed in patient cells or that the HSV-TK75 portion of the fusion protein was no longer functional were not investigated.16
Figure 4.
PCR detection of TdT. Primers flanking the junction of CD34 with HSV-TK75 (open arrowheads in Figure 6a) were used in qPCR reactions to detect virus DNA in patient peripheral blood cells. Samples were collected at the indicated times and assessed via qPCR as well as by flow cytometry (open diamonds) or LM-PCR (closed diamonds) as noted. Error bars represent standard deviation.
Lack of an immune response against TdT
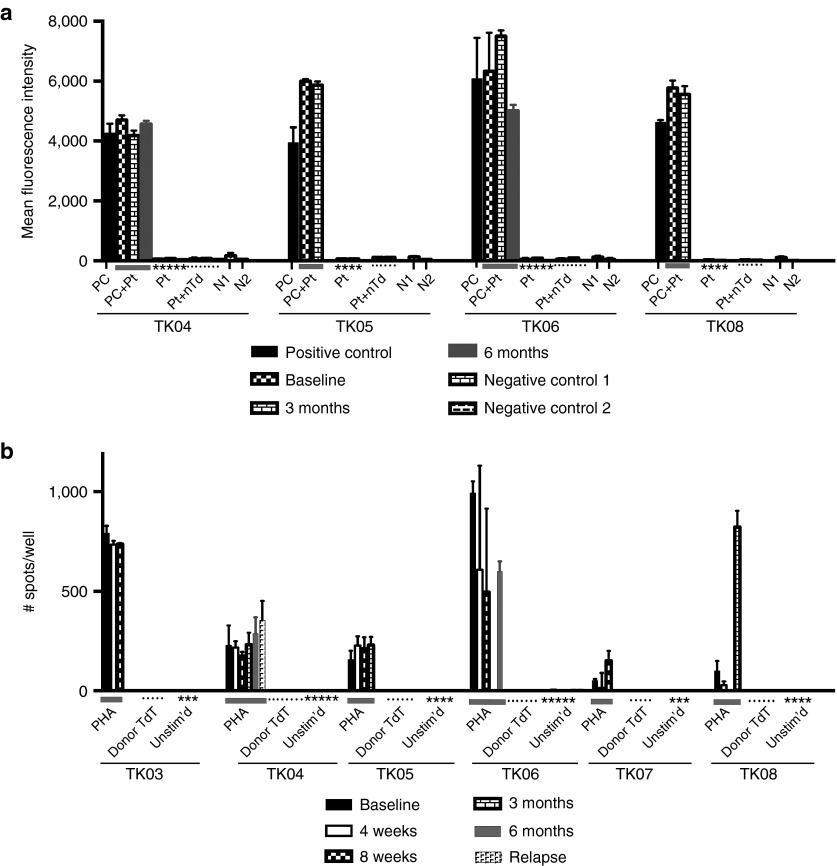
A flow cytometry-based assay detected no patient serum antibodies against CD34-TK at any time in any patient (Figure 5a). At no time was there evidence for a substance within the patients' sera that interfered with recognition of the antigen as assessed by addition of the patient serum to the positive control. Similarly, an Elispot assay detected no γ-interferon (γ-IFN) production in response to irradiated donor TdT (Figure 5b) at any time point in any patient. However, we also note that several patients had very little response to the nonspecific activator, phytohemaglutinin (PHA). Patient TK08 showed a rise in response to PHA at 3 months, coincident with an increase in qPCR detection of circulating TdT, but still no response directed against the donor TdT.
Figure 5.
Assessment of patient immune response against TdT. (a) Reactivity of antibodies in patient serum with nontransduced and ΔU3CD34-TK75-transduced murine NIH 3T3 cells. Patient samples were collected at baseline, 3, and 6 months. Patients TK01, TK02, TK03, and TK07 were not surviving at 3 months. Only patients TK04 and TK06 were alive at 6 months. Transduced NIH 3T3 cells were exposed to murine anti-huCD34 antibody (positive control (PC)) or to patient serum (Pt) followed by a PE-tagged anti-human or murine IgG before analysis by flow cytometry. PC+Pt = the positive control supplemented with patient serum from each time point. N1 = Nonspecific binding of the secondary PE-anti-murine IgG to the cells in the absence of primary antibody. N2 = the same using PE-anti-human IgG. Pt+nTd= Patient's serum incubated with nontransduced NIH 3T3 cells followed by secondary PE-anti-human IgG. (b) Elispot assay to detect patient cells producing γ-IFN in response to transduced donor cells. Unstimulated patient peripheral blood mononuclear cells (PBMCs) or PBMC stimulated with PHA (1.2 µg/ml) or irradiated TdT from the donor product administered to the patient were tested in an ELISPOT assay for production of γ-IFN at various times. Patients TK01 and TK02 were not surviving at 4 weeks. Insufficient numbers of cells were available to test PBMC from patient TK06 at 3 months or patient TK08 at 8 weeks.
Integration and clonal selection analyses
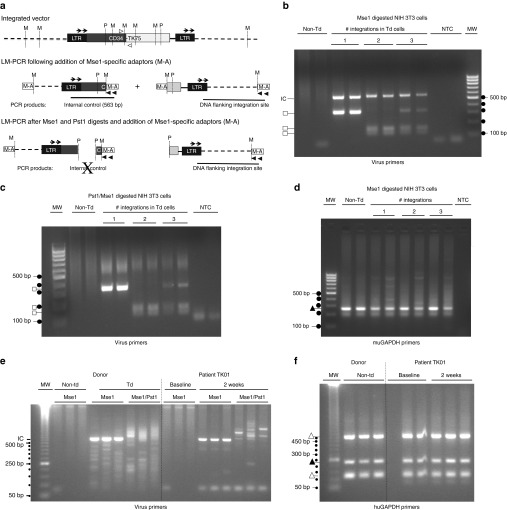
At 3 months post-DLI, patient peripheral blood samples were examined for evidence of clonal selection postinfusion using a modified ligation-mediated PCR (LM-PCR) assay (Figure 6a, Supplementary Methods, and Supplementary Table S2) to detect dominant TdT clones. The assay was validated using murine NIH 3T3 cells that had previously been shown to have 0, 1, or 2 integrations (Figure 6b–d). When the two cell lines were mixed, all three integrations could be detected.
Figure 6.
Integration and clonal selection analyses. (a) Schematic showing location of primers and restriction sites in the integrated virus. Clonal dominance was explored using a rapid modified LM-PCR assay (Supplementary Methods). The relative number of individual clones present was assessed by ligating Mse1-specific adaptors (M-A) to digested DNA (Supplementary Methods), then using PCR with nested primer pairs that bind to the adaptors (filled arrowheads, (Supplementary Table S2)) and the 3' end of the virus long terminal repeat (LTR, arrows). An internal control product (IC, 563 bp) is made from all TdT after a single digest with MseI (M), and provides an indication of the relative number of TdT in the sample. The internal control cannot be made after a double digest with Mse 1 and Pst1 (P), confirming specificity of the PCR reaction. To eliminate random variability in PCR, both the digests and the reactions were done in duplicate during validation and in triplicate on patient samples. To be considered prominent, a band had to occur in all replicates. (b,c) LM-PCR to distinguish non-Td NIH 3T3 cells from clones with one 350bp integration, (marked by square, ~350 bp, clone 1.5) or two (~125 and 175 bp, clone 2.5). Mix of cells shows all three products. NTC, no template control. MW = 100 bp molecular weight ladder (dots). (d) Control used primers that amplify a muGAPDH product (filled triangle, 248 bp). (e) Representative patient TK01: non-Td and Td donor cells versus patient peripheral blood mononuclear cells collected at baseline and 2 weeks after donor lymphocyte infusion. A smear or multiple bands are observed if a population of cells has many different integrations. Samples were rerun on more highly resolving gels if needed to confirm or refute identity between replicates. Dots = 50 bp molecular weight ladder. (f) Using primers to detect huGAPDH, both the functional gene (filled triangle, 234 bp) and two huGAPDH pseudogenes (open triangles, ~520 and ~130 bp) are detected as expected based on primer sequence.
When transduced donor cell products were analyzed by LM-PCR (Figure 6e,f), no predominating TdT clones were found in any patient. A prominent PstI-sensitive internal control product appeared when a sufficient number of TdT were circulating. Strong internal control products were made for patients 1 and 8, but either little or no such product was made for the remaining patients, consistent with the low number of circulating TdT detected by qPCR at the tested times (Figure 4). The internal control could not be detected by LM-PCR in samples that had ≤150 copies of vector/100 ng DNA in the qPCR assay.
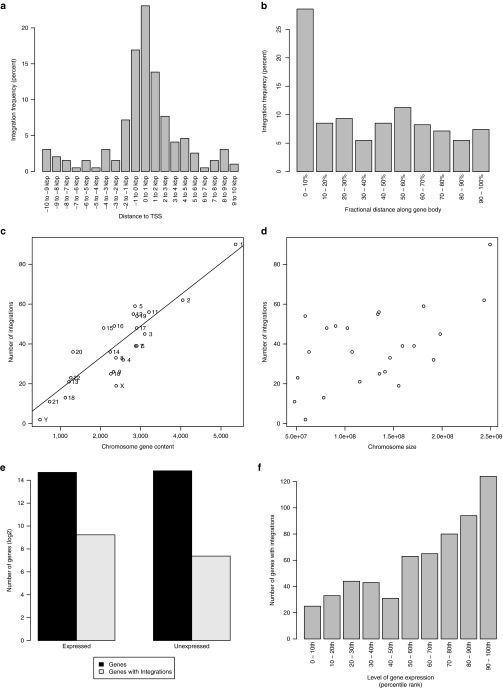
Analyses of targeted sequencing (Supplementary Methods and Supplementary Table S3) of 921 integrations verified that these had the characteristics expected of γ-retroviruses, namely, they were enriched near transcriptional start sites (Figure 7a,b), and clustered in common integration sites (Supplementary Table S3) and near apoptosis-related, tumor suppressor, and oncogenes (Supplementary Tables S4 and S5).17 Integration sites correlated with chromosomal gene content (Figure 7c) but not chromosomal length (Figure 7d), and were enriched in expressed genes relative to unexpressed genes (Figure 7e,f) with integration frequency correlated with expression level.
Figure 7.
Nonrandom and clustered retroviral integrations. Number of integrations as a function of distance (a) from the transcription start site (TSS) or (b) along the gene body (normalized by length of gene). Number of integrations versus (c) chromosome gene content (i.e., number of genes per chromosome) or (d) chromosome size. Line indicates linear regression fit (r2 = 0.91) excluding sex chromosomes in (c). (e) Total number of genes (in dark gray) that are expressed or unexpressed and number of expressed or unexpressed genes harboring integrations (in light gray). (f) Integrations as a function of gene expression level. Expressed genes (i.e., having fragments per kilobase of transcript per million mapped reads (FPKM) > 0) were sorted based on expression level. They were then divided into 10 percentile bins according to their expression level. Number of integrations for each bin is shown. Expression was determined by the mean of n = 3 FPKM values derived from transcriptome sequencing (RNA-seq) of normal T (i.e., CD3+) cells.
[18F]FHBG PET/CT imaging in mice and patients
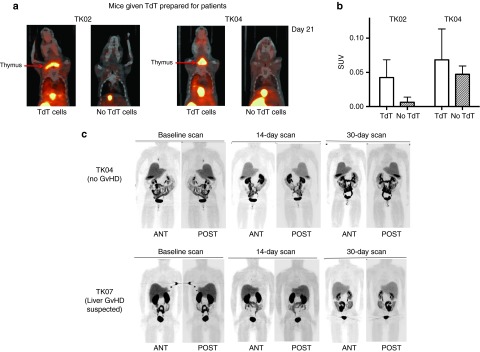
In our preclinical bioluminescence study, CD34-TK75-TdT were detected in the upper body (thymic or cervical region) only in those mice that eventually developed GvHD.18 By day 21, in this model, up to half of the animals injected i.v. with 2 × 10⁶ human T cells develop GvHD (unpublished data). A portion of the cell products for patients TK02-TK08 were tested in our immunodeficient mouse model of human T-cell-mediated GvHD.7 By [18F]FHBG microPET/CT imaging, a high background level of radiolabel was detected in the abdomen and excretory organs in mice injected with either donor's TdT or in mice injected only with [18F]FHBG. Mice receiving donor cell products for two of the seven patients (TK02 and TK04) developed GvHD, and in accord with our earlier studies, donor TdT migrated to and expanded in the thymic region only in those mice that developed GvHD (Figure 8a,b).
Figure 8.
[18F] FHBG microPET/CT imaging of NSG mice and representative posterior and anterior [18F]FHBG PET/CT scans of patients. A fraction of the transduced cell product provided to patients TK02-TK08 was administered to each of two mice that were subsequently imaged using [18F]FHBG microPET/CT on ~days 7 and 21. NSG mice were injected retro-orbitally with 2 × 10⁶ TdT, then paired with untreated normal control mice. Pairs were simultaneously injected with [18F]FHBG to follow TdT. For each patient product two such pairs (a and b) were imaged 1 hour after injection. (a) Coronal images of pairs infused with cells for TK02 and TK04 21 days earlier. (b) Corresponding standard uptake values in the upper part of the body for the mice shown in a. (c) Patient TK04 experienced no graft-versus-host disease (GvHD), while TK07 had clinical evidence of liver GvHD and was subsequently treated with ganciclovir at week 10. Images shown were acquired 60 minutes after administration of [18F]FHBG. Two whole body PET/CT scans beginning at the base of the brain and scanning through the upper thighs were made of supine patients TK03-TK08 at baseline, ~14 days post-donor lymphocyte infusion (DLI) and ~30 days post-DLI (patients TK04 and TK07 are shown). SUV, standardized uptake value. Error bars represent standard deviation.
Symptoms of acute GvHD typically begin to appear in patients ~30 days postinfusion of T cells. Since the genetically modified T cells were not associated with toxicities in patients TK01 and TK02, all subsequent patients underwent [18F]FHBG PET/CT (Figure 8c) at days +14 and +30 postinfusion. Of the six patients studied by [18F]FHBG PET/CT, five completed three PET/CT imaging sessions. The PET/CT imaging was well tolerated by all patients. Background levels of radioactivity were considerably lower in patients than seen in mice. This is consistent with another study that observed the same species variation.19 It should also be noted that lower relative amounts of [18F]FHBG were injected into patients than mice and fluid intake and elimination could be and was encouraged in patients. Nevertheless, the excretory system (kidneys, bladder, liver, intestines) still demonstrated the highest concentration of radiolabel in patients. PET/CT images in all patients demonstrated the expected normal biodistribution of [18F]FHBG and no lesions (accumulation of the tracer consistent with localization of TdT) were observed on PET/CT images. There was no clear distinction between the [18F]FHBG biodistribution at baseline and later time points. Likewise, there was no difference between images acquired for patient TK07 who experienced GvHD at 64 days post-DLI (but was not symptomatic at the time of imaging on days +15 and +30), and those patients who did not develop the disease.
Discussion
In this phase 1 trial, we attempted to use CD34-TK75 not only as a safety switch to potentially eliminate alloreactive donor T cells causing GvHD, but also as a means to efficiently purify TdT and track them in patients using noninvasive PET/CT imaging. On-site production and administration of GMP-manufactured genetically modified T cells and [18F]FHBG were shown to be feasible and safe.
TdT were detected by a qPCR assay in the peripheral blood of seven out of eight patients using primers that flank the junction of the CD34-TK75 fusion protein, but were not detected by a less sensitive flow cytometry assay. Transgene expression may have been reduced or lost in the patients, but note that expression of CD34-TK-enabled tracking of the donor's T cells by microPET imaging in at least some of the mice. In the two patients who lived longest (TK06, +269d and TK08, + 408d post-DLI), circulating TdT-associated CD34-TK75 DNA eventually rose from background levels to their highest levels at 6 months and 90 days respectively, consistent with persistence and expansion of these TdT in vivo. There was little discernable correlation between when the cells were detected, the amount detected, and the disease state other than the possibility that in TK08 the donor TdT were expanding shortly before relapse was detected (discussed below). Our data are consistent with another small study (N = 8 patients) where a similar low dose of donor HSV-TK transduced cells (0.2 to 2 × 10⁶/kg) was infused into transplantation recipients resulting in similar variability in persistence in vivo.20
A separate trial used a fusion of HSV-TK and a naturally occurring truncation of CD34.21 Two of the three patients received two infusions of genetically modified allogeneic T cells (the first was <0.5 × 10⁶ and the second <5 × 10⁶). TdT were detected from shortly after the second infusion until death ~30 days later for one patient and through ≥ 300 days for the second patient. It is unclear whether the prolonged circulation of the TdT in that study could be attributed to the dosing schedule, a difference in the ex vivo preparation of the cells,22 a difference in the patient population (pediatric versus adult), or some other factor. In our xenograft model, donor TdT appeared to be functionally similar to T cells that have not been genetically manipulated both in terms of GvHD potential and in biodistribution and expansion as measured by microPET imaging. Nonetheless as recently discussed by Cieri et al.22, ex vivo activation of T cells, time in culture, growth factors added, and specific purification methods used for separation of genetically modified T cells (we used CD34 affinity purification) impacts the subset, lineage, and differentiation state of the T cells. These in vitro interventions and manipulations might also affect persistence and expansion of TdT as well as potentially impact the continued expression of the transgene as detected by flow cytometry for CD34 or potentially lead to an effective immunologic response to these infused TdT.
As extensively discussed by Berger et al.,23 some patients develop an immune response to HSV-TK, a foreign protein. However, neither a cellular nor serum immune response against the TdT was observed in any of our patients. Since a later study reported an immune response using dosing similar to our own, the disparity between studies is unlikely due to the number of cells infused or our single immunization.20 It is unclear which patient characteristics or prior treatments influenced their immune response. The patients varied in age from 31 to 70 years old. The number of days between transplant and DLI ranged between 162 and 2,130 days (Supplementary Table S1), also possibly affecting engraftment of these TdT. Patients TK02-TK08 all received some form of salvage therapy before DLI, but of varying types and at various times post-transplant (Supplementary Table S1). We note that the ability of the patients' PBMC to generate γ-IFN in response to the nonspecific stimulant PHA also varied (Figure 5b), perhaps reflecting their differing levels of immune reconstitution or immunocompetence. Cells from patient TK08 had an increase in response to PHA at 3 months that was concurrent with a substantial rise in detection of circulating TdT by qPCR despite no detection of the cells by flow cytometry.
While retroviral integration into the genome of T cells introduces a theoretical risk of insertional leukemogenesis, any resulting TdT clones should be eliminated in a patient by treatment with GCV. γ-retrovirus-mediated insertional mutagenesis and clonal selection has not been observed in T cells.24,25 In accord, our LM-PCR assessment found no evidence for selection of TdT clones. Analysis of our targeted sequencing data provided limited indirect evidence for clonal integrations, consistent with biased integration near genes associated with apoptosis and oncogenesis.26 Furthermore, no direct evidence for clonal integrations was detected—i.e., we never detected multiple independent reads of the same integration site. This is consistent with our experimental data, indicating that integrations, though biased, do not gain clonal dominance.
Our transduction technique generated genetically modified cells that were both viable and functional in vivo as demonstrated by the detection of cells by qPCR in the peripheral blood for up to 2 weeks in most patients, their homing and expansion in sublethally irradiated immunodeficient mice (NSG) as measured by [18F]FHBG microPET/CT imaging, and their ability to induce lethal xenogeneic GvHD in these same NSG mice. Our xenograft GvHD model requires 3 × 10⁶ human T cells/NSG mouse to consistently induce GvHD (unpublished data), but ≤2 × 10⁶ T cells were injected per mouse in this study to ensure that sufficient TdT were available for infusion into our allogeneic stem cell transplantation recipients. Products transduced for patients TK02, TK03, and TK04 generated lethal xenogeneic GvHD in mice. Consistent with our previously published xenotransplantation BLI studies.7 [18F]FHBG microPET/CT scans on day 21 detected human TdT in the thymic region only in mice that developed GvHD. Two mice developed GvHD in the absence of this sign (one mouse each for TK03 and TK04 products). No radiolabel was present in the thymic region in any mouse that lacked evidence of GvHD.
While mice infused with TdT products for patients TK02 and TK04 developed xenogeneic GvHD, neither of these patients developed any signs of clinical GvHD. It should be emphasized that these xenograft mouse studies were performed to evaluate TdT function and not to predict which patients would develop GvHD. Patient TK02 succumbed to AML only 16 days after TdT infusion while TK04 survived sufficiently long (260 days) to assess for both acute and chronic GvHD, neither of which developed in this patient. In contrast, mice infused with TK07 TdTs did not develop GvHD, while TK07 was the only patient to possibly develop GvHD (elevated liver function tests). Although TK07's progressive liver function (LFT) abnormalities (thought to be possibly related to liver GvHD) did not respond to GCV in vivo, qPCR detected no circulating T cells at the time of onset and progression of these LFT abnormalities. Thus, it is conceivable that either this was not GvHD (biopsy was not performed) or that it was liver GvHD and the T cells causing it were either localized only in tissue (liver) and not the blood or that it was caused by residual donor T cells left over in the recipient after conditioning for the TdT DLI. Alternatively, the CD34-TK75 transgene may no longer have been expressed in the TdT cells, thus rendering them insensitive to the prodrug, GCV.16 The latter is a well-described event after transduction of target cells with oncoretroviral vectors in contrast to lentiviral vectors.27,28,29 Finally we cannot rule out alternative splicing (of the TK active site) as an alternative mechanism of GCV resistance.30
In this pilot study there was no change in the biodistribution of [18F]FHBG over baseline in the human subjects imaged. This may be due to the limited number of TdT infused, low density infiltration and expansion of the reporter cells within target tissues, and/or to the particular time points chosen for imaging. Other groups have successfully studied solid tumors by direct injection of TK-based viral vectors into specific tissues or tumors that would be expected to result in more focally concentrated [18F]FHBG signal.10,14
Because [18F]FHBG is not approved by the Food and Drug Administration and is associated with defined radiation exposure, it was recommended that our patients be imaged only 3 times, including at baseline to remain within the limits for organ and whole body doses prescribed by RDRC regulations (21 CFR 361.1). Since the earliest signs of acute GvHD typically become apparent at ~30 days post-transplantation, we chose day +14 and day +30 to perform postinfusion imaging, thinking that maximal TdT expansion would be occuring within that time interval. We have recently initiated a second HSV-TK gene therapy study (Clinicaltrials.gov #NCT00914628) in which [18F]FHBG PET/CT imaging will be performed after infusion of ~50-fold more (1–2 × 10⁷) TdT/kg than in the current study. Imaging times will be adjusted if the first two to three patients show no [18F]FHBG signal above background so as to optimize the possibility of detecting a distinctive migration pattern of HSV-TK- TdT in patients who develop GvHD.
Our results suggest that the generation of GMP grade [18F]FHBG for imaging and tracking of donor CD34-TK75 TdT in patients who relapse after allogeneic stem cell transplantation is both feasible and safe. CD34-TK75 TdT can be detected in patients for several weeks using qPCR and by [18F]FHBG microPET/CT imaging in NSG mice confirming their function, trafficking, expansion and GvHD-inducing potential in vivo. First-in-man [18F]FHBG PET/CT imaging of CD34-TK75 TdTs was performed in a subset of patients who received TdTs. Although no clear pattern above baseline could be identified in any patients, only one patient developed questionable GvHD of the liver which was unresponsive to GCV in vivo. Future trials using 10–100-fold more TdTs would be expected to increase the risk of GvHD, but should also enhance the chance of imaging TdTs in vivo using noninvasive imaging platforms like [18F]FHBG PET/CT. The hope is that in the future these noninvasive imaging studies may provide predictive insights into which patients have the highest risk of GvHD and at what sites and also allow early intervention with aggressive immunosuppressive approaches or GCV therapy to minimize or eliminate the risk.
Materials and Methods
Patients. Patients with any hematological disease who had cells available from their original donor were screened for eligibility and enrolled. The Food and Drug Administration reviewed the trial (IND 11917, clinicaltrials.gov NCT00871702) and laboratory standard operating procedures for all transduction and patient safety testing prior to trial initiation. Additional approval and oversight was provided by the National Institutes of Health Recombinant DNA Advisory Committee, the National Marrow Donor Program, and the following Washington University entities: the Protocol Review and Monitoring Committee, the Institutional Review Board, the Institutional Biological and Chemical Safety Committee, the Radioactive Drug Research Committee, and the Data and Safety Monitoring Committee. All patients (clinical characteristics summarized in Table 1 and Supplementary Table S1) were treated at Barnes-Jewish Hospital in St. Louis. Both patients and donors signed informed consent forms approved by the appropriate aforementioned entities. The Declaration of Helsinki protocols were followed.
Generation of transduced allogeneic donor cells. We established stably transfected 293GPG packaging cells31 that produce ΔU3CD34-TK75 γ-retrovirus as previously described.15 A clone was selected and sent to the National Gene Vector Biorepository (Indiana University, Indianapolis, IN) for production of a master cell bank and a clinical grade viral supernatant. Aliquots were titered and frozen at −80 °C.
Prior to transduction, all leukopheresed allogeneic donor cell products were frozen to minimize contamination with neutrophils as per instructions accompanying human T-Expander CD3/CD28 DynaBeads (Life Technologies, Grand Island, NY). Cells were maintained under cGMP conditions in Washington University's Biological Therapy Core Facility throughout the transduction protocol. PBMC were washed in Hanks balanced saline solution containing 2.5% human serum albumin, then enriched for CD3+ cells using 3 CD3/CD28 Dynabeads per CD3+ cell and a Dynal Magnetic Particle Concentrator (Life Technologies). Cells were transferred to a C750 Vuelife bag (American Fluoroseal Corporation, Gaithersburg, MD) at 1 × 10⁷/ml OpTimizer medium (Life Technologies) containing 20U IL2/ml and activated by the antibody-coated beads for 48 hours. To transduce the cells, ΔU3CD34-TK75 γ-retrovirus (~2 infectious units/CD3+ cell) and 8 µg polybrene/ml were added to the bag. Cells successfully transduced expressed the extracellular domain of CD34 on their surface.15 Following 48–72 hours of expansion, the transduction efficiency was assessed using flow cytometry and a pool of CD34 class I and II antibodies (Beckman Coulter catalog number IM1459; Indianapolis, IN). After removing the Dynabeads using a Fenwell MaxSep Magnetic Separator (Baxter, Deerfield, IL), cells were washed in PBS containing 2 mmol/l ethylenediaminetetraacetic acid and 25% human serum albumin, then centrifuged (510 × g, 7 minutes) to concentrate them. Remaining beads were removed using the magnetic particle concentrator, and the CD34+ TdT were selected using the CliniMacs CD34 reagent and selection column (Miltenyi Biotec, San Diego, CA). Cells were then frozen in Plasmalyte A (Baxter, Deerfield, IL) containing 10 U heparin/ml and 20% dimethyl sulfoxide pending outcome of the release testing. One percent of each cell product and 5% of each culture supernatant was retained to detect replication competent γ-retrovirus (Supplementary Methods). A fraction of the cell product sufficient to inject each of two mice with 2 × 10⁶ TdT was also withheld for correlative studies in mice (random gender, NOD.Cg-Prkdcscid Il2rgtm1Wjl/SzJ [NSG], Jackson Labs, Bar Harbor, ME).
Cell product identity, purity, and transduction efficiency were determined using flow cytometry to detect the cell surface expression of CD34, CD3, CD4, CD8, CD45, CD14, CD16, CD19, and CD56. Sensitivity to 1 µmol/l GCV in Dulbecco's modified Eagle's medium containing 10% fetal calf serum, 10 IU penicillin/ml, 10 µg streptomycin/ml, and 2 mmol/l L-glutamine for 5–7 days15 further confirmed cell identity as well as functionality of the transgene. Control NIH 3T3 cells (nontransduced (Non-td) and ΔU3CD34-TK75-transduced (Td)) were seeded in triplicate at 5 × 10³ cells/well of a 96-well plate. The donor T cells in individual patient cell products were seeded at 5 × 10⁴ cells/well and activated for 48 hours in the presence of 1 anti-CD3/anti-CD28-coated bead per cell. After 5–7 days, viability was assessed by reduction of the tetrazolium salt WST-1 (Roche, Indianapolis, IN) over a 1-hour period.
Analysis of peripheral blood post-DLI. Primers flanking the CD34/HSV-TK75 junction were used in a quantitative PCR (qPCR) reaction (and Quantitect Probe PCR Kit, Qiagen, Valencia, CA) to determine the number of copies of vector/100 ng genomic DNA in patient peripheral blood cells, an amount calculated to be equivalent to 25,000 human cells. PCR reactions consisted of a 94 °C, 15 minute hot start followed by 40 cycles of 15 seconds at 94 °C, 30 seconds at 55 °C, and 30 seconds at 73 °C. Probe targeting CD34-TK75 (Integrated DNA Technologies, Skokie, IL): FAM –AGGAGGAGATCTTGGTGGCGTGAAA TAMRA. CD34-TK75 forward primer: TGGGCATCACTGGCTATTTCCTGA. CD34-TK75 reverse primer: TTCTAGAAGGCGCTTGCCAAAGAG. The primers and probe for human GAPDH were those included in the TaqMan GAPDH control reagents kit (Applied Biosystems, Grand Island, NY). Control templates were normal human genomic DNA ± 5 × 10⁵ copies of ΔU3CD34-TK75 γ-retrovirus DNA.
A modified ligation-mediated PCR reaction (LM-PCR, Supplementary Methods, and Supplementary Table S2) was used to rapidly assess clonality in the donor product both before infusion and in patient samples at 3 months postinfusion or in the last sample obtained from patients expiring earlier than 3 months post-DLI. Targeted sequencing (Supplementary Methods) against the γ-retrovirus was performed to determine insertion site characteristics.
Detection of patient antibodies against CD34. Patient serum was reacted against murine NIH 3T3 cells transduced with ΔU3CD34-TK75 for 30 minutes at 4 °C. After washing in buffer, a secondary phycoerythrin-anti-human IgG antibody (BD PharMingen, San Jose, CA) was incubated with the cells for additional 30 minutes at 4 °C before washing. Flow cytometry was used to detect the extent of antibody binding. Specificity for the CD34 antigen was ascertained by reacting the serum against nontransduced NIH 3T3 cells. Control reactions substituted murine anti-human CD34 (BD PharMingen) for the primary antibody reaction and phycoerythrin (PE)-anti-mouse secondary antibody (BD PharMingen). An increase in mean fluorescence intensity of ≥ 3-fold over the prestudy value without any simultaneous increase for nontransduced cells was required to consider samples positive. Patient serum was collected to test for antibodies against CD34 prestudy and at 3 and 6 months post-DLI and archived at 12 months. Patients TK01, TK02, TK03, and TK07 passed away before the first scheduled serum collection at 3 months.
Elispot assay for patient cells producing γ-IFN against transduced donor cells. Transduced donor cells from the product prepared for the patient and patient PBMC collected before DLI, at 4 weeks, 8 weeks, 3 months, and 6 months after DLI, and at relapse were cryopreserved. After thawing, 3 × 10⁵ PBMC/well were stimulated against irradiated transduced (Td) donor cells (40 Gy, 1 × 10⁵ cells/well) or PHA (1.2 µg/ml). The frequency of γ-IFN producing cells was determined using an Elispot Assay kit (Becton Dickinson, Franklin Lakes, NJ) and a Cellular Technology (Shaker Heights, OH) plate reader to detect the number of γ-IFN producing cells.
[18F]FHBG PET/CT imaging. [18F]FHBG was produced onsite in the Mallinckrodt Institute of Radiology Nuclear Pharmacy and Cyclotron Facility according to the method of Peñueles32 modified by a solid purification step. Prior to release of the [18F]FHBG for human use, quality control testing was performed which included visual inspection, pH, radionuclidic identity, radiochemical and chemical purity analysis, tests for residual solvents, and bacterial endotoxin testing. Additionally, the [18F]FHBG mass was analyzed for each batch. Maximum mass allowable per patient dose was ≤ 1.2 µg.
PET was performed with a Biograph 40 TP/TV PET/CT scanner (Siemens, Knoxville, TN) at the Center for Clinical Imaging Research. Patients underwent three whole-body [18F]FHBG PET/CT studies: at baseline (within 30 days prior to infusion of donor T-cells into the patient), 10–16 days after infusion of donor T-cells, and 27–33 days after infusion of donor T-cells. Each patient received ~5.8 mCi (range 3.8–6.4 mCi) of [18F]FHBG intravenously. Whole-body (base of brain to upper thigh) imaging began ~50–70 and 110–130 minutes following the injection of [18F]FHBG. The mean total radiation exposure that the patients received from the three [18F]FHBG PET/CT studies was 3.2 rem (± 0.5; one patient underwent two PET/CT scans), which is within the limits prescribed by the RDRC regulations (21 CFR 361.1). Whole-body imaging consisted of a low dose CT obtained for attenuation correction (50 mAs, 120 KV, 0.5 seconds/rotation, 0.8 pitch) with appropriate adjustments based on patient size and weight followed by PET imaging, which consisted of 5–8 bed positions acquired at 3–5 minutes per bed position. Scans began ~50–70 minutes and 110–130 minutes after i.v. injection of [18F]FHBG, followed by a flush of ≥10 ml normal saline. Patients were encouraged to drink and void to reduce radiation exposure to the bladder. Imaging consisted of 5–8 bed positions at 3–5 minutes/position. Each area of uptake identified by a nuclear physician was both qualitatively and then semiquantitatively evaluated by determination of standardized uptake value by determination of the semiquantitative standardized uptake value33 of the normal organs such as heart, liver, spleen, kidney, and bladder. The images were also evaluated for foci of abnormal [18F]FHBG uptake within nodal or extranodal sites not masked by routes of [18F]FHBG excretion and not seen on baseline imaging.
In mouse studies, random pairs (one mouse receiving transduced donor T cells, one not) of mice were injected i.v. with ~150–500 uCi [18F]FHBG. One hour later, mice were anaesthetized with isoflurane, secured in a supine position, and imaged on either a Focus-220 microPET or Inveon microPET/CT (Siemens). MicroPET images were coregistered with CT images from the Inveon for anatomical visualization. SUVs were calculated based on manually drawn regions of interest over the upper body of the mouse, including the head and thorax but excluding the abdomen. Error is standard deviation.
SUPPLEMENTARY MATERIAL Table S1. Detailed patient characteristics. Table S2. Primers and adaptors used in modified LM–PCR reactions. Table S3. Integrations in donor samples (hg19 coordinates). Table S4. Cancer--related genes near integration sites. Table S5. DAVID pathway analysis of genes near viral integration sites. Table S6. Regions of human genome (hg19) homologous to retroviral sequence. Figure S1. Sequencing reads mapped to retrovirus.
Acknowledgments
We would like to acknowledge all donors and patients who participated in the trial at Barnes-Jewish Hospital in St. Louis. We thank Dr. Sam Gambhir for providing early guidance on protocol development for the clinical translation of [18F]FHBG into patient trials. Mice were imaged and scans were analyzed in the Washington University (WU) Preclinical PET/CT Imaging Facility with the assistance of Lori Strong, Nichole Fettig, Ann Stroncek, Amanda Roth, and Margaret Morris. The WU Cyclotron Facility prepared the 18FHBG. The Indiana University Vector Production Facility produced our master cell bank and a clinical grade viral supernatant. Transduction of the cells occurred in the WU Biological Therapy Core Facility under cGMP conditions with the assistance of Heather Missey and William Swaney. Transcriptome profiles of non-malignant T cell RNA-seq data were generously provided by Drs. Timothy Ley and analyzed by Dr. David Spencer (WU). Dr. Lee Ratner (WU) provided advice on development of the LM-PCR technique. We would further like to acknowledge the support of the following grants to the indicated individuals: NIH/NCI R01 CA83845 (PI: JFD), NIH/NCE R01 CA110489 (PI: JFD), NIH P50 CA094056-09 (PI: DPW and S. Achilefu, Project 4 PI: JFD), Barnes-Jewish Hospital Foundation Award 7603–55 (PI: JFD), and Siteman Cancer Center/Barnes-Jewish Hospital Foundation: Cancer Frontier Research Development Award (PI:JFD). The authors report no conflicts of interest.
Supplementary Material
References
- Appelbaum, FR (2007). Hematopoietic-cell transplantation at 50. N Engl J Med 357: 1472–1475. [DOI] [PubMed] [Google Scholar]
- Horowitz, MM, Gale, RP, Sondel, PM, Goldman, JM, Kersey, J, Kolb, HJ et al. (1990). Graft-versus-leukemia reactions after bone marrow transplantation. Blood 75: 555–562. [PubMed] [Google Scholar]
- Oliveira, G, Greco, R, Lupo-Stanghellini, MT, Vago, L and Bonini, C (2012). Use of TK-cells in haploidentical hematopoietic stem cell transplantation. Curr Opin Hematol 19: 427–433. [DOI] [PubMed] [Google Scholar]
- Di Stasi, A, Tey, SK, Dotti, G, Fujita, Y, Kennedy-Nasser, A, Martinez, C et al. (2011). Inducible apoptosis as a safety switch for adoptive cell therapy. N Engl J Med 365: 1673–1683. [DOI] [PMC free article] [PubMed] [Google Scholar]
- Mailly, L, Leboeuf, C, Tiberghien, P, Baumert, T and Robinet, E (2010). Genetically engineered T-cells expressing a ganciclovir-sensitive HSV-tk suicide gene for the prevention of GvHD. Curr Opin Investig Drugs 11: 559–570. [PubMed] [Google Scholar]
- Harris, AC, Ferrara, JL and Levine, JE (2013). Advances in predicting acute GVHD. Br J Haematol 160: 288–302. [DOI] [PMC free article] [PubMed] [Google Scholar]
- Nervi, B, Rettig, MP, Ritchey, JK, Wang, HL, Bauer, G, Walker, J et al. (2007). Factors affecting human T cell engraftment, trafficking, and associated xenogeneic graft-vs-host disease in NOD/SCID beta2mnull mice. Exp Hematol 35: 1823–1838. [DOI] [PMC free article] [PubMed] [Google Scholar]
- Gross, S and Piwnica-Worms, D (2005). Spying on cancer: molecular imaging in vivo with genetically encoded reporters. Cancer Cell 7: 5–15. [DOI] [PubMed] [Google Scholar]
- Yaghoubi, SS and Gambhir, SS (2006). PET imaging of herpes simplex virus type 1 thymidine kinase (HSV1-tk) or mutant HSV1-sr39tk reporter gene expression in mice and humans using [18F]FHBG. Nat Protoc 1: 3069–3075. [DOI] [PubMed] [Google Scholar]
- Peñuelas, I, Mazzolini, G, Boán, JF, Sangro, B, Martí-Climent, J, Ruiz, M et al. (2005). Positron emission tomography imaging of adenoviral-mediated transgene expression in liver cancer patients. Gastroenterology 128: 1787–1795. [DOI] [PubMed] [Google Scholar]
- Luker, GD, Sharma, V, Pica, CM, Dahlheimer, JL, Li, W, Ochesky, J et al. (2002). Noninvasive imaging of protein-protein interactions in living animals. Proc Natl Acad Sci USA 99: 6961–6966. [DOI] [PMC free article] [PubMed] [Google Scholar]
- Alauddin, MM and Conti, PS (1998). Synthesis and preliminary evaluation of 9-(4-[18F]-fluoro-3-hydroxymethylbutyl)guanine ([18F]FHBG): a new potential imaging agent for viral infection and gene therapy using PET. Nucl Med Biol 25: 175–180. [DOI] [PubMed] [Google Scholar]
- Black, ME, Newcomb, TG, Wilson, HM and Loeb, LA (1996). Creation of drug-specific herpes simplex virus type 1 thymidine kinase mutants for gene therapy. Proc Natl Acad Sci USA 93: 3525–3529. [DOI] [PMC free article] [PubMed] [Google Scholar]
- Yaghoubi, SS, Jensen, MC, Satyamurthy, N, Budhiraja, S, Paik, D, Czernin, J et al. (2009). Noninvasive detection of therapeutic cytolytic T cells with 18F-FHBG PET in a patient with glioma. Nat Clin Pract Oncol 6: 53–58. [DOI] [PMC free article] [PubMed] [Google Scholar]
- Rettig, MP, Ritchey, JK, Meyerrose, TE, Haug, JS and DiPersio, JF (2003). Transduction and selection of human T cells with novel CD34/thymidine kinase chimeric suicide genes for the treatment of graft-versus-host disease. Mol Ther 8: 29–41. [DOI] [PubMed] [Google Scholar]
- Bennour, E, Ferrand, C, Rémy-Martin, JP, Certoux, JM, Gorke, S, Qasim, W et al. (2008). Abnormal expression of only the CD34 part of a transgenic CD34/herpes simplex virus-thymidine kinase fusion protein is associated with ganciclovir resistance. Hum Gene Ther 19: 699–709. [DOI] [PubMed] [Google Scholar]
- Deichmann, A, Hacein-Bey-Abina, S, Schmidt, M, Garrigue, A, Brugman, MH, Hu, J et al. (2007). Vector integration is nonrandom and clustered and influences the fate of lymphopoiesis in SCID-X1 gene therapy. J Clin Invest 117: 2225–2232. [DOI] [PMC free article] [PubMed] [Google Scholar]
- Eissenberg, LG, Rettig, M, Dehdashti, F, Piwnica-Worms, D and DiPersio, JF (2014). Suicide genes: monitoring cells in patients with a safety switch. Front Pharmacol 5: 241. [DOI] [PMC free article] [PubMed] [Google Scholar]
- Campbell, DO, Yaghoubi, SS, Su, Y, Lee, JT, Auerbach, MS, Herschman, H et al. (2012). Structure-guided engineering of human thymidine kinase 2 as a positron emission tomography reporter gene for enhanced phosphorylation of non-natural thymidine analog reporter probe. J Biol Chem 287: 446–454. [DOI] [PMC free article] [PubMed] [Google Scholar]
- Mercier-Letondal, P, Deschamps, M, Sauce, D, Certoux, JM, Milpied, N, Lioure, B et al. (2008). Early immune response against retrovirally transduced herpes simplex virus thymidine kinase-expressing gene-modified T cells coinfused with a T cell-depleted marrow graft: an altered immune response? Hum Gene Ther 19: 937–950. [DOI] [PubMed] [Google Scholar]
- Zhan, H, Gilmour, K, Chan, L, Farzaneh, F, McNicol, AM, Xu, JH et al. (2013). Production and first-in-man use of T cells engineered to express a HSVTK-CD34 sort-suicide gene. PLoS One 8: e77106. [DOI] [PMC free article] [PubMed] [Google Scholar]
- Cieri, N, Mastaglio, S, Oliveira, G, Casucci, M, Bondanza, A and Bonini, C (2014). Adoptive immunotherapy with genetically modified lymphocytes in allogeneic stem cell transplantation. Immunol Rev 257: 165–180. [DOI] [PubMed] [Google Scholar]
- Berger, C, Flowers, ME, Warren, EH and Riddell, SR (2006). Analysis of transgene-specific immune responses that limit the in vivo persistence of adoptively transferred HSV-TK-modified donor T cells after allogeneic hematopoietic cell transplantation. Blood 107: 2294–2302. [DOI] [PMC free article] [PubMed] [Google Scholar]
- Recchia, A, Bonini, C, Magnani, Z, Urbinati, F, Sartori, D, Muraro, S et al. (2006). Retroviral vector integration deregulates gene expression but has no consequence on the biology and function of transplanted T cells. Proc Natl Acad Sci USA 103: 1457–1462. [DOI] [PMC free article] [PubMed] [Google Scholar]
- Scholler, J, Brady, TL, Binder-Scholl, G, Hwang, WT, Plesa, G, Hege, KM et al. (2012). Decade-long safety and function of retroviral-modified chimeric antigen receptor T cells. Sci Transl Med 4: 132ra53. [DOI] [PMC free article] [PubMed] [Google Scholar]
- Derse, D, Crise, B, Li, Y, Princler, G, Lum, N, Stewart, C et al. (2007). Human T-cell leukemia virus type 1 integration target sites in the human genome: comparison with those of other retroviruses. J Virol 81: 6731–6741. [DOI] [PMC free article] [PubMed] [Google Scholar]
- Lois, C, Hong, EJ, Pease, S, Brown, EJ and Baltimore, D (2002). Germline transmission and tissue-specific expression of transgenes delivered by lentiviral vectors. Science 295: 868–872. [DOI] [PubMed] [Google Scholar]
- Pfeifer, A, Ikawa, M, Dayn, Y and Verma, IM (2002). Transgenesis by lentiviral vectors: lack of gene silencing in mammalian embryonic stem cells and preimplantation embryos. Proc Natl Acad Sci USA 99: 2140–2145. [DOI] [PMC free article] [PubMed] [Google Scholar]
- Cherry, SR, Biniszkiewicz, D, van Parijs, L, Baltimore, D and Jaenisch, R (2000). Retroviral expression in embryonic stem cells and hematopoietic stem cells. Mol Cell Biol 20: 7419–7426. [DOI] [PMC free article] [PubMed] [Google Scholar]
- Garin, MI, Garrett, E, Tiberghien, P, Apperley, JF, Chalmers, D, Melo, JV et al. (2001). Molecular mechanism for ganciclovir resistance in human T lymphocytes transduced with retroviral vectors carrying the herpes simplex virus thymidine kinase gene. Blood 97: 122–129. [DOI] [PubMed] [Google Scholar]
- Ory, DS, Neugeboren, BA and Mulligan, RC (1996). A stable human-derived packaging cell line for production of high titer retrovirus/vesicular stomatitis virus G pseudotypes. Proc Natl Acad Sci USA 93: 11400–11406. [DOI] [PMC free article] [PubMed] [Google Scholar]
- Peñuelas, I, Boán, JF, Martí-Climent, JM, Barajas, MA, Narvaiza, I, Satyamurthy, N et al. (2002). A fully automated one pot synthesis of 9-(4-[18F]fluoro-3-hydroxymethylbutyl) guanine for gene therapy studies. Mol Imaging Biol 4: 415–424. [DOI] [PubMed] [Google Scholar]
- Yang, Y, MacLeod, V, Dai, Y, Khotskaya-Sample, Y, Shriver, Z, Venkataraman, G et al. (2007). The syndecan-1 heparan sulfate proteoglycan is a viable target for myeloma therapy. Blood 110: 2041–2048. [DOI] [PMC free article] [PubMed] [Google Scholar]
- Schmaltz, C, Alpdogan, O, Kappel, BJ, Muriglan, SJ, Rotolo, JA, Ongchin, J et al. (2002). T cells require TRAIL for optimal graft-versus-tumor activity. Nat Med 8: 1433–1437. [DOI] [PubMed] [Google Scholar]
Associated Data
This section collects any data citations, data availability statements, or supplementary materials included in this article.


