Abstract
Glaucoma, a common cause of blindness, is currently treated by intraocular pressure (IOP)–lowering interventions. However, this approach is insufficient to completely prevent vision loss. Here, we evaluate an IOP-independent gene therapy strategy using a modified erythropoietin, EPO-R76E, which has reduced erythropoietic function. We used two models of glaucoma, the murine microbead occlusion model and the DBA/2J mouse. Systemic recombinant adeno-associated virus–mediated gene delivery of EpoR76E (rAAV.EpoR76E) was performed concurrent with elevation of IOP. Axon structure and active anterograde transport were preserved in both models. Vision, as determined by the flash visual evoked potential, was preserved in the DBA/2J. These results show that systemic EpoR76E gene therapy protects retinal ganglion cells from glaucomatous degeneration in two different models. This suggests that EPO targets a component of the neurodegenerative pathway that is common to both models. The efficacy of rAAV.EpoR76E delivered at onset of IOP elevation supports clinical relevance of this treatment.
Introduction
Glaucoma is the most common cause of permanent blindness worldwide. It is a progressive optic neuropathy characterized by degeneration of retinal ganglion cell (RGC) axons and subsequent death of RGC somata. Although age is the single most significant risk factor for development of glaucoma, intraocular pressure (IOP) is the only modifiable risk factor. Pharmaceutical and surgical interventions that lower IOP slow but do not always halt progression of the disease.1,2 In addition, poor patient compliance in administering IOP-lowering eye drops is a significant challenge. Due to the shortcomings in IOP-lowering therapeutic strategies, an IOP-independent approach that blocks the neurodegeneration underlying vision loss in glaucoma is needed. To avoid challenges of poor patient compliance with eye drops, a new therapy would ideally have a prolonged therapeutic effect since glaucoma is a long-term, progressive degeneration. We propose gene therapy, which can provide long-term, continuous delivery of a neuroprotective molecule after a single injection.
Erythropoietin (EPO) is a cytokine that regulates erythropoiesis. After secretion into the systemic circulation by the liver, EPO binds and interacts with its cognate receptor—the erythropoietin receptor (EpoR) homodimer—to inhibit apoptosis of erythroid progenitor cells and facilitate erythrocyte production (for review, see ref. 3). In addition, EPO and its receptor are produced at lower levels in nonhematopoietic tissue including the retina.4 In the central nervous system, EPO acts on a variety of cell types where it plays a role in regulating cell death, oxidative stress, and neuroinflammation (for review, see ref. 5). Due to these pleiotropic effects, EPO possesses significant therapeutic potential in neurodegenerative diseases. However, recombinant EPO is of limited utility for the treatment of glaucoma due to slow disease progression, the short half-life of EPO in vivo, and the increase in red blood cell production caused by repeat treatment with systemic EPO.6,7 To overcome these obstacles, we use viral gene delivery of a mutant form of EPO, EPO-R76E, that has attenuated erythropoietic activity.8,9 Treatment with recombinant adeno-associated virus (rAAV) provides sustained, long-term delivery of EPO-R76E without a dangerous rise in hematocrit.8,9 Furthermore, we previously demonstrated that rAAV.EpoR76E is neuroprotective in multiple models of neurodegeneration.10,11
We previously showed that systemic gene delivery of rAAV.EpoR76E given prior to development of elevated IOP in the DBA/2J mouse model of pigment dispersion glaucoma preserved the RGC axons, cell bodies, and vision out to 10 months of age.7,12 In the current study, we extend these results in two important ways. First, we performed treatment at the onset of IOP increase, the earliest time point for clinical intervention. Second, we tested therapeutic efficacy in an inducible model of glaucoma, the murine microbead occlusion model.13,14 The DBA/2J exhibits neuroinflammation in the retina prior to development of elevated IOP, potentially due to altered ocular immune privilege in this strain and could confound glaucoma studies.15 The mouse microbead occlusion model also models closed angle glaucoma, but without pigment dispersion or high baseline neuroinflammation.13 One of the earliest signs of glaucoma is a deficit in axon transport, which is influenced greatly by age.13,16,17,18 In both models, axon transport deficits precede axon degeneration, which precedes RGC death.18 In the DBA/2J in particular,19 RGC bodies in the retina persist after a period of axonopathy that includes early deficits in anterograde transport.7,16 We report the effects of rAAV.EpoR76E on axon transport, optic nerve histology, and vision.
Results
Systemic gene delivery of EpoR76E does not cause an unsafe rise in hematocrit in the microbead occlusion model
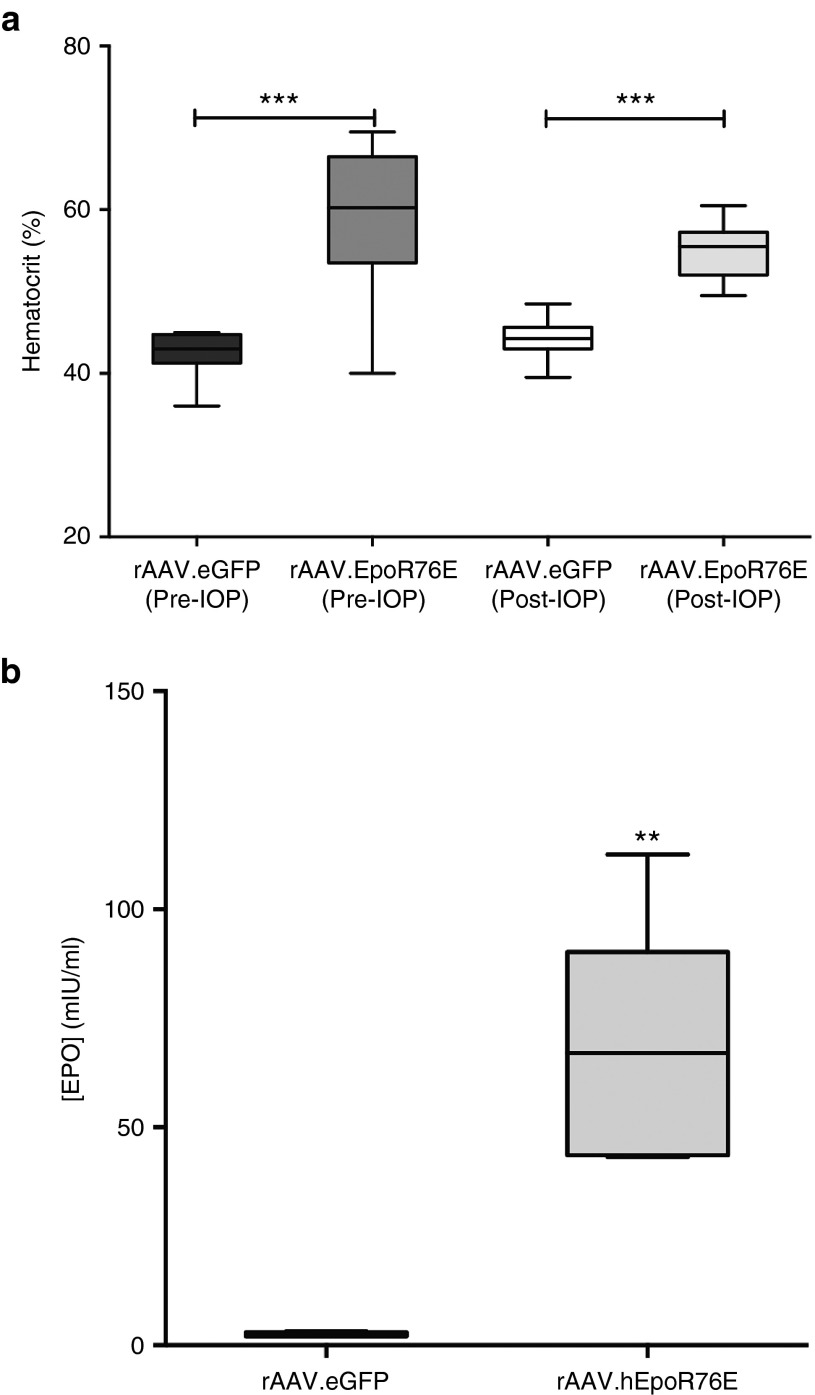
Mice in both the pre- (59 ± 9%) and post-IOP induction treatment groups (55 ± 4%) showed a significant increase in hematocrit as compared to mice that received rAAV2/8.eGFP (42 ± 3%; P < 0.001) or rAAV2/1.eGFP (44 ± 2%; P < 0.001), respectively (Figure 1a). The hematocrit level in both rAAV.eGFP cohorts was within the normal range for mice.20 In all cases, the hematocrit was well below that induced by wild-type EPO, and phlebotomy was not needed.9 Animals in the post-IOP treatment group had a significantly increased serum EPO concentration of 67 ± 28 mIU/ml as compared to 2.4 ± 0.6 mIU/ml in rAAV2/1.eGFP-injected mice (P < 0.01; Figure 1b). This increase is similar to our previously published studies using this gene therapy strategy.7
Figure 1.
Systemic rAAV-mediated delivery of EpoR76E causes a rise in hematocrit and serum EPO concentration in microbead-injected mice. Hematocrit and serum EPO concentration were assessed at collection. (a) Box plot of hematocrit levels in mice that received rAAV2/8.mEpoR76E (Pre-IOP) and rAAV2/1.hEpoR76E (Post-IOP) compared to mice that received rAAV.eGFP of the corresponding serotype. (b) Box plot of serum EPO concentration in mice that received rAAV2/1.eGFP or rAAV2/1.hEpoR76E. Data are unavailable for mice that received rAAV2/8.mEpoR76E due to insufficient sensitivity of the ELISA kit to mEPO. EPO, erythropoietin; IOP, intraocular pressure; rAAV, recombinant adeno-associated virus.
Systemic gene delivery of EpoR76E does not influence IOP elevation in the microbead occlusion model
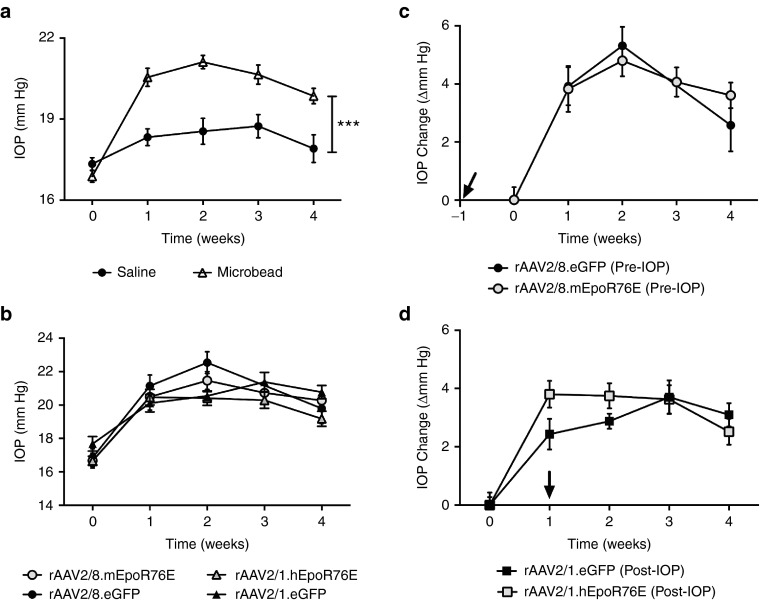
Either 1 month following rAAV2/8.mEpoR76E administration (pre-IOP group) or immediately prior to rAAV2/1.hEpoR76E administration (post-IOP group), IOP was elevated by anterior chamber injection of polystyrene microbeads as described previously.13 IOP was elevated to an average of 3.6 ± 0.3 mm Hg (average ± SEM; P < 0.001) at 1 week post-injection and remained stable over the course of the study (Figure 2a). No significant elevation of IOP was observed in the saline-injected animals. When stratified by treatment group, we observed no difference in IOP elevation either initially or over the 4-week period between animals receiving rAAV.EpoR76E or rAAV.eGFP (Figure 2b–d), suggesting that the effects of rAAV.EpoR76E gene therapy are not due to lowering IOP. This was true whether assessing absolute value of IOP or change from baseline (Figure 2b–d).
Figure 2.
Intraocular pressure is increased in mice receiving anterior chamber microbead injection. (a) Graph of IOP level in microbead-injected mice compared to saline-injected mice over a 4-week period following injection (n = 60). (b) Graph of change in IOP in each experimental group over time. (c) Graph of change in IOP elevation from baseline over time in mice that received rAAV2/8.mEpoR76E or rAAV2/8.eGFP 1-month prior to microbead injection (pre-IOP). (d) Graph of change in IOP elevation from baseline over time in mice that received rAAV2/1.hEpoR76E or rAAV2/1.eGFP immediately after microbead injection (post-IOP). Arrows in c and d indicate onset of gene expression from rAAV. IOP, intraocular pressure; rAAV, recombinant adeno-associated virus.
Both pre- and post-IOP treatment with rAAV.EpoR76E maintains normal RGC anterograde transport in the microbead occlusion model
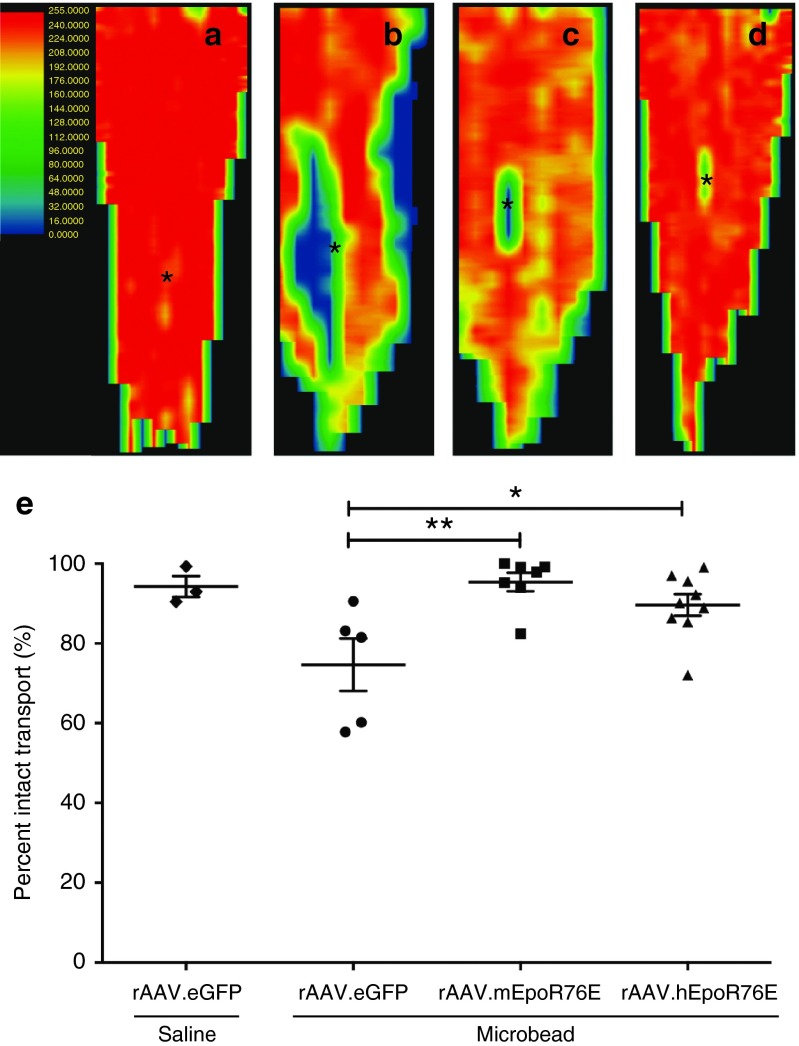
Active anterograde axon transport of fluorescent cholera toxin b (CTB) from the RGC to the superior colliculus (SC) was quantified and converted to a retinotopic map following previously published methods.17,21,22 In saline-injected mice, CTB was transported to all retinotopic regions of the SC as expected (Figure 3a). In contrast, focal deficits in transported signal were apparent in the rAAV.eGFP-treated microbead-injected animals (Figure 3b). The pattern of this deficit progressing from the periphery to the representation of the optic nerve is consistent with previous findings.23 These deficits were largely absent in both the pre- and post-IOP treatment groups (Figure 3c,d). Quantification of intact transport throughout the SC volume showed 94 ± 5% and 75 ± 15% axon transport in rAAV.eGFP-treated mice that received an intravitreal injection of saline and microbeads, respectively. Active anterograde transport was significantly improved in both the pre- and the post-IOP treatment groups at 95 ± 6% and 90 ± 8%, respectively (P < 0.01; Figure 3e). Neither rAAV.EpoR76E treatment group was statistically different from the saline-injected group, nor were the treatment groups statistically different from each other.
Figure 3.
RGC anterograde transport is preserved 4 weeks after microbead injection in mice treated with rAAV.EpoR76E. (a–d) Representative normalized fluorescence intensity heat maps of the SC with red representing maximum intensity and blue/black representing no fluorescence: (a) saline, rAAV.eGFP, (b) microbead, rAAV.eGFP, (c) microbead, rAAV2/8.mEpoR76E (pre-IOP), and (d) microbead, rAAV2/1.hEpoR76E (post-IOP treatment). The representation of the optic nerve head is indicated (asterisk). (e) Box plot of percent intact transport of mice injected with microbeads and rAAV.eGFP (n = 5), rAAV2/8.mEpoR76E (n = 8), or rAAV2/1.hEpoR76E (n = 9). IOP, intraocular pressure; rAAV, recombinant adeno-associated virus; SC, superior colliculus.
Both pre- and post-IOP treatment with rAAV.EpoR76E preserves RGC axons in the microbead occlusion model
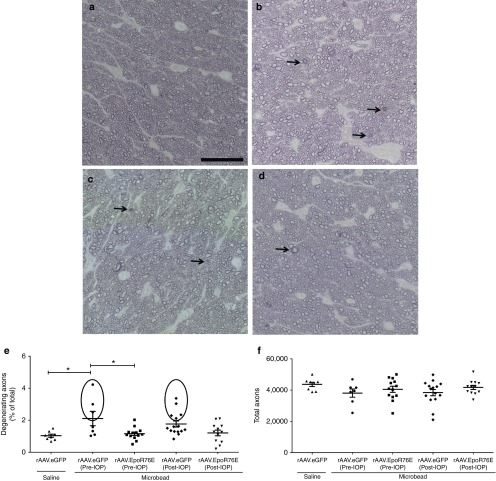
In saline-injected eyes, the optic nerves contained healthy axons as determined by the clear axoplasm surrounded by darkly stained myelin (Figure 4a). In contrast, 4 weeks after microbead injection, many degenerating axon profiles were detected (Figure 4b). Degenerative axons were identified by dark axoplasm and/or multi-layering of myelin (Figure 4b–d, arrows). Optic nerves from both the pre- and post-IOP rAAV.EpoR76E treatment groups appeared to have fewer degenerative axons than the rAAV.eGFP-injected mice (Figure 4c,d). The percentage of degenerating RGC axons was 2.1 ± 1.2% and 1.8 ± 0.7% in the microbead-injected mice that received rAAV.eGFP pre- or post-IOP elevation, respectively. Fewer degenerating axons were present in the optic nerves from microbead-injected mice that received rAAV.EpoR76E either pre- or post-IOP elevation; 1.2 ± 0.4% (P < 0.01) and 1.2 ± 0.6% (P < 0.05), respectively (Figure 4e). In addition, the groups showed unequal variances of percent degenerating axons (P < 0.001). In the microbead, pre-IOP, rAAV2/8.eGFP mice, 43% of the optic nerves had 3.2 ± 0.9% degenerating axons (circled area), while the remaining had 1.3 ± 0.2% degenerating axons (Figure 4e). In the microbead-injected mice receiving rAAV2/1.eGFP post-IOP elevation, 33% of the optic nerves had 2.6 ± 0.5% degenerating axons (circled area), while the remaining had 1.3 ± 0.2% degenerating axons. This demonstrates the presence of two populations and illustrates the variability at the 4-week time point in this model. In contrast, only 1 (8%) and 2 (18%) optic nerves in the pre- and post-IOP treatment groups, respectively, contained greater than 2% degenerating axons. No difference was detected in the total number of axons between groups. The total number of remaining RGC axons was 87 ± 16% and 88 ± 18% in the pre- and post-IOP rAAV.eGFP-treated mice, respectively, and 93 ± 16% and 96 ± 11% in the pre- and post-IOP rAAV.EpoR76E treatment groups, respectively (Figure 4f). Despite a trend for decreased loss of axons in the treated mice, the difference was not statistically significant, because loss of axons in rAAV.eGFP microbead eyes was very mild. This is not entirely unexpected, since in the microbead model like other inducible models, overt axon degeneration lags deficits in transport and is subject to variability.14,18,23
Figure 4.
Optic nerve histology is preserved 4 weeks after microbead injection in mice treated with rAAV.EpoR76E. (a–d) Representative bright-field images of p-phenylenediamine-stained optic nerve cross sections proximal to the retina of mice treated with: (a) saline, rAAV.eGFP, (b) microbead, rAAV.eGFP, (c) microbead, rAAV2/8.mEpoR76E (pre-IOP), (d) microbead, rAAV2/1.hEpoR76E (post-IOP). Arrows indicate degenerating axons. Bar = 25 µm. (e) Scatter plot of the percent of degenerating axons in the optic nerves of mice from each experimental group. Circles indicate optic nerves with percent degeneration greater than 1 SE above the mean. (f) Scatter plot of total axons in the optic nerves in the rAAV.eGFP-treated microbead-injected mice (n = 22) and mice in the pre-IOP (n = 13) and post-IOP treatment (n = 11) groups. IOP, intraocular pressure; rAAV, recombinant adeno-associated virus.
Vision is not significantly decreased at 4 weeks in the microbead occlusion model
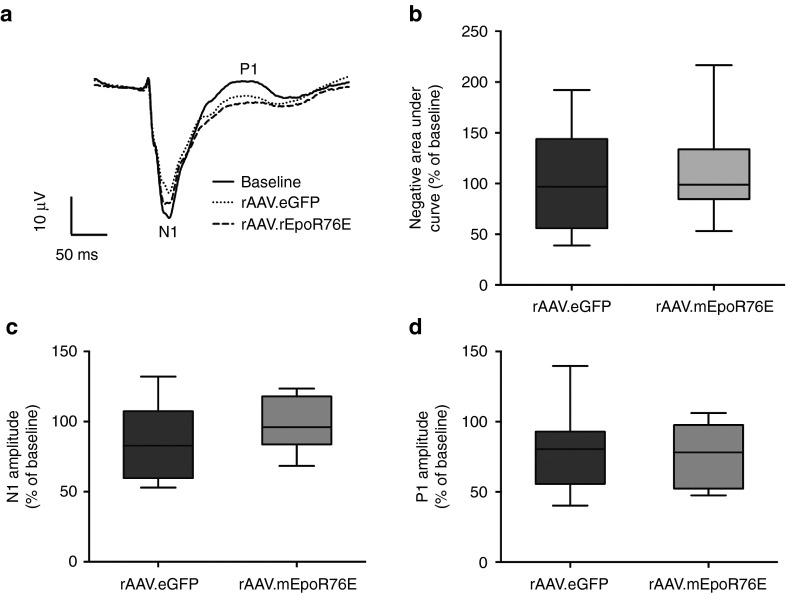
To assess visual function, we performed flash visual evoked potentials (fVEP). The amplitude of the N1 and P1 peaks (indicated in Figure 5a) represents the number of functional RGC axons, while the latency of the N1 and P1 represents how well the RGC axons propagate the action potential down the optic nerve. Mean waveforms comparing baseline and endpoint recordings showed an apparent deficit in N1 amplitude in the rAAV2/8.eGFP microbead-injected group but not the rAAV2/8.mEpoR76E (pre-IOP) group (Figure 5a). The P1 amplitude appeared decreased at 4 weeks as compared to baseline (Figure 5a). However, analysis of the negative area under the curve of the fVEP waveform from onset of stimulus to the peak of P1 showed no significant differences between the rAAV2/8.eGFP microbead-injected group (103 ± 47% of baseline) and the rAAV2/8.mEpoR76E group (113 ± 43% of baseline; Figure 5b). In addition, while there appeared to be a trend towards preservation of the N1 and P1 amplitudes, the difference did not reach statistical significance (Figure 5c,d). The N1 amplitude was reduced 14.5 ± 7.5% in the rAAV2/8.eGFP microbead-injected group compared to 1.3 ± 7.3% in the rAAV2/8.mEpoR76E-treated group (P value not significant; Figure 5c). There was a P1 amplitude reduction of 21.2 ± 7.3% in the rAAV2/8.eGFP microbead-injected group and 20.6 ± 8.6% in the rAAV2/8.mEpoR76E–treated group (Figure 5d), and the groups were not statistically different from each other (P = 0.98). Due to the subtle functional deficits observed in the rAAV2/8.eGFP microbead-injected animals at this 4-week time point and lack of statistical benefit from treatment with rAAV2/8.mEpoR76E given prior to onset of elevated IOP, we did not assess fVEP in the post-IOP treatment group.
Figure 5.
The fVEP shows a trend of improvement of functional vision 4 weeks after microbead injection in mice treated with rAAV2/8.mEpoR76E (pre-IOP). (a) Overlay of averaged waveforms from mice prior to (baseline) and 4 weeks after microbead injections and treatment with AAV2/8.eGFP (n = 13) or rAAV2/8.mEpoR76E (n = 7). The peaks of the N1 and P1 amplitudes are labeled. (b) Box plot quantification of the negative area under the curve from 20 to 175 ms (the average P1 latency) presented as percentage of baseline. (c) Box plot of N1 amplitude presented as percent change from baseline. (d) Box plot of P1 amplitude presented as percent change from baseline. fVEP, flash visual evoked potential; rAAV, recombinant adeno-associated virus.
rAAV2/8.mEpoR76E resulted in a slight rise in hematocrit and had no effect on IOP elevation in the DBA/2J model
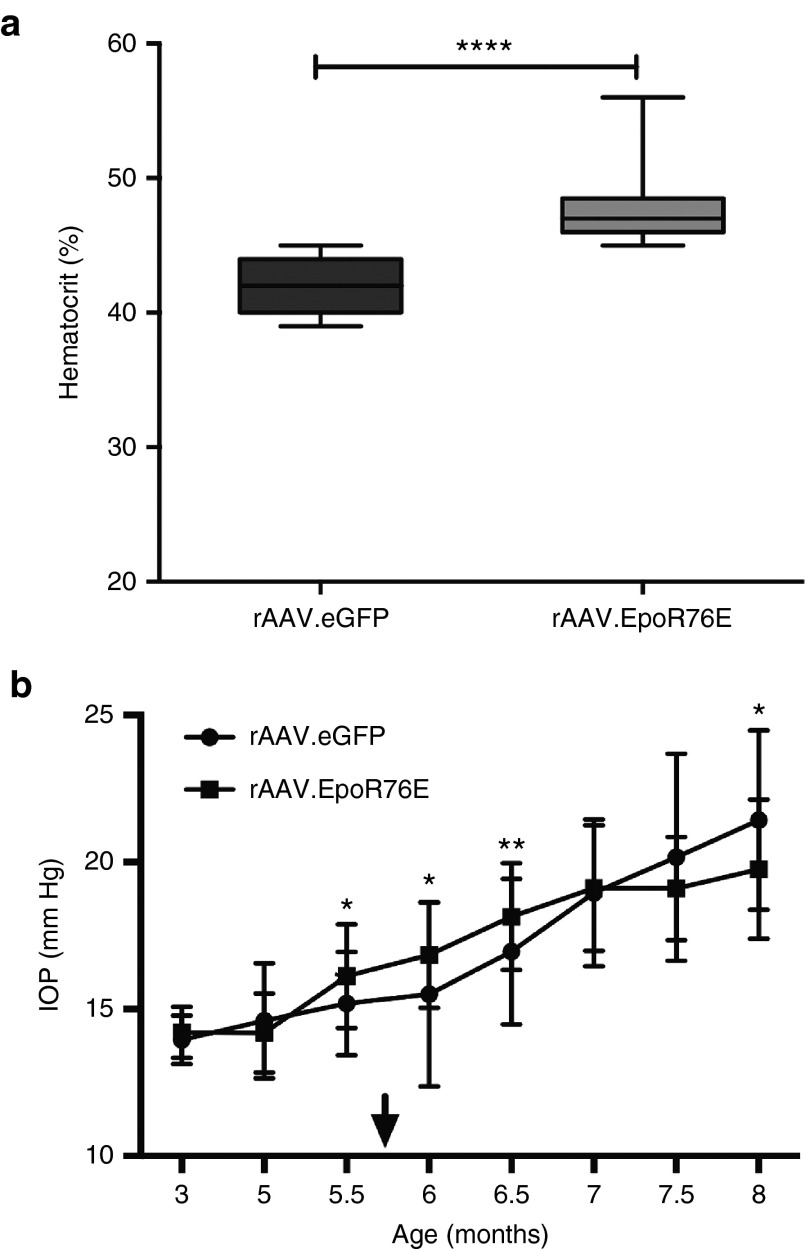
Mice treated with rAAV2/8.eGFP had a hematocrit of 42 ± 1.9%, while those that received rAAV2/8.mEpoR76E had an average hematocrit of 48 ± 2.7% (P < 0.001; Figure 6a). This level of increase in hematocrit is comparable to that induced in our previous studies.7,8,9 In addition, the hematocrit level in both the rAAV2/8.eGFP and rAAV2/8.mEpoR76E groups was within the normal range for mice.20
Figure 6.
Treatment of DBA/2J mice with rAAV2/8.mEpoR76E causes an elevation in hematocrit, and no change in IOP as compared to rAAV2/8.eGFP. (a) Box plot of endpoint hematocrit in mice treated with rAAV2/8.eGFP or rAAV2/8.mEpoR76E. (b) Graph of IOP over time in mice treated with rAAV2/8.eGFP or rAAV2/8.mEpoR76E. Arrow indicates onset of peak gene expression levels from rAAV. IOP, intraocular pressure; rAAV, recombinant adeno-associated virus.
The IOP began to increase at 5 months of age and by 7 months most of the mice had elevated IOP (Figure 6b). The peak of gene expression from rAAV2/8 is 2–3 weeks after transduction.24 Mice were transduced with rAAV2/8 at 5 months of age, resulting in therapeutic levels of gene expression at 5.5–5.75 months. Treatment with rAAV2/8.mEpoR76E had no effect on IOP level (Figure 6b). IOP measurements were not performed past 8 months of age due to age-related changes to the cornea that can influence readings.25,26 However, direct measurement of IOP using cannulation indicates that mice with elevated IOP at 8 months of age typically continue to have elevated IOP out to 10 months of age.17,27 In some eyes, IOP can decrease at older ages (e.g., 12–19 months) due to ongoing iris atrophy.19 The current study was completed at 10 months of age, when most DBA/2J mice demonstrated a nearly complete loss of axon transport from the retina to the SC independent of IOP.17
Post-IOP treatment with rAAV2/8.mEpoR76E preserved axon transport in the optic nerve in the DBA/2J model
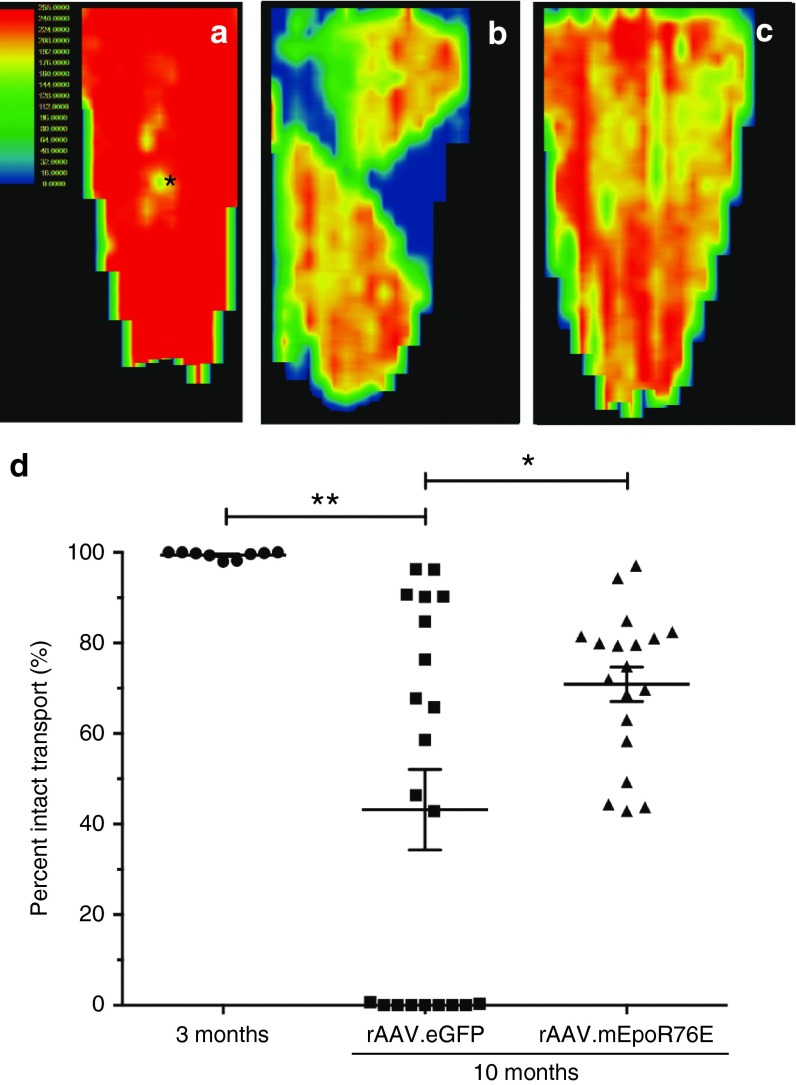
Axon transport of CTB appeared fully intact in the 3-month-old DBA/2J mice (Figure 7a). In the 10-month-old DBA/2J mice treated with rAAV2/8.eGFP, there was decreased axon transport throughout the SC and pronounced sectoral deficits, consistent with previous observations in this strain (Figure 7b).28 In the 10-month-old DBA/2J mice that received rAAV2/8.mEpoR76E, axon transport was diminished as compared to the 3-month-old controls, but there was no sectoral deficit as in the rAAV2/8.eGFP mice (Figure 7c). The fluorescence in the SC was quantified to determine the percent intact transport (Figure 7d). The 3-month-old mice exhibited 99 ± 0.8% intact transport. Consistent with the original characterization of this method in these mice, there was a wide range in axon transport levels in the 10-month-old rAAV2/8.eGFP-treated mice.17 Nearly half of the mice had no intact transport, a few had almost completely intact transport, and the remaining half exhibited 50–80% transport (Figure 7d). Every SC examined in the 10-month rAAV2/8.mEpoR76E-treated group exhibited 43% or higher levels of axon transport, and there was no example of zero transport. The average percent intact axon transport in these mice was 71 ± 17%. There was a statistically significant difference in axon transport between the 3-month and the 10-month rAAV2/8.eGFP groups (P < 0.01) and between the 10-month rAAV2/8.eGFP and 10-month rAAV2/8.mEpoR76E groups (P < 0.05). There was no statistically significant difference between the 10-month-old rAAV2/8.mEpoR76E and the 3-month-old controls.
Figure 7.
Treatment of DBA/2J mice with rAAV2/8.mEpoR76E at 5 months preserves RGC axon transport at 10 months. (a–c) Representative heat maps of CTB fluorescence in the SC at (a) 3 months (n = 9) or at 10 months in mice treated with (b) rAAV2/8.eGFP (n = 21) or (c) rAAV2/8.mEpoR76E (n = 19). (d) Scatter plot of percent intact transport in 3-month-old mice and 10-month-old mice treated with rAAV2/8.eGFP or rAAV2/8.mEpoR76E. Note the subset of SC with no evident axon transport in the rAAV2/8.eGFP group, but not in the rAAV2/8.mEpoR76E group. CTB, cholera toxin b; rAAV, recombinant adeno-associated virus; SC, superior colliculus.
Post-IOP treatment with rAAV2/8.mEpoR76E preserved structure of the optic nerve in the DBA/2J model
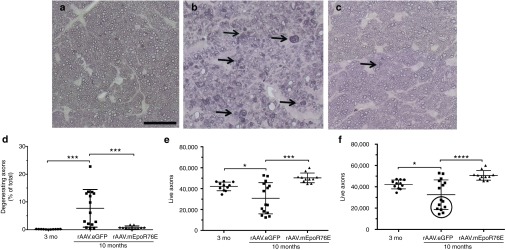
The optic nerves from 10-month-old mice treated with rAAV2/8.mEpoR76E looked comparable to those from 3-month-old control mice (Figure 8a,c). In contrast, the optic nerves from 10-month-old mice treated with rAAV2/8.eGFP contained many degenerating axons (Figure 8b). Degenerative axons were identified by dark axoplasm and/or multilayering of myelin (Figure 8b,c, arrows). The number of degenerating, live, and total axons was quantified in each group using a masked, manual, standardized procedure. The percent of degenerating axons in 3-month-old controls, 10-month-old rAAV2/8.eGFP-, and rAAV2/8.mEpoR76E-treated mice was 0.2 ± 0.1%, 7.7 ± 6.8%, and 0.8 ± 0.5%, respectively (Figure 8d). The number of live axons in 3-month-old controls, 10-month-old rAAV2/8.eGFP-, and rAAV2/8.mEpoR76E-treated mice was 42,129 ± 4,124, 30,836 ± 14,923, and 50,293 ± 4,621, respectively (Figure 8e). The total number of axons in 3-month-old controls, 10-month-old rAAV2/8.eGFP-, and rAAV.mEpoR76E-treated mice was 42,195 ± 4,138, 32,551 ± 13,945, and 50,676 ± 4,430, respectively (Figure 8f). There was a statistically significant change between the 3-month and 10-month rAAV2/8.eGFP group in each case (P < 0.05). There was also a statistically significant difference between the 10-month rAAV2/8.eGFP and 10-month rAAV2/8.mEpoR76E mice in each case (P < 0.001). There was no difference between the 3-month-old controls and the 10-month rAAV2/8.mEpoR76E optic nerves in any of the quantitative measures.
Figure 8.
Treatment of DBA/2J mice with rAAV2/8.mEpoR76E at 5 months preserves RGC axon histology at 10 months. (a–c) Representative bright field micrographs of optic nerves from (a) 3-month-old mice (n = 11) or from 10-month-old mice treated with (b) rAAV2/8.eGFP (n = 15) or (c) rAAV2/8.mEpoR76E (n = 11). Degenerative axons are indicated by arrows. Bar = 25 µm. (d–f) Scatter plots of quantification of (d) percent degenerating axons, (e) live axons, and (f) total axons, circle indicates cohort of highly degenerated optic nerves that were not present in the other groups. rAAV, recombinant adeno-associated virus
Post-IOP treatment with rAAV2/8.mEpoR76E preserves functional vision in the DBA2/J model
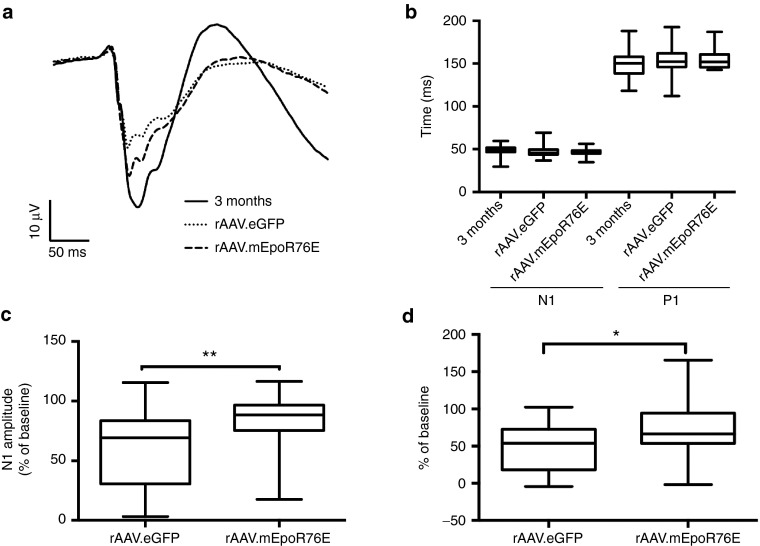
Averaged waveforms showed a decrease in the fVEP in 10-month-old mice treated with rAAV2/8.eGFP that is somewhat attenuated in animals that received rAAV2/8.mEpoR76E (Figure 9a). Similar to our previous study, there was no difference in the N1 or P1 latency at 10 months as compared to 3 months regardless of treatment (Figure 9b). In contrast, there were differences in the N1 and P1 amplitudes (Figure 9c,d). The average N1 amplitude in the 3-month-old mice was 39 ± 7.9 µV (Figure 9c). This was decreased to 24 ± 12 µV in the 10-month-old rAAV2/8.eGFP group. The N1 amplitude in the 10-month-old rAAV2/8.mEpoR76E group was 33 ± 8.9 µV. The percent of baseline was 60 ± 32% and 84 ± 22% in the rAAV2/8.eGFP and rAAV2/8.mEpoR76E groups, respectively (P < 0.01). The average 3-month P1 amplitude was 49 ± 9.6 µV (Figure 9d). This decreased to 24 ± 15 µV and 35 ± 18 µV in the 10-month-old rAAV2/8.eGFP and rAAV2/8.mEpoR76E groups, respectively. The percent baselines were 48 ± 31% and 70 ± 36% for the rAAV2/8.eGFP and rAAV2/8.mEpoR76E groups, respectively. The difference between the two groups was statistically significant (P < 0.05). For both the N1 and P1 amplitude, there was also a statistically significant difference in variance between the groups (P < 0.05). This is likely due to the known variability in the development of glaucoma symptoms by the DBA/2J.19
Figure 9.
Treatment of DBA/2J mice with rAAV2/8.mEpoR76E at 5 months partially preserves the fVEP at 10 months. (a) Overlay of averaged fVEP waveforms from 3-month-old mice (n = 40) and 10-month-old mice treated with rAAV2/8.eGFP (n = 24) or rAAV2/8.mEpoR76E (n = 24). (b) Box plot of average N1 and P1 latencies from all groups. (c,d) Box plots of the (c) N1 and (d) P1 amplitudes in the two 10-month groups presented as percent baseline (3 month). Only two (8%) points are below 50% of N1 baseline in the rAAV2/8.mEpoR76E group as compared to 10 (42%) in the rAAV2/8.eGFP group. fVEP, flash visual evoked potential; rAAV, recombinant adeno-associated virus.
Discussion
The course of neurodegeneration in glaucoma begins with deficits in active axon transport followed by degeneration of the axons in the optic nerve and finally death of the RGCs.18 In this study, we evaluated the therapeutic potential of EPO-R76E in two models of glaucoma exhibiting very different time courses and severity of disease progression. This allowed for greater insight into the effectiveness of this treatment strategy in this complex clinical disease. The successful treatment of two models of glaucoma is also insightful in terms of mechanism.
For example, while neuroinflammatory processes have been shown to affect RGC survival following elevated pressure in vitro, the relevance to the disease process in the microbead occlusion model and in glaucoma overall is not yet clear.29 The role of neuroinflammation in the pathogenesis of glaucoma appears to depend on the animal model used, thus underscoring the need to test potential therapies in multiple models. This is illustrated in the ability to completely block neurodegeneration in the DBA/2J model by ameliorating a peripheral immune response, while this same approach had no effect on a laser photocoagulation model of ocular hypertension.30,31
EPO can decrease neuroinflammation and protect neurons by limiting cell death (for review, see ref. 5). However, this does not seem to be the relevant mechanism in this study since we detected protection in the microbead occlusion model despite a lack of RGC death at the early time point analyzed. EPO can also act on neuroinflammatory processes by blocking infiltration or proliferation of microglial cells, or macroglial hypertrophy (for review, see ref. 5). Finally, EPO can protect by decreasing oxidative stress, and a role for oxidative stress in glaucoma pathogenesis has been reported.32,33,34,35 EPO activates Nrf2, which induces transcription of antioxidant enzymes from the antioxidant response element (for review, see ref. 5). Future studies will investigate which activity of EPO is most relevant to its neuroprotective action in glaucoma.
In the microbead occlusion model, deficits in axon transport are first evident after 2–4 weeks of elevated pressure.17 In addition to the transport deficits, we also detected a small number of degenerating axons without a change in the overall number of axons, again suggesting that 4 weeks after microbead injection represents a very early stage in glaucoma. As predicted by these results, we detected no statistically significant deficit in the fVEP, since there is tremendous redundancy at the level of the RGCs such that many cells must be lost prior to the detection of a visual deficit.36 As would be predicted based on the above findings, our greatest evidence of neuroprotection by rAAV.EpoR76E was from the axon transport measurements, followed by quantification of degenerating axons in the optic nerve. Despite the mild effects on the fVEP, we still detected a trend toward preservation of the fVEP in mice that received rAAV.EpoR76E. Importantly, similar to the animal models, changes in the optic disc and elevated IOP are often detected in patients prior to the development of visual field deficits.37 These patients are given IOP-lowering treatments prior to vision loss, without detriment, and our results suggest that this timing would also be safe for EpoR76E gene therapy. Future studies will determine if extending the study out to 8 weeks of elevated pressure will result in a statistically significant loss in vision that can be prevented by treatment with rAAV.EpoR76E.
In the DBA/2J, we assessed therapeutic efficacy at 10 months of age, a late time point in the course of disease in this model. At this age, the optic nerve is severely degenerated, and many RGCs have been lost.19 We previously treated DBA/2J mice at 1 month of age with rAAV.EpoR76E and detected complete protection of the RGC axons, cell bodies, and vision (fVEP) at 10 months.7 In the current study, the level of protection was lower suggesting that disease processes had already started and could not be completely stopped by EPO-R76E. It is unclear from this study whether treatment with rAAV.EpoR76E blocked the onset of degenerative pathways in neurons adjacent to degenerative neurons or slowed the rate of degeneration in all neurons. If the latter is true, then it suggests that despite the pleiotropic nature of EPO, it does not act on all degenerative processes that are initiated by a rise in IOP. Finally, it is possible that the decreased efficacy of rAAV.EpoR76E when delivered at 5 months as opposed to 1 month in the DBA/2J may be due, in part, to degenerative processes occurring in these mice independent of glaucoma. For example, microglia numbers and reactivity are elevated in the retina 3 months before elevation of IOP in this model.38 Also, these mice undergo photoreceptor degeneration, which is likely to be unrelated to the development of glaucoma since deficits are detectable prior to elevation of IOP.39 Future longer-term studies in the microbead occlusion model will help to answer some of these questions.
This study provides evidence that delivery of rAAV.EpoR76E, with clinically relevant timing (at onset of elevated IOP), limits the amount of degeneration and vision loss in two well-recognized models of glaucoma.40 This treatment paradigm is advantageous because long-term therapy is provided from a single injection without a dangerous rise in hematocrit, making it safer and more clinically viable.7,8,9
Materials and Methods
Viral vector production. Mutation R76E was created in rhesus macaque Epo gene (mEpoR76E) and human Epo gene (hEpoR76E) via site-directed mutagenesis and cloned into an AAV2 genome plasmid under the control of the CMV promoter. Both vectors were packaged and purified by the University of Pennsylvania Vector Core (Philadelphia, PA). Capsid protein plasmid from AAV serotype 8 was used with mEpoR76E to create hybrid serotype rAAV2/8.CMV.rEpoR76E (used for pre-IOP treatment in the microbead occlusion model, and for all DBA/2J studies), and capsid protein plasmid from AAV serotype 1 was used with hEpoR76E to create hybrid serotype rAAV2/1.CMV.hEpoR76E (used for post-IOP treatment in the microbead occlusion model). The titers were 1.38 × 10¹³ gc/ml for rAAV2/8.CMV.mEpoR76E and 2.06 × 10¹³ gc/ml for rAAV2/1.CMV.hEpoR76E. Stock rAAV2/8.CMV.eGFP vector was purchased from the University of Pennsylvania Vector Core.
Mice. All animal experiments were conducted in compliance with the ARVO Statement for the Use of Animals in Ophthalmic and Vision Research. This study was carried out under an animal protocol approved by the Vanderbilt University Medical Center Institutional Animal Care and Use Committee. DBA/2J and C57BL/6J mice were obtained from Jackson Laboratories (Bar Harbor, ME). For the microbead occlusion model, only male mice ~3–4 months of age were utilized for microbead injection to control for age- and gender-dependent variability. Mice were bred in-house, maintained on a diurnal light cycle, and provided food and water ad libitum.
rAAV injections. C57BL/6J mice received a single 10 µl injection of 1 × 10⁹ gc of vector in the right quadriceps. For treatment beginning prior to onset of elevated IOP (i.e., Pre-IOP), mice received rAAV2/8.CMV.mEpoR76E or rAAV2/8.CMV.eGFP 1 month before microbead injection since it takes ~3 weeks to reach peak gene expression from this serotype.24 For treatment beginning at onset of elevated IOP (i.e., post-IOP), mice received rAAV2/1.CMV.eGFP or rAAV2/1.CMV.hEpoR76E immediately after microbead injection to result in peak transgene expression 1 week later.24 All mice were collected 1-month post-microbead injection, i.e., pretreatment mice were collected 2 months post-rAAV injection, while post-elevated IOP treatment mice were collected 1-month post-rAAV injection.
DBA/2J mice received a single 10 µl injection of 1 × 10⁹ gc of rAAV2/8.CMV.mEpoR76E or rAAV2/8.CMV.eGFP as a control to the right quadriceps at 5 months of age to result in peak gene expression 3 weeks later.41 Mice were euthanized at 10 months of age.
Microbead occlusion model. Induction of IOP elevation was induced bilaterally via injection of 15-µm diameter FluoSpheres polystyrene microbeads (Thermo Fisher, Waltham, MA) into the anterior chamber as described previously for mice.13,14 Briefly, 1.5 mm outer diameter/1.12 mm inner diameter filamented capillary tubes (World Precision Instruments, Sarasota, FL) were pulled using a P-97 horizontal puller (Sutter Instrument Company, Novato, CA), and the resulting needles were broken using forceps to an inner diameter of ~100 µm. Microbeads (or lactated Ringer's saline solution as a control) were loaded and injected using a microinjection pump (World Precision Instruments, Sarasota, FL). Mice were anesthetized with isoflurane and dilated using topical 1% tropicamide ophthalmic solution (Patterson Veterinary, Devens, MA), and 2 µl (~2,000 microbeads) were injected. The needle was maintained in the injection site for 20 seconds before retraction to reduce microbead efflux. Mice were given topical 0.3% tobramycin ophthalmic solution (Patterson Veterinary, Devens, MA) following injection.
IOP measurement. IOP was measured using the Icare TonoLab rebound tonometer (Colonial Medical Supply, Franconia, NH). Mice were anesthetized using isoflurane, and 10 measurements were acquired from each eye within 2 minutes of induction of anesthesia. IOP was measured in mice immediately prior to microbead injection and weekly following microbead injection. In the DBA/2J, IOP was measured at 3 months (n = 26, rAAV2/8.eGFP; n = 52 rAAV2/8.mEpoR76E) and then twice a month from 5–8 months (n = 42–52). If no elevation in IOP was detected by 8 months, the eye was excluded from study.
Tissue collection, hematocrit, and serum EPO quantification. Blood was collected by cardiac puncture prior to perfusion. Hematocrit was determined my capillary tube centrifugation using the CritSpin system (Beckman Coulter, Brea, CA). EPO concentration was measured by sandwich ELISA using Quantikine Human EPO ELISA kit (R&D Systems, Minneapolis, MN) according to manufacturer directions. Animals were then perfused with 4% paraformaldehyde, and eyes, optic nerves, and brains were collected and placed in 4% paraformaldehyde.
Retinal ganglion cell anterograde transport tracing. Mice were anesthetized with isoflurane and injected intravitreally with 2 µl CTB conjugated to Alexa Fluor 594 (Thermo Fisher, Waltham, MA) using a 30 gauge Hamilton syringe. Approximately 3 days following injection, mice were anesthetized via intraperitoneal injection of 2,2,2-tribromoethanol (Sigma-Aldrich, Saint Louis, MO) and perfused with 4% paraformaldehyde in phosphate-buffered saline. Brains were postfixed in 4% paraformaldehyde in phosphate-buffered saline, infiltrated with 30% sucrose, and cryosectioned coronally at 50 µm. Sections traversing the SC were mounted, and the SC was imaged via epifluorescence microscopy (Nikon Instruments, Melville, NY). Fluorescence in the SC sections was quantified using ImagePro software (Media Cybernetics, Rockville, MD) using an automated macro described earlier to quantify the fraction of the SC retinotopic representation containing intact anterograde transport.17,21,22 Briefly, fluorescence intensity was summed along the vertical dorsal–ventral columns through the SC sections, and a normalized fluorescence intensity score was generated along the medial–lateral length of the SC. A fluorescence intensity heat map was generated by combining all sections traversing the SC. This resulted in a complete retinotopic map, with red representing maximum fluorescence and blue representing no fluorescence. Intact transport is defined as >70% of maximum fluorescence.
Optic nerve histology. Sections of the myelinated optic nerve ~1 mm behind the globe were postfixed in 1% glutaraldehyde and 4% paraformaldehyde in phosphate-buffered saline for at least 24 hours. Nerves were further postfixed in 2% osmium tetroxide for 1 hour and embedded in low viscosity Spurr's embedding media (Electron Microscopy Sciences, Hatfield, PA). Semi-thin 700-nm sections were cut and stained with 1% p-phenylenediamine. Sections were imaged using bright field microscopy with a 100× oil-immersion objective (Nikon Instruments, Melville, NY). Axons were manually counted using ImageJ software by sampling 20% of the total nerve cross-sectional area using a fixed grid overlay to estimate axon density in the nerve (axons/mm2). Total number of surviving axons was estimated as the product of mean axon density and nerve cross-sectional area, as described previously.25
Flash visually evoked potential. Mice were dark-adapted overnight. Mice were anesthetized by intraperitoneal injection of 25/8/600 µg/g body weight of ketamine, xylazine, and urethane, and eyes were dilated with 1% tropicamide. After placement in a heated Ganzfeld dome (Diagnosys, Lowell, MA), platinum electrodes (Grass Technologies, West Warwick, RI) were placed subdermally above the visual cortex 3 mm lateral from the midline, and a reference electrode was placed subdermally in the snout. Mice were presented with white light flashes 1.0 cd-s/m2 at a frequency of 1 Hz and an inter-sweep delay of 500 ms. Resulting waveform and amplitudes were the average of 200 sweeps. Negative area under the curve of the VEP waveform was quantified between 0 and 175 ms (the average P1 latency).
Statistical analysis. All results are represented as average ± SD unless otherwise indicated. For IOP measurement data, two-way analysis of variance was used. For the microbead occlusion model studies, one-way analysis of variance was used, employing the Dunnett post-hoc test for pairwise comparison. Comparisons were only made between the rAAV.eGFP and rAAV.EpoR76E groups, not between treatment groups. For the DBA/2J model studies, one-way analysis of variance was used, employing the Tukey post hoc test. Variances were calculated using the Brown–Forsythe test. Significance was assumed at P < 0.05. In all figures, the following indicators of statistical significance are used: *P < 0.05; **P < 0.01; ***P < 0.001.
Acknowledgments
This research was funded by NIH grants R01 EY022349 (T.S.R.), T32 EY021453-04 (W.S.B.), and P30 EY008126 (D.J.C.), Department of Defense grant W81XW-10-1-0528, the Glaucoma Research Foundation (D.J.C.), Research to Prevent Blindness Unrestricted Funds (Paul Sternberg, Jr.), and Fight for Sight Summer Research Fellowship (Y.L.G.). The authors thank Lorraine Kasmala for assistance in axon quantification.
T.S.R. is co-inventor in a pending US patent application (13/979,451) and international patent application (PCT/2012/021247) regarding neuroprotective use of EPO-R76E. No other authors have conflicts of interest to disclose.
References
- Schwartz, K and Budenz, D (2004). Current management of glaucoma. Curr Opin Ophthalmol 15: 119–126. [DOI] [PubMed] [Google Scholar]
- Olthoff, CM, Schouten, JS, van de Borne, BW and Webers, CA (2005). Noncompliance with ocular hypotensive treatment in patients with glaucoma or ocular hypertension an evidence-based review. Ophthalmology 112: 953–961. [DOI] [PubMed] [Google Scholar]
- Broxmeyer, HE (2013). Erythropoietin: multiple targets, actions, and modifying influences for biological and clinical consideration. J Exp Med 210: 205–208. [DOI] [PMC free article] [PubMed] [Google Scholar]
- Noguchi, CT, Asavaritikrai, P, Teng, R and Jia, Y (2007). Role of erythropoietin in the brain. Crit Rev Oncol Hematol 64: 159–171. [DOI] [PMC free article] [PubMed] [Google Scholar]
- Bond, WS and Rex, TS (2014). Evidence that erythropoietin modulates neuroinflammation through differential action on neurons, astrocytes, and microglia. Front Immunol 5: 523. [DOI] [PMC free article] [PubMed] [Google Scholar]
- Salmonson, T, Danielson, BG and Wikström, B (1990). The pharmacokinetics of recombinant human erythropoietin after intravenous and subcutaneous administration to healthy subjects. Br J Clin Pharmacol 29: 709–713. [DOI] [PMC free article] [PubMed] [Google Scholar]
- Sullivan, TA, Geisert, EE, Hines-Beard, J and Rex, TS (2011). Systemic adeno-associated virus-mediated gene therapy preserves retinal ganglion cells and visual function in DBA/2J glaucomatous mice. Hum Gene Ther 22: 1191–1200. [DOI] [PMC free article] [PubMed] [Google Scholar]
- Sullivan, T, Kodali, K and Rex, TS (2011). Systemic gene delivery protects the photoreceptors in the retinal degeneration slow mouse. Neurochem Res 36: 613–618. [DOI] [PubMed] [Google Scholar]
- Sullivan, TA, Geisert, EE, Templeton, JP and Rex, TS (2012). Dose-dependent treatment of optic nerve crush by exogenous systemic mutant erythropoietin. Exp Eye Res 96: 36–41. [DOI] [PMC free article] [PubMed] [Google Scholar]
- Rex, TS, Allocca, M, Domenici, L, Surace, EM, Maguire, AM, Lyubarsky, A et al. (2004). Systemic but not intraocular Epo gene transfer protects the retina from light-and genetic-induced degeneration. Mol Ther 10: 855–861. [DOI] [PubMed] [Google Scholar]
- Dhanushkodi, A, Akano, EO, Roguski, EE, Xue, Y, Rao, SK, Matta, SG et al. (2013). A single intramuscular injection of rAAV-mediated mutant erythropoietin protects against MPTP-induced parkinsonism. Genes Brain Behav 12: 224–233. [DOI] [PMC free article] [PubMed] [Google Scholar]
- Hines-Beard, J, Desai, S, Haag, R, Esumi, N, D'Surney, L, Parker, S et al. (2013). Identification of a therapeutic dose of continuously delivered erythropoietin in the eye using an inducible promoter system. Curr Gene Ther 13: 275–281. [DOI] [PMC free article] [PubMed] [Google Scholar]
- Sappington, RM, Carlson, BJ, Crish, SD and Calkins, DJ (2010). The microbead occlusion model: a paradigm for induced ocular hypertension in rats and mice. Invest Ophthalmol Vis Sci 51: 207–216. [DOI] [PMC free article] [PubMed] [Google Scholar]
- Ward, NJ, Ho, KW, Lambert, WS, Weitlauf, C and Calkins, DJ (2014). Absence of transient receptor potential vanilloid-1 accelerates stress-induced axonopathy in the optic projection. J Neurosci 34: 3161–3170. [DOI] [PMC free article] [PubMed] [Google Scholar]
- Mo, JS, Anderson, MG, Gregory, M, Smith, RS, Savinova, OV, Serreze, DV et al. (2003). By altering ocular immune privilege, bone marrow-derived cells pathogenically contribute to DBA/2J pigmentary glaucoma. J Exp Med 197: 1335–1344. [DOI] [PMC free article] [PubMed] [Google Scholar]
- Buckingham, BP, Inman, DM, Lambert, W, Oglesby, E, Calkins, DJ, Steele, MR et al. (2008). Progressive ganglion cell degeneration precedes neuronal loss in a mouse model of glaucoma. J Neurosci 28: 2735–2744. [DOI] [PMC free article] [PubMed] [Google Scholar]
- Crish, SD, Sappington, RM, Inman, DM, Horner, PJ and Calkins, DJ (2010). Distal axonopathy with structural persistence in glaucomatous neurodegeneration. Proc Natl Acad Sci USA 107: 5196–5201. [DOI] [PMC free article] [PubMed] [Google Scholar]
- Calkins, DJ (2012). Critical pathogenic events underlying progression of neurodegeneration in glaucoma. Prog Retin Eye Res 31: 702–719. [DOI] [PMC free article] [PubMed] [Google Scholar]
- John, SW, Smith, RS, Savinova, OV, Hawes, NL, Chang, B, Turnbull, D et al. (1998). Essential iris atrophy, pigment dispersion, and glaucoma in DBA/2J mice. Invest Ophthalmol Vis Sci 39: 951–962. [PubMed] [Google Scholar]
- Havenaar, R, Meijer, JC, Morton, DB, Ritskes-Hoitinga, J and Zwart, P (2001). Biology and husbandry of laboratory animals. In: Van Zutphen LFM, Baumans V, Baynen AC (eds). Principles of Laboratory Animal Science, revised edn. Elsevier Science: Amsterdam. pp. 19–28. [Google Scholar]
- Crish, SD, Dapper, JD, MacNamee, SE, Balaram, P, Sidorova, TN, Lambert, WS et al. (2013). Failure of axonal transport induces a spatially coincident increase in astrocyte BDNF prior to synapse loss in a central target. Neuroscience 229: 55–70. [DOI] [PMC free article] [PubMed] [Google Scholar]
- Dapper, JD, Crish, SD, Pang, IH and Calkins, DJ (2013). Proximal inhibition of p38 MAPK stress signaling prevents distal axonopathy. Neurobiol Dis 59: 26–37. [DOI] [PMC free article] [PubMed] [Google Scholar]
- Lambert, WS, Ruiz, L, Crish, SD, Wheeler, LA and Calkins, DJ (2011). Brimonidine prevents axonal and somatic degeneration of retinal ganglion cell neurons. Mol Neurodegener 6: 4. [DOI] [PMC free article] [PubMed] [Google Scholar]
- Zincarelli, C, Soltys, S, Rengo, G and Rabinowitz, JE (2008). Analysis of AAV serotypes 1-9 mediated gene expression and tropism in mice after systemic injection. Mol Ther 16: 1073–1080. [DOI] [PubMed] [Google Scholar]
- Inman, DM, Sappington, RM, Horner, PJ and Calkins, DJ (2006). Quantitative correlation of optic nerve pathology with ocular pressure and corneal thickness in the DBA/2 mouse model of glaucoma. Invest Ophthalmol Vis Sci 47: 986–996. [DOI] [PubMed] [Google Scholar]
- Chou, TH, Kocaoglu, OP, Borja, D, Ruggeri, M, Uhlhorn, SR, Manns, F et al. (2011). Postnatal elongation of eye size in DBA/2J mice compared with C57BL/6J mice: in vivo analysis with whole-eye OCT. Invest Ophthalmol Vis Sci 52: 3604–3612. [DOI] [PMC free article] [PubMed] [Google Scholar]
- Anderson, MG, Libby, RT, Gould, DB, Smith, RS and John, SW (2005). High-dose radiation with bone marrow transfer prevents neurodegeneration in an inherited glaucoma. Proc Natl Acad Sci USA 102: 4566–4571. [DOI] [PMC free article] [PubMed] [Google Scholar]
- Schlamp, CL, Li, Y, Dietz, JA, Janssen, KT and Nickells, RW (2006). Progressive ganglion cell loss and optic nerve degeneration in DBA/2J mice is variable and asymmetric. BMC Neurosci 7: 66. [DOI] [PMC free article] [PubMed] [Google Scholar]
- Sappington, RM, Chan, M and Calkins, DJ (2006). Interleukin-6 protects retinal ganglion cells from pressure-induced death. Invest Ophthalmol Vis Sci 47: 2932–2942. [DOI] [PubMed] [Google Scholar]
- Howell, GR, Soto, I, Zhu, X, Ryan, M, Macalinao, DG, Sousa, GL et al. (2012). Radiation treatment inhibits monocyte entry into the optic nerve head and prevents neuronal damage in a mouse model of glaucoma. J Clin Invest 122: 1246–1261. [DOI] [PMC free article] [PubMed] [Google Scholar]
- Johnson, EC, Cepurna, WO, Choi, D, Choe, TE and Morrison, JC (2015). Radiation pretreatment does not protect the rat optic nerve from elevated intraocular pressure-induced injury. Invest Ophthalmol Vis Sci 56: 412–419. [DOI] [PMC free article] [PubMed] [Google Scholar]
- Chrysostomou, V, Rezania, F, Trounce, IA and Crowston, JG (2013). Oxidative stress and mitochondrial dysfunction in glaucoma. Curr Opin Pharmacol 13: 12–15. [DOI] [PubMed] [Google Scholar]
- Tezel, G, Yang, X, Luo, C, Kain, AD, Powell, DW, Kuehn, MH et al. (2010). Oxidative stress and the regulation of complement activation in human glaucoma. Invest Ophthalmol Vis Sci 51: 5071–5082. [DOI] [PMC free article] [PubMed] [Google Scholar]
- Zanon-Moreno, V, Marco-Ventura, P, Lleo-Perez, A, Pons-Vazquez, S, Garcia-Medina, JJ, Vinuesa-Silva, I et al. (2008). Oxidative stress in primary open-angle glaucoma. J Glaucoma 17: 263–268. [DOI] [PubMed] [Google Scholar]
- Ghanem, AA, Arafa, LF and El-Baz, A (2010). Oxidative stress markers in patients with primary open-angle glaucoma. Curr Eye Res 35: 295–301. [DOI] [PubMed] [Google Scholar]
- Harwerth, RS, Carter-Dawson, L, Shen, F, Smith, EL 3rd and Crawford, ML (1999). Ganglion cell losses underlying visual field defects from experimental glaucoma. Invest Ophthalmol Vis Sci 40: 2242–2250. [PubMed] [Google Scholar]
- Coleman, AL and Miglior, S (2008). Risk factors for glaucoma onset and progression. Surv Ophthalmol 53 (suppl. 1): S3–10. [DOI] [PubMed] [Google Scholar]
- Bosco, A, Steele, MR and Vetter, ML (2011). Early microglia activation in a mouse model of chronic glaucoma. J Comp Neurol 519: 599–620. [DOI] [PMC free article] [PubMed] [Google Scholar]
- Fernández-Sánchez, L, de Sevilla Müller, LP, Brecha, NC and Cuenca, N (2014). Loss of outer retinal neurons and circuitry alterations in the DBA/2J mouse. Invest Ophthalmol Vis Sci 55: 6059–6072. [DOI] [PMC free article] [PubMed] [Google Scholar]
- de Lucas Cerrillo, AM, Bond, WS and Rex, TS (2015). Safety and angiogenic effects of systemic gene delivery of a modified erythropoietin. Gene Ther 22: 365–373. [DOI] [PMC free article] [PubMed] [Google Scholar]
- Louboutin, JP, Wang, L and Wilson, JM (2005). Gene transfer into skeletal muscle using novel AAV serotypes. J Gene Med 7: 442–451. [DOI] [PubMed] [Google Scholar]


