

Abstract
Key points
We propose that the end product of chromophore bleaching in rod photoreceptors, all‐trans retinol, is part of a feedback loop that increases the sensitivity of the phototransduction cascade in rods.
A previously described light‐induced hypersensitivity in rods, termed adaptive potentiation, is reduced by exogenously applied all‐trans retinol but not all‐trans retinal.
This potentiation is produced by insulin‐like growth factor‐1, whose binding proteins are located in the extracellular matrix, even in our isolated retina preparation after removal of the retinal pigmented epithelium.
Simple modelling suggests that the light stimuli used in the present study will produce sufficient all‐trans retinol within the interphotoreceptor matrix to explain the potentiation effect.
Abstract
Photoreceptors translate the absorption of photons into electrical signals for propagation through the visual system. Mammalian photoreceptor signalling has largely been studied in isolated cells, and such studies have necessarily avoided the complex environment of supportive proteins that surround the photoreceptors. The interphotoreceptor matrix (IPM) contains an array of proteins that aid in both structural maintenance and cellular homeostasis, including chromophore turnover. In signalling photon absorption, the chromophore 11‐cis retinal is first isomerized to all‐trans retinal, followed by conversion to all‐trans retinol (ROL) for removal from the photoreceptor. Interphotoreceptor retinoid‐binding protein (IRBP) is the most abundant protein in the IPM, and it promotes the removal of bleached chromophores and recycling in the nearby retinal pigment epithelium. By studying the light responses of isolated mouse retinas, we demonstrate that ROL can act as a feedback signal onto photoreceptors that influences the sensitivity of phototransduction. In addition to IRBP, the IPM also contains insulin‐like growth factor‐1 (IGF‐1) and its associated binding proteins, although their functions have not yet been described. We demonstrate that extracellular application of physiological concentrations of IGF‐1 can increase rod photoreceptor sensitivity in mammalian retinas. We also determine that chromophores and growth factors can limit the range of a newly described form of photoreceptor light adaptation. Finally, fluorescent antibodies demonstrate the presence of IRBP and IGFBP‐3 in isolated retinas. A simple model of the formation and release of ROL into the extracellular space quantitatively describes this novel feedback loop.
Key points
We propose that the end product of chromophore bleaching in rod photoreceptors, all‐trans retinol, is part of a feedback loop that increases the sensitivity of the phototransduction cascade in rods.
A previously described light‐induced hypersensitivity in rods, termed adaptive potentiation, is reduced by exogenously applied all‐trans retinol but not all‐trans retinal.
This potentiation is produced by insulin‐like growth factor‐1, whose binding proteins are located in the extracellular matrix, even in our isolated retina preparation after removal of the retinal pigmented epithelium.
Simple modelling suggests that the light stimuli used in the present study will produce sufficient all‐trans retinol within the interphotoreceptor matrix to explain the potentiation effect.
Abbreviations
- AP
adaptive potentiation
- AP‐4
(±)‐2‐amino‐4‐phosphonobutyric acid
- CNG
cyclic nucleotide gated
- DAPI
4′,6‐diamidino‐2‐phenylindole
- ERG
electroretinography
- FGF
fibroblast growth factor
- IGF‐1
insulin‐like growth factor‐1
- IGFBP
insulin‐like growth factor binding protein
- IGF‐1R
insulin‐like growth factor‐1 receptor
- IPM
interphotoreceptor matrix
- IR
insulin receptor
- IRBP
interphotoreceptor retinoid‐binding protein
- RAL
all‐trans retinal
- ROL
all‐trans retinol
- ROS
rod outer segment
- RPE
retinal pigmented epithelium
Introduction
Rod photoreceptors are well suited for encoding a range of light levels, and their working range is determined primarily by the light driven adaptations that occur within the photoreceptor outer and inner segments (Arshavsky & Burns, 2012). In general, photoreceptor sensitivity decreases as photon absorption rates increase. Recently, a new form of adaptation was identified where rods exhibit a light‐dependent hypersensitivity following periods of saturating illumination (McKeown & Kraft, 2014; McKeown et al. 2015). The increase in sensitivity, named adaptive potentiation (AP), was quantified as an increase in the magnitude of the circulating dark current flowing between the photoreceptor outer and inner segments in darkness (Hagins et al. 1970). The magnitude of the increase in photocurrent depended on the duration of the conditioning light, and the maximum adaptive effect was observed with 3 min exposures. The signalling of AP appears to be a result of the activity of the insulin‐like growth factor‐1 receptor (IGF‐1R) acting to dephosphorylate the cyclic nucleotide (CNG) channels, thereby increasing their sensitivity for their ligand cGMP (Savchenko et al. 2001; McKeown & Kraft, 2014). The results reported in the present study link AP directly with photon capture and changes in CNG sensitivity, and we introduce an extracellular signalling pathway that involves the release of retinal chromophore.
IGF‐1 and insulin are located in the interphotoreceptor matrix (IPM), and their receptors are expressed in both retinal pigment epithelium (RPE) and rod photoreceptors (Waldbillig et al. 1987; Zick et al. 1987; Waldbillig et al. 1991). The primary role of insulin receptor (IR) signalling has been attributed to photoreceptor survival (Rajala et al. 2008) because IR activation can reduce photoreceptor sensitivity through a complex pathway involving phosphoinositide 3‐kinase, growth factor receptor‐bound protein 14 and protein‐tyrosine phosphatase 1B (Rajala et al. 2009; Rajala et al. 2010; Gupta et al. 2012). Activation of the IR pathway requires chromophore bleaching but does not require activation of transducin, which emphasizes the importance of chromophore conversion as the primary signalling step (Rajala et al. 2007). Although the IR can directly phosphorylate the CNG channels, the IGF‐1R appears to stimulate a pathway that dephosphorylates the channel. IGF‐1 is present in the IPM at concentrations of ∼20 pM (Waldbillig et al. 1991), and application of exogenous IGF‐1 at a concentration of 1 μm increased sensitivity and response amplitudes in single rods, probably through modulation of the CNG channel phosphorylation state (Savchenko et al. 2001). The IGF‐1 receptor also appears to be activated by light because IGF‐1R inhibition eliminated the AP form of light adaptation in mouse rods (McKeown & Kraft, 2014). The work reported in the present study investigates the mechanism of light‐dependent IGF‐1 activation.
After light exposure, the visual pigment rhodopsin releases all‐trans retinal (RAL) that is converted to all trans‐retinol (ROL), which must leave the photoreceptor outer segment to be re‐isomerized to 11‐cis retinal by the adjacent RPE. The retinoid cycle is essential for dark‐ and light‐adaptation, as well as for cell viability, because deficits in retinoid turnover often lead to blindness and degeneration. In the present study, we investigate the signalling pathways of RAL and ROL, and the effects they have on rod photoreceptor light responses and AP magnitude. We observed that application of nanomolar levels of ROL can increase light sensitivity in isolated retinas, whereas higher levels of ROL and RAL significantly reduce light sensitivity and interfere with AP.
Finally, we model retinoid processing and release from the rod outer segment (ROS). In amphibian rods, after intense bleaching, ROL is cleared from the outer segment with a time course of tens of minutes. This process can be accelerated by lipophilic entities, such as interphotoreceptor retinoid‐binding protein (IRBP) and serum albumin (Tsina et al. 2004; Wu et al. 2007). IRBP is the most abundant protein in the IPM, and it is the primary carrier of retinol from the rods to the RPE (Adler & Martin, 1982; Bunt‐Milam & Saari, 1983). Mouse models lacking IRBP do not appear to be deficient in visual cycling of chromophore, although they do experience retinal degeneration over time (Palczewski et al. 1999). Mice with the Stra6 gene knocked out have severe retinal degeneration, indicating that Stra6 (stimulated by retinoic acid 6) is an essential retinoid binding protein transmembrane receptor in the retina, and further demonstrating the importance of proper chromophore cycling for photoreceptor health. We show that the bleaching products of constant light, when released from the outer segment, can alter the sensitivity of rod photoreceptors. Thus, the chromophore that absorbs the initial photon also appears to be involved in a novel extracellular signalling feedback loop that can influence the sensitivity of rod photoreceptor cells.
Methods
Ethical approval
All mice used in these experiments were on the C57B/6J background, and were aged between 1 and 6 months old. Mice were maintained on a standard rodent diet, fed ad libitum, under the care and supervision of the trained veterinary staff at the University of Alabama at Birmingham, which operates under the purview of the National Institute of Health. All animal procedures were performed in accordance with an approved Institutional Animal Care and Use Committee protocol. The single primate used for single cell recordings was a 7.9‐year‐old Rhesus macaque that was killed for histology in another laboratory on campus. In that laboratory, initial anaesthesia was induced by i.m. ketamine, then a deep surgical plane of anaesthesia was achieved with i.v. sodium pentobarbital, given to effect until absence of all reflexes (corneal, flexor withdrawal) prior to harvesting the eyes. In total, one‐eighth of the retina from one eye was isolated into L‐15 media (Sigma‐Aldrich, St Louis, MO, USA) under dim room lighting and was stored in light‐tight containers at 4°C as the portions were used for recording over a period of 3 days. We acknowledge the ethical principles of The Journal of Physiology, and confirm that all of our animal procedures were performed within these principles.
Isolated tissue electroretinography
Tissue electroretinography (ERG) was performed as described previously (McKeown & Kraft, 2014), with slight modifications. Mice were dark‐adapted overnight prior to being killed with gradually rising CO2 (20% cage volume min–1) followed by cervical dislocation. Eyes were removed and placed into L‐15 media supplemented with 10 mm BaCl2 (Leibowitz, powder with glutamine; Sigma‐Aldrich) and dissected under infrared illumination. The Ba2+ was added to inhibit the current from inward‐rectifying K+ channels on the retinal Müller cells (Karwoski et al. 1989; Newman, 1993). A single retina was then transferred to the recording chamber where it was placed photoreceptor side up. The retina was isolated between two silver chloride pellet electrodes and mechanically stabilized by a circular piece of filter paper with a 2 mm diameter hole in the centre. The entire chamber was then sealed with a glass coverslip and transferred to a Faraday cage for recording. Retinas were perfused with a buffer solution that contained (in mm): 120 NaCl, 3.6 KCl, 2.4 MgCl2, 1.2 CaCl2, 3 Hepes, 20 NaHCO3, 0.02 EDTA and 10 glucose. The perfusion solution also contained 10 mm d/l‐aspartate and 25 μm (±)‐2‐amino‐4‐phosphonobutyric acid (AP‐4; Sigma‐Aldrich), a selective blocker of glutamic acid receptors found on the ON‐bipolar cells (mGluR6). Flow rate was set at 1.5 ml min−1. Perfusion solution was maintained between 36 and 37°C and a 95/5% mixture of O2/CO2 was bubbled into the solution to maintain pH 7.4. To prevent non‐specific binding of retinoids or growth factors, a 1% wash of BSA was flowed over all surfaces that would come into contact with the perfusion solution at the beginning of each experimental day. Stocks of ROL, RAL and 11‐cis RAL were made with 100% ethanol and stored at –20°C until used in an experiment. A small aliquot of the stock solution was then added to a volume of buffer in the experimental perfusion chamber, up to the concentrations indicated. The concentration of alcohol in solution, as in the single cell recordings, was never higher that 1%. Although retinal and retinol have limited stability and solubility in aqueous solutions (Szuts and Harosi, 1991), the concentrations of alcohol used in the present study have proven effective. Light stimuli were delivered to the retina from a fibre‐optic cable held in place above the chamber. Stimulus duration was controlled by a computer‐driven Uniblitz shutter (Vincent Associates, Rochester, NY, USA). The light source was a 100 W tungsten bulb (Xenophot HLX 64623; Osram, Munich, Germany) illuminated by a constant power source (ATE 15‐15 M; Kepco Power Supplies, Flushing, NY, USA). Stimulus intensity was controlled by calibrated neutral density filters, and the stimulus wavelength was 505nm bandpass filter (35 nm bandwidth, Andover Corp. Salem, NH, USA). Electrical responses were amplified (CP122W; Astro‐Med, West Warwick, RI, USA; DC 300 Hz) and digitized at 2 KHz (Real‐Time PXI Computer; National Instruments, Austin, TX, USA). Isolated tissue responses were low‐pass filtered post hoc at 30 Hz, 8‐pole Bessel. All data were collected using custom LabView software (National Instruments). Offline analysis and filtering were performed using IGOR software (WaveMetrics Inc., Portland, OR, USA).
Single cell recordings
Recordings from mouse and primate rods were performed as described previously (McKeown & Kraft, 2014). Mouse retinas were dissected as described in the isolated tissue experiments. For regeneration experiments, retinas were incubated for 20–25 min in L‐15 media with 11‐cis RAL added to a maximum concentration 25 μm to fully regenerate any bleached opsin. Stock solutions of 11‐cis RAL were stored in a solution of 100% ethanol, and retinas were exposed to concentrations of ethanol of less than 3%. Control retinas were exposed to an equivalent level of ethanol with no apparent effect. Following pigment regeneration, an individual mouse retina (or a small piece of primate retina) was chopped into small sections and transferred to the recording chamber. Cells were perfused with the same buffer as that used in the isolated tissue experiments. The perfusion solution was kept between 36 and 37°C, and a gas mixture of O2/CO2 was applied to the bath to maintain pH 7.4. Single cells were drawn into glass microelectrodes with inner diameters of ∼1.3 μm. Electrodes were filled with buffer solution that lacked NaHCO3 in which the Na+ content was adjusted with the addition of 20 mm NaCl. Light stimuli were delivered using a two‐channel optical system focused at the specimen plane. One channel delivered 2 ms test stimuli and the second channel delivered the 3 min adapting background. Stimulus timings from both channels were controlled as described in the isolated tissue experiments, stimulus intensity was controlled by calibrated neutral density filters and the mean ± SD stimulus wavelength was 502 nm narrow band filter (10 nm bandwidth; Andover Corp.) Photocurrents were amplified using an Axopatch A‐1 amplifier (Molecular Devices, Sunnyvale, CA, USA), low‐pass filtered (200 Hz, 8‐pole Bessel) and digitized at 1 kHz. Single cell responses were low‐pass filtered post hoc at 30 Hz, 8‐pole Bessel. Data were analysed using procedures similar to those employed in the isolated tissue experiments.
Immunohistochemistry
Animals from the same line as the mice used in the isolated tissue ERG experiments (C57B6/J) were used for immunohistochemical localization of IRBP and insulin‐like growth factor binding protein (IGFBP)‐3. Mice were dark adapted overnight and the were eyes removed into L‐15 as above. For the whole eye controls, only the cornea was removed before the eyes were fixed in 2% paraformaldehyde for 30 min. Isolated retinas were handled in the same manner as that used for the isolated tissue ERG prior to fixation in 2% paraformaldehyde for 15 min. Whole eyes and isolated retinas were then transferred to a solution of PBS and 30% sucrose. After the tissues were infiltrated, eyes were transferred to cryostat sectioning molds and frozen in OCT medium (Tissue Freezing Medium; Triangle Biomedical Sciences, Durham, NC, USA). Thin 10 μm sections were cut on a cryostat (Leica Microsystems, Wetzlar, Germany), dried onto slides and maintained at –20°C overnight. Slides were post‐fixed in 100% acetone for 5 min and were then dried at 50°C for 1 h. The tissue was blocked with 20% normal donkey serum and primary antibodies were: goat polyclonal anti‐IRBP (N‐21; Santa Cruz Biotechnology, Santa Cruz, CA, USA) and mouse monoclonal IGFBP‐3 IgG1 (E‐9; Santa Cruz Biotechnology). Primaries were applied to tissue at 1:100 dilution (all reagents from Santa Cruz Biotechnology). Sections used for staining controls were not exposed to primary antibodies. The secondary antibody used for fluorescence was Cy™2‐conjugated AffiniPure goat anti‐mouse IgG1, which was used at a 1:100 dilution for all tissues (Jackson ImmunoResearch, West Grove, PA, USA). 4′,6‐diamidino‐2‐phenylindole (DAPI) was used to stain cell nuclei at a dilution of 1:20,000. Images were taken using an Axioplan2 imaging microscope (Carl Zeiss, Oberkochen, Germany), the EXFO X‐Cite 120 Fluorescence system (EXFO, Quebec, Canada), an AxioCam HRm camera (Carl Zeiss) and AxioVision Rel. 4.6 software (Carl Zeiss). Exposures times for the secondary antibody and DAPI were matched for the whole eye images and for the isolated retina images.
Western blotting
Protein extracts were obtained from whole eye (with RPE) and isolated retina (without RPE) of adult wild‐type mice by sonication in a buffer containing 25 mm sucrose, 100 mm Tris‐HCl (pH 7.8) and a mixture of protease inhibitors (phenylmethanesulfonyl fluoride, N‐α‐tosyl‐l‐lysine chloromethyl ketone, aprotinin, leupeptin and pepstatin). The total protein concentration of protein extract from individual mice retina and whole eye was measured using the Bio‐Rad protein assay (Bio‐Rad, Hercules, CA, USA) and 30 μg of total protein was used to detect individual proteins. The detection of proteins was performed using an infrared secondary antibody and an Odyssey infrared imager (Li‐Cor, Lincoln, NE, USA) (Shinde et al. 2012). Antibodies that detect the IRBP (sc‐390218; dilution 1:500) and IGFBP3 (sc‐374365; dilution 1:500) were obtained from Santa Cruz Biotechnology. β‐actin was used as an internal control and was detected by the application of anti‐β‐actin antibody (dilution 1:1000; Sigma‐Aldrich).
Rod volume and spacing
Rod photoreceptor spacing has been defined in humans by both histological (Curcio et al. 1990) and advanced imaging techniques (Doble et al. 2011; Merino et al. 2011). Each report concurs that the centre‐to‐centre rod spacing is ∼3.0 μm in the peripheral retina. Given an average rod diameter of 1.32 μm and length of 23.8 μm, the total volume (cytoplasmic + disc) of the ROS is estimated to be 3.2 × 10⁻¹⁴ litres (Nickell et al. 2007). By assuming an additional distance of 1.5 μm between the ROS, a cylindrical volume can be calculated to make an estimate of the cylindrical extracellular space equal to 3.81 × 10⁻¹³ litres (Fig. 8 A, pink annulus).
Figure 8. A model of retinol release and the possible pathways resulting in IGF‐1R activation .
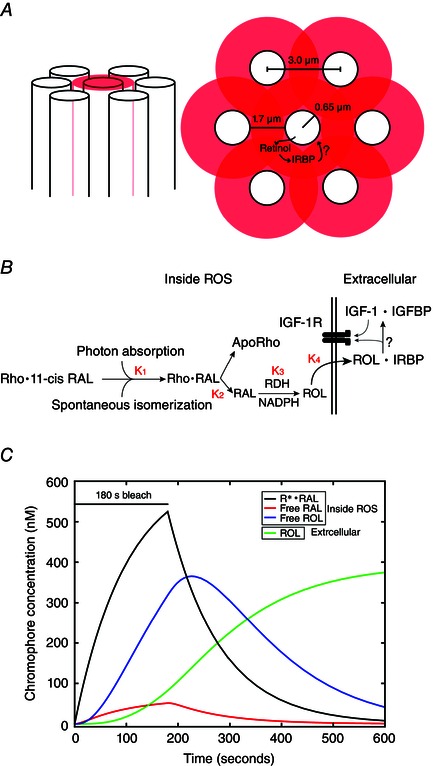
A, an illustration of rod spacing, with transparent red circles showing extracellular space and regions of overlap. B, reactions in the chromophore pathway. First, the conversion of rhodopsin bound to 11‐cis retinal (Rho•11‐cis RAL) to rhodopsin‐bound all‐trans retinal (Rho•RAL). K 1 represents the bleach rate that results in AP (set to 500 R* s–1). RAL dissociates from rhodopsin slowly, forming free RAL and aporhodopsin. The rate constant for this reaction was set to 5 molecules s–1. As a result of the mild nature of the bleach, the conversion of RAL to ROL by retinol dehydrogenase was assumed to occur rapidly, and K 3 was set to 30 molecules s–1. Finally, the rate of ROL leaving the cell, K 4, was assumed be accelerated by IRBP and was set at 10 molecules s–1. The reactions depicted in the extracellular space are hypothetical, and involve the interaction of IRBP with IGFBPs, resulting in the release of IGF‐1 and the activation of the IGF‐1R. C, model representing the accumulation of the bleached chromophore products during and after a 180 s bleaching exposure. Rhodopsin is activated at 500 R* s–1, and the accumulating products are bleached rhodopsin (Rho•RAL, black), RAL that has dissociated from bleached opsin (Free RAL, red), RAL that has been converted to ROL inside the cell (Free ROL, blue) and ROL that has been released into the extracellular space (ROL, green). The results of the modelled equations in (B) are converted from molecules to nm using ROS and the extracellular volume as calculated in the Methods.
Model of retinol release
The light range that reliably produces AP is 100–1000 R* s–1. Given 7.0 × 10⁷ molecules rhodopsin/rod (Lyubarsky et al. 2004), in a 3 min bleach, this corresponds to (180 s × 100–1000 R* s–1)/7.0 × 107 molecules = 0.03–0.25% bleach (Table 1). With the calculated volume of the ROS (3.2 × 10⁻¹⁴ litres), the concentration of bleached chromophores involved in AP is equal to total moles chromophore bleached/volume ROS = 1.27–10.5 μm bleached rhodopsin produced inside the cell. The terms used in the modelling of the rate of retinol formation and clearance are reported as molecules per second. The results of the modelling are converted to molarity using the volumes reported in Table 1.
Table 1.
Parameters of size, space, volume and bleaching for AP model
| Parameter | Value | Unit | Reference |
|---|---|---|---|
| ROS dimensions | |||
| ROS diameter | 1.32 | μm | (Liang et al. 2004) |
| ROS length | 23.8 | μm | (Liang et al. 2004) |
| ROS cytoplasm/disc volume | 3.20 × 10⁻¹⁴ | Litre | (Nickell et al. 2007) |
| Extracellular volume | |||
| Disc space: centre‐to‐centre | 3.0 | μm | (Curcio et al. 1990; Doble et al. 2011; Merino et al. 2011) |
| Volume, calculated | 3.81 × 10⁻¹³ | Litre | |
| Retinol generated by AP bleach | |||
| Rhodopsin/rod | 7.00 × 10⁷ | Molecules | (Lyubarsky et al. 2004) |
| Avogadro's number | 6.022 × 10²³ | Molecules mole–1 | |
| Bleach range | 100‐1000 | R* s–1 | (McKeown & Kraft, 2014) |
| Bleach duration | 180 | s | (McKeown & Kraft, 2014) |
| Retinal bleach, calculated | 3.36–28 × 10−20 | Moles (range) | |
| Intracellular concentration | 1.05–8.75 | μm (range) |
Modelling was performed using the SimBiology module of Matlab 2014a (MathWorks Inc., Natick, MA, USA). Each reaction given in Fig. 8 B was run in a simultaneous simulation using the SimBiology ordinary differential equation (ode15) solver.
Statistical analysis
All statistical analysis was performed within IGOR (WaveMetrics Inc.) and Matlab 2014a routines. To test for significant differences between populations of recorded cells/retinas, a two‐tailed Student's t test was used. For each recording, the assumption was made that the only change be in the dependent variable (i.e. the concentration of growth factor applied). Additionally, at least three separate recordings were made in each condition in an attempt to identify and reject aberrant results.
Results
Exogenous retinoids have a concentration‐dependent effect on photoreceptor sensitivity
We have shown that AP is a light adaptation phenomenon generated by specific conditioning light exposure. To simulate the chromophore release aspect of the initial signalling event that generates AP, retinas were exposed to various concentrations of bleached chromophore products: ROL or RAL. The ROL concentrations ranged from 0.1 nm to 1000 nm, whereas two concentrations of RAL were tested (10 nm and 1000 nm). For the experiments reported here, we first established the baseline flash responses of the retina, and then the magnitude of AP was quantified by exposing the retina to a just‐saturating conditioning light for 3 min and observing the increase in the light response after the bleach (Fig. 1, AP paradigm). The flash response was monitored for 10–15 min during application of chromophore, and then AP was tested again in the presence of chromophore (Fig. 1, AP2). The chromophore solution was then washed out for 10–15 min while monitoring the flash response, and AP was tested a final time (Fig. 1, AP3). At the lowest concentration, 0.1 nm retinol did not significantly affect the flash response to a given stimulus intensity or the magnitude of AP. However exposure to 1 nm ROL increased the amplitude of the flash response by almost 20%. An example experiment is shown in Fig. 1 (lower panels, black to blue trace with solution application). Averages are shown in Fig. 2. The magnitude of AP, as a percentage of the maximum increase in light response, was decreased, although the potentiated maximum light response (μV) was unchanged (Fig. 1, lower panel, dashed line). Similar effects were seen with the application of 10 and 100 nm ROL, whereas solutions of 1000 nm ROL significantly decreased the flash response amplitude (Fig. 2 A). Application of 100 nm and 1000 nm ROL blocked AP (Fig. 2 B). At 10 nm, RAL did not appear to affect the flash response or the magnitude of AP, whereas 1000 nm RAL significantly decreased both the flash response amplitude and the magnitude of AP. These results indicate that ROL and higher concentrations of RAL can significantly affect photoreceptor sensitivity and that one or both may play a role in the signalling of AP.
Figure 1. Example experiment showing the effect of 1 nM ROL on the rod light response and AP in a single retina .
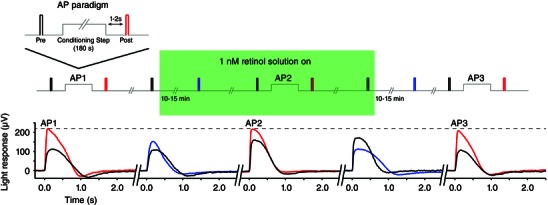
The magnitude of AP was first established with the paradigm shown in the inset. The magnitude of AP was defined as the increase in the light response amplitude following 3 min of saturating illumination (AP1, black vs. red traces). The key illustrates the timing of the stimuli, as well as the application period of ROL. After a 5 min recovery from AP, a solution of ROL (1 nm in this experiment) was flowed over the retina (green shaded box) and the light response was monitored for 15 min. At 1 nm, ROL increased the amplitude of the light response and accelerated response recovery (second panel black vs. blue traces). AP was tested a second time in the presence of ROL. As a percentage, the magnitude of AP was diminished in the presence of ROL (AP2, black vs. red traces) but the peak AP increase was unchanged. The solution of ROL was then washed off for 15 min, and the light response was monitored. Washout of ROL showed a decrease in response amplitude and a deceleration of response recovery (fourth panel, black vs. blue trace). Finally, AP was tested after ROL washout, where the magnitude of AP fully recovered (AP3, black vs. red traces).
Figure 2. Effects of extracellular retinoids on the light response and AP magnitude .
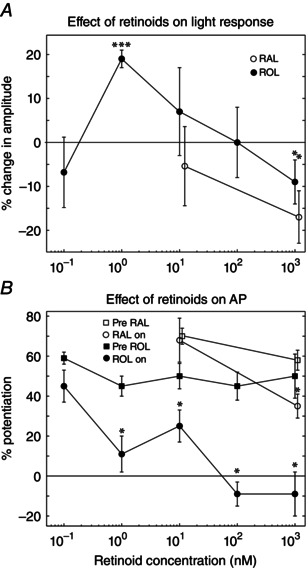
Individual retinas were exposed to a single concentration of RAL or ROL. A, the light response amplitude increased with 1 nm ROL but decreased with exposure to 1000 nm ROL or RAL. B, low‐dose retinol does not alter AP magnitude (n = 4) but all concentrations of ROL ≥1 nm decreased the magnitude of AP (1 nm: n = 6; 10 nm: n = 4; 100 nm: n = 3; 1000 nm: n = 3). There was no change in AP magnitude when the tissue was exposed to 10 nm RAL (n = 3) but 1000 nm RAL reduced AP (n = 3). The number of retinas in (B) is the same as in (A). *P < 0.01, ***P < 0.001.
Application of exogenous IGF‐1 increases cell sensitivity and disrupts light adaptation
The initial studies of AP implicated IGF‐1R in the AP signalling pathway (McKeown & Kraft, 2014). A previous study reported that application of 0.5–1 μm (5700 ng ml−1) IGF‐1 increased the sensitivity of rod photoreceptors (Savchenko et al. 2001). However, biochemical analysis of the IGF‐1 concentration in the bovine IPM indicates that the mean ± SD physiological concentration is in the order of 21.4 ± 10.9 pM, which is ∼0.1 ng ml−1 (Waldbillig et al. 1991). Therefore, we applied physiologically relevant concentrations (0.1 and 10 ng ml−1) of various growth factors and monitored the flash response and AP magnitude during exposure. The growth factors used were: IGF‐1 to test the hypothesis that IGF‐1 exposure can increase mammalian photoreceptor sensitivity; IGF‐2 to test the specificity of IGF‐1 signalling because IGF‐2 is a less potent activator of the IGF‐1 receptor; and fibroblast growth factor (FGF) as a control. Growth factor experiments proceeded similarly to the retinoid experiments shown in Fig. 1. Application of 0.1 ng ml−1 IGF‐1 elicited an increase in the flash response magnitude and a decrease in the magnitude of AP. An example experiment is shown in Fig. 3. Averages are shown in Fig. 4. Application of IGF‐1 increased the mean ± SD amplitude of the light response by 22 ± 4% when it was washed on, and the light response decreased by 17 ± 5% when IGF‐1 was washed off (Fig. 4 A1). IGF‐1 application also appeared to consistently accelerate the recovery of light response (see Discussion).
Figure 3. Example experiment illustrating the effect of 0.1 ng ml−1 IGF‐1 on the rod light response and AP in a single retina .
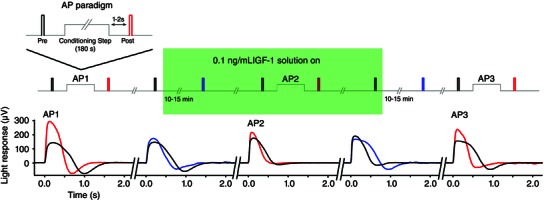
The magnitude of AP was first established with the light exposure paradigm (AP1, black vs. red traces). The stimulus key indicates the timing of the stimulus traces (colour coded), as well as the application of IGF‐1. After a 5 min recovery from AP, a solution containing 0.1 ng ml−1 IGF‐1 was flowed over the retina (green shaded box) and the light response was monitored for 15 min. Application of IGF‐1 increased the amplitude of the light response and accelerated response recovery (second panel, black vs. blue traces). AP was tested in the presence of IGF‐1, and the magnitude was clearly diminished in the presence of the growth factor (AP2, black vs. red traces). The solution of IGF‐1 was then washed off for 15 min, and the light response was monitored. Washout of IGF‐1 returned the light response to the control amplitude and duration (fourth panel, black vs. blue trace). Finally, AP was tested again to monitor recovery from IGF‐1 exposure (AP3, black vs. red traces).
Figure 4. Effect of growth factors on the light response and AP magnitude .
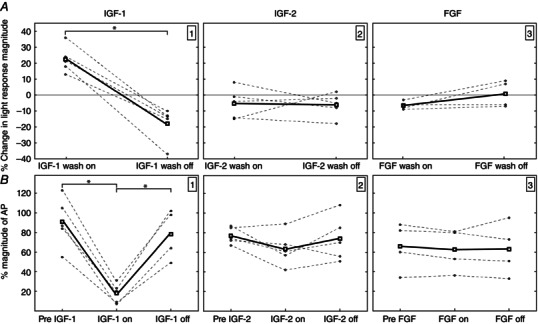
Light responses: A; AP magnitude; B. Left: IGF‐1 (0.1 ng ml−1) increases the amplitude of the flash response during wash on and the light response decreased when washed off. Dashed lines connect individual retinas across a single experiment, whereas the solid boxes represent the mean of the individual experiments. The negative change during after wash off indicates a return of amplitude back to pre‐exposure levels. There was no effect on the light response when retinas were exposed either 10 ng ml−1 IGF‐2 (middle) or 10 ng ml−1 FGF (right). IGF‐1 reversibly decreased the amplitude of AP (B), whereas there was no affect on AP with application of IGF‐2 or FGF.
Similar experiments were performed to investigate the specificity of IGF‐1 signalling using IGF‐2. At 10 ng ml−1, application of IGF‐2 did not significantly affect the light response or the magnitude of AP (Fig. 4 A2 and B2). As an additional control, retinas were exposed to 10 ng ml−1 FGF. FGF did not affect the amplitude of the flash response, nor the magnitude of AP (Fig. 4 A3 and B3).
Incubation with 11‐cis retinal reduces the magnitude of AP in single cells
By studying the cells of animals that were exposed to room lighting prior to being killed, and whose retinas were dissected under visible illumination, we demonstrate how exposure to excess 11‐cis retinal can reduce the magnitude of AP. In both mouse and primate rods, regeneration of bleached rhodopsin with 25 μm 11‐cis retinal decreases the magnitude of AP compared to that of the dark‐adapted mouse: mean ± SD AP of 33 ± 3% (regenerated mouse AP: 19 ± 3%, n = 4 cells, P < 0.05; regenerated primate AP: 17 ± 1%, n = 4 cells, P < 0.01; example cells are shown in Fig. 5) (McKeown & Kraft, 2014). When the same amount of 11‐cis retinal was applied to dark‐adapted mouse rods, the magnitude of AP was decreased by an amount similar to that in the light‐adapted cells (20 ± 6%, n = 4 cells, P < 0.05). Thus, it appears that higher levels of extracellular 11‐cis retinal will decrease the amplitude of AP, possibly by occupying multiple binding sites on IRBP, or by activating additional, less sensitive pathways.
Figure 5. Effects of excess 11‐cis retinal on AP in single cells .
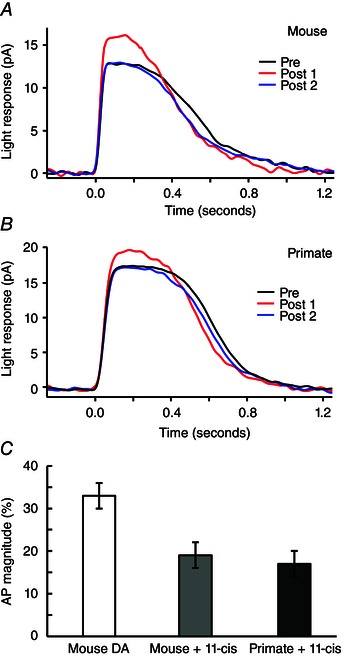
A, flash responses from a light‐adapted mouse rod whose pigment was regenerated in darkness with added 11‐cis retinal. AP magnitude: red vs. black/blue traces was smaller than that reported for dark‐adapted mouse rods. B, flash responses from a light‐adapted primate rod whose visual pigment was regenerated. AP was present in each primate rod studied and similar in magnitude to the AP of mouse rods treated in a similar fashion. C, AP magnitude for a group of dark adapted mouse rods (white bar, 33 ± 3%) (McKeown & Kraft, 2014) was significantly larger (P < 0.05) than that of light adapted and regenerated rods from mouse (grey bar, 19 ± 3%, n = 4) and primate (black bar, 17 ± 1%, n = 4).
Immunohistochemistry confirms the presence of IRBP and IGFBP‐3 in the photoreceptor layer of isolated retinas
The photoreceptors, the IPM and the RPE form a tight and dynamic environment with functions including chromophore recycling and outer segment phagocytosis. To study photoreceptor function, the isolated retinas used in each of these experiments were first dissected away from the RPE. It is possible that the proteins of the IPM could be displaced or lost altogether during dissection of the retina from the RPE and, if such protein displacement occurred, it would be incorrect to attribute this signalling phenomenon to extracellular components. Therefore, we performed immunohistochemistry on whole eyes (with RPE attached) and isolated retinas to localize IRBP and IGFBP‐3. Both proteins are present in the photoreceptor layer in whole eyes (Fig. 6 B and C) and there were a number of small processes in the inner plexiform layer that were positive for IGFBP‐3, as indicated by the white arrowhead in Fig. 6 C. Protein labelling in the isolated retinas was less uniform, as might be expected from disruption of the RPE‐IPM connections, although both IRBP and IGFBP‐3 were still located in the photoreceptor layer (Fig. 6 E and F). There was also considerable staining in the inner plexiform layer for both proteins, indicating that the process of retinal isolation may perturb inner retinal structures and cause improper protein localization and/or improper cellular protein release. The presence of both IRBP and IGFBP‐3 in isolated retinas suggests that those proteins can participate in native signalling events in the absence of the RPE. To confirm that IRBP and IGFBP‐3 protein were present in isolated retinas and whole eyes, we performed western blot analysis of tissue handled in the same manner as that used for the isolated retina ERG and immunohistochemistry experiments. Both IRBP and IGFBP‐3 are present in whole eye and isolated tissue samples (Fig. 7), indicating that both proteins may be functionally involved in the isolated retina ERG, as discussed in the model below. The presence of both IRBP and IGFBP‐3 in the outer segment/IPM layer of isolated retinas supports the idea that those proteins participate in signalling events in the absence of the RPE.
Figure 6. Immunohistochemistry indicates the presence of IRBP and IGFBP‐3 in both whole eyes and isolated retinas .
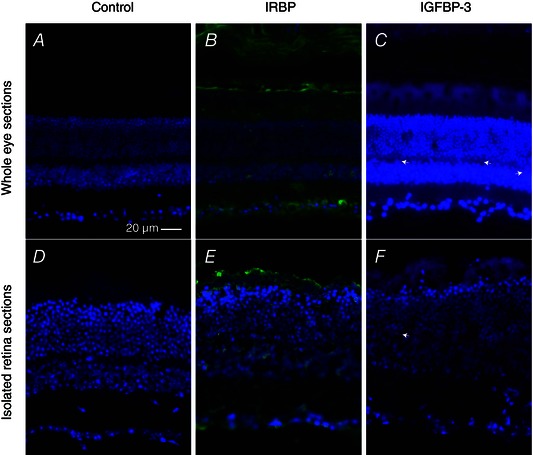
A–C, whole eyes were removed from dark‐adapted mice and the cornea was removed. Eyes were fixed, sectioned and stained for either (B) IRBP or (C) IGFBP‐3. The control slide in (A) was not exposed to primary antibody. IRBP is clearly present in the photoreceptor layers adjacent to the attached RPE. IGFBP‐3 is also present in the photoreceptor layer, and there were numerous processes in the inner plexiform layer that stained positive for IGFBP‐3 (e.g. white arrowhead). For each of the whole eye sections, exposure times (ms) were (A) DAPI, 150; Cy‐2, 55, (B) DAPI, 150; Cy‐2, 55 and (C) DAPI, 160; Cy‐2, 41. D–F, retinas were isolated from dark‐adapted mice in the same manner as that used for the isolated retina ERG experiments. Retinas were then fixed, sectioned and stained for either (E) IRBP or (F) IGFBP‐3. The retina in the control slide in (D) was not exposed to primary antibodies. The proteins of interest are present in both the photoreceptor layer and the inner plexiform layer. For each of the isolated retina sections, exposure times (ms) were (D) DAPI, 62; Cy‐2, 100, (E) DAPI, 73; Cy‐2, 43 and (F) DAPI, 55; Cy‐2, 146.
Figure 7. Western blotting reveals IRBP and IGFBP‐3 in both whole eye and isolated retina preparations .
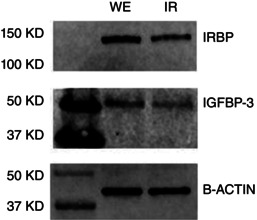
To correlate the presence of extracellular proteins with the immunohistochemical findings in Fig. 6, we dissected eyes from five mice in the same manner as that used for the other experiments. We then homogenized the tissue and combined the protein from five whole eyes (WE) to be run alongside five combined isolated retinas (IR). Immunopositive bands were present at the expected molecular weights for both IRBP and IGFBP‐3 in both whole eye and isolated retina protein extracts. β‐actin was used as a loading control.
A model of AP in the IPM
Signalling of AP and increases in photoreceptor sensitivity appear to be a result of the release of RAL/ROL and the subsequent action of IGF‐1. As indicated in the original description of AP, adaptation is maximally evoked with light exposures that activate between 100 and 1000 rhodopsin molecules per second (R* s–1) for a period of 3 min (McKeown & Kraft, 2014). Based on a total concentration of 7 × 10⁷ molecules of rhodopsin per rod (Lyubarsky et al. 2004), these light exposures produce at most a 0.25% bleach of the total rhodopsin content of an individual rod. With the bleach rate and the published values on retinoid processing rates, we attempt to model the formation and release of retinoid products with respect to photoreceptor sensitivity and signalling of AP. The results of the modelling support the notion that the amount of ROL released into the extracellular space during AP‐inducing light exposures corresponds to the externally applied concentrations of ROL that increase cell sensitivity (1–100 nm).
The rate‐limiting step in rhodopsin regeneration appears to be the release of RAL from the opsin molecule (Heck et al. 2003; Kolesnikov et al. 2003). Kolesnikov et al. (2003) also demonstrated that bleaches of less than 3% did not result in detectable levels of the Meta III form of rhodopsin, and so subspecies is not accounted for in our model. The rates of RAL conversion to ROL, and subsequent ROL clearance from the ROS, have been modelled previously in both the toad and mouse (Wu et al. 2007; Chen et al. 2009). Here, we employ a release model designed to represent chromophore cycling during conditioning light exposures that induce AP. In darkness, the amount of ROL bound to IRBP in the extracellular space is almost equal to 11‐cis retinal and RAL and, upon light exposure, the amount of ROL bound to IRBP increases by 4‐ to 5‐fold (Saari et al. 1985; Adler & Spencer, 1991). The concentration of extracellular ROL will be steadily reduced in the presence of RPE, and cultured RPE cells have been shown to take up extracellular ROL when applied with IRBP over the course of ∼1 h (Flannery et al. 1990). This process will not be considered in this model because the RPE has been removed in these electrophysiology experiments but will need to be incorporated in an in vivo scenario. Also, extracellular ROL is considered to be bound to IRBP for the purpose of this model.
Rod spacing, the ROS volume and the extracellular space surrounding the rods are depicted in Fig. 8 A. The calculations of the respective volumes are included in the methods. The initial steps in opsin regeneration are outlined in Fig. 8 B, and the rate constants of opsin activation (K1), RAL release from the opsin molecule (K2), the rate of RAL conversion to ROL (K3) and the rate of ROL release to the extracellular space (K4) are given in the legend to Fig. 8. Recent reports indicate that there is a ‘rapid’ phase of ROL formation within the first minute after bleaching cessation (Chen & Koutalos, 2010). Also, the enzymatic conversion of RAL to ROL by retinol dehydrogenase requires the cofactor NADPH, which is the limiting factor in the conversion rate following intense bleaches (Miyagishima et al. 2009). Here, we assume that our mild bleach does not completely deplete the internal NADPH, which is concentrated at ∼1 mm in amphibian rods, and that RAL conversion to ROL is not rate limiting.
Given the reported rates of release and enzymatic conversion, our model assumes that light exposures resulting in AP allow for the rate‐limiting release of RAL from opsin followed by a fast conversion of RAL to ROL and extrusion into the extracellular space. The amounts of bleached photoproducts building up and/or being depleted in various compartments are given in Fig. 8 C, and indicate that extracellular concentrations of ROL could rise to ∼70–80 nm in the extracellular space after a 180 s bleaching exposure. This calculation assumes an extracellular space of 0.38 pL (see Methods). It is possible that the concentration of retinol released into the extracellular space could be higher because there would be multiple rods releasing retinol, presumably equally in every direction. This overlap might increase the amount of total retinol in the extracellular space by as much as three‐fold and possibly increase the amount of IGF‐1 released onto each rod in the isolated retina. We did not allow for diffusion or washout in the isolated retina experiments, nor did we include retinoid partitioning into the membranes or uptake rates into the RPE.
Discussion
Photoreceptor adaptation is a complex signalling process known to involve numerous proteins and pathways. In the present study, we have identified a new role for retinoids, in which they act in the extracellular space to influence rod sensitivity. Both ROL and IGF‐1 significantly alter photoreceptor flash sensitivity and both compounds appear to be involved in the signalling cascade that generates AP.
We have demonstrated that the exogenous ROL concentration, similar to that building up after low‐intensity bleaches, can increase rod sensitivity. Other retinoid molecules not bound to visual pigments may also influence the phototransduction sensitivity because RAL has been shown to reduce the sensitivity of CNG channels in excised patches (Dean et al. 2002). However, intact rods appear to be protected from RAL desensitization (He et al. 2006). Interestingly, He et al. (2006) also demonstrated that millimolar levels of RAL could overcome the internal buffer system and impair rod sensitivity. Efficient chromophore recycling is also important for photoreceptor health, and high levels of RAL appear to cause degenerative states such as Stargardt's disease (Weng et al. 1999). The neruoprotective insulin receptor signalling pathway also appears to be tied to retinoid build‐up because the pathway is activated by light even in the absence of a complete phototransduction cascade (Rajala et al. 2007). Thus, retinoids clearly contribute more to retinal function than the simple absorption of photons in the photoreceptors, and their turnover rates can reflect integrated activity over time and, via this feedback pathway, help to regulate photoreceptor sensitivity.
Structurally and functionally, the IPM is a unique zone in the retina. It is bordered on two sides by sheets of epithelial cells. Just beyond the distal tips of the photoreceptors, there are the tight junctions of the RPE (zonula occludens) that make up the outer blood–retinal barrier. The external limiting membrane represents the inner edge of the IPM, and is defined by the Müller cell microvillae (zonulae adherents) bound to photoreceptors. These structures define the mammalian IPM as a semi‐sealed compartment that prevents large proteins (Stokes radius >30 Å) from entering or exiting the matrix (Bunt‐Milam et al. 1985). IRBP, with a Stokes radius of 55 Å, is thus contained within the IPM, and facilitates the movement of retinol between the photoreceptors and the RPE. In our experiments, the RPE was removed, possibly disturbing the IPM, as suggested by immunohistochemistry and the protein analysis of isolated retinas. However, the mean ± SD magnitude of AP in the experiments presented here was 69 ± 11% for 58 retinas, all with 3 min conditioning exposures, whereas the initial report for 3 min exposures in single cells indicated that AP was 33 ± 7%. After the removal of the RPE, the integrity of the IPM is probably better preserved in the isolated retina preparation than in single cell experiments, which would explain why the AP magnitudes are considerably larger in these experiments. The IPM may still be partially preserved around single photoreceptors, although the act of isolating and drawing an individual photoreceptor into a recording electrode may reduce the IPM, leading to lower recorded values of AP as observed previously in single cell experiments.
IRBP is the primary facilitator of retinoid transfer, and it is closely associated with the ROS (Schneider et al. 1986; Wu et al. 2007). IRBP is also the main facilitator of retinol release from the ROS (Wu et al. 2007), including in preparations such as the isolated retina (Qtaishat et al. 2005). We propose that IRBP, possibly through interaction with a membrane bound receptor or binding site, is involved in signalling chromophore bleach to the IGF‐1 pathway. Interestingly, in a clinical trial investigating dark‐adaptation rates in older adults, participants who received a daily dose of 50,000 IU of retinol taken orally dark‐adapted significantly more rapidly than the placebo control group (Owsley et al. 2006). Those findings suggest that older individuals with early stages of age‐related maculopathy may have impaired retinoid cycling, which can result in photoreceptor malfunction and cell loss. Thus, the retinol signalling pathway described here may also have a role in maintaining cell health by controlling phototransduction sensitivity through signalling via the IGF‐1 receptor and the insulin receptor.
The retinoids used in the present study are soluble up to ∼0.1 μm in physiological buffer (Szuts & Harosi, 1991). Although we did not use a carrier protein to deliver the retinoids directly, we made sure to coat plastic and glass surfaces prior to each experiment with 1% BSA to prevent the lipophilic retinoids from adsorbing to those surfaces. We did not want serum albumin present during studies of potentiation as a result of its presence, along with other retinoid binding proteins, in the IPM (Adler & Edwards, 2000). Given the reported solubility of retinoids, the absence of a carrier and the tendency of retinoids to enter lipid bilayers, our effective concentrations may have been less than that reported here. However, we expect IRBP binding sites to saturate with any retinoids, regardless of whether they are produced from bleaching or applied to the extracellular space, and our model suggests that it is the binding of a certain level of retinol that elicits AP. The type of retinoid also appears to be important because IRBP contains three binding sites: site one prefers 11‐cis RAL and ROL equally, whereas site two strongly prefers 11‐cis RAL and site three strongly prefers ROL (Shaw & Noy, 2001). The lack of AP when using high levels of ROL and RAL (Fig. 2), along with the regeneration experiments with 11‐cis RAL (Fig. 5), suggests that the ratio of retinoid binding to IRBP may be the critical factor in determining AP magnitude. Indeed, high levels of RAL may have allowed some RAL to enter the photoreceptors and be reduced and released as ROL, although we observed an overwhelming suppression of AP in the presence of RAL. Finally, docosahexaenoic acid, which is present in high concentrations in photoreceptors (Fliesler & Anderson, 1983), promotes the release of 11‐cis RAL from IRBP site two but not sites one or three (Chen et al. 1996). Such a mechanism may help with the directionality of retinoid movement between photoreceptors and the RPE, and it may give the IRBP‐ROL complex different characteristics near the photoreceptors.
IGFBPs are also present throughout the retina and are secreted by the Müller glia and RPE in the forms IGFBP‐2, ‐3, ‐4, ‐5 and ‐6 (King & Guidry, 2004; Mukherjee et al. 2009). The presence of IGFBP‐3 in the photoreceptor layer indicates that it may be involved in sequestering IGF‐1 in the IPM. In addition to binding IGFs, IGFBP‐1 and ‐2 have been shown to bind to integrins at the cell surface, which could lead to an increased local concentration near the IGF‐1R (Binkert et al. 1989; Jones et al. 1993). Tight binding of IGFBPs to the ROS membrane would also reduce the need for intact IPM surrounding photoreceptors during single‐cell recordings of AP. The IGFBP–integrin interaction is also a possible route for signal transduction of AP from the intracellular to the extracellular space.
The connection, if any, between IRBP and IGFBPs in the extracellular space has yet to be demonstrated, although our physiological results are suggestive of such an interaction. In the absence of an IRBP–IGFBP interaction, bleached chromophore products and IGF‐1 may be acting as independent mechanisms of photoreceptor sensitivity modulation. All of our results are consistent with a model in which the generation of a sufficient quantity of ROL causes the release of IGF‐1 in the extracellular space. Free IGF‐1 may then activate the IGF‐1 receptor, leading to dephosphorylation of the CNG channel, thus increasing rod sensitivity and resulting in a paradoxical hypersensitivity to light, and generating the phenomenon we term adaptive potentiation.
Additional information
Competing interests
The authors declare that they have no competing interests.
Funding
This work was supported by NIH Grant EY023603 (TWK) and a core grant to UAB P30EY003039.
Author contributions
AM and TWK conceived and designed the experiments. AM, PP and TWK acquired, analysed and interpreted the data. AM and TWK drafted and revised the manuscript for important intellectual content. All authors approve the final version of the manuscript and agree to be accountable for all aspects of the work. All persons designated as authors qualify for authorship, and all those who qualify for authorship are listed.
Acknowledgements
The authors would like to thank Vishal Shinde for providing technical assistance when performing the western blots and Evan Boitet for assistance with the immunohistochemistry experiments. We also thank Dr. Clyde Guidry for helpful discussions regarding IGF‐1 and its binding proteins.
References
- Adler A & Edwards R (2000). Human interphotoreceptor matrix contains serum albumin and retinol‐binding protein. Exp Eye Res 70, 227–234. [DOI] [PubMed] [Google Scholar]
- Adler A & Martin K (1982). Retinol‐binding proteins in bovine interphotoreceptor matrix. Biochem Biophys Res Commun 108, 1601–1608. [DOI] [PubMed] [Google Scholar]
- Adler A & Spencer S (1991). Effect of light on endogenous ligands carried by interphotoreceptor retinoid‐binding protein. Exp Eye Res 53, 337–346. [DOI] [PubMed] [Google Scholar]
- Arshavsky V & Burns M (2012). Photoreceptor signaling: supporting vision across a wide range of light intensities. J Biol Chem 287, 1620–1626. [DOI] [PMC free article] [PubMed] [Google Scholar]
- Binkert C, Landwehr J, Mary J, Schwander J & Heinrich G (1989). Cloning, sequence analysis and expression of a cDNA encoding a novel insulin‐like growth factor binding protein (IGFBP‐2). EMBO J 8, 2497–2502. [DOI] [PMC free article] [PubMed] [Google Scholar]
- Bunt‐Milam A & Saari J (1983). Immunocytochemical localization of two retinoid‐binding proteins in vertebrate retina. J Cell Biol 97, 703–712. [DOI] [PMC free article] [PubMed] [Google Scholar]
- Bunt‐Milam A, Saari J, Klock I & Garwin G (1985). Zonulae adherentes pore size in the external limiting membrane of the rabbit retina. Invest Ophthalmol Vis Sci 26, 1377–1380. [PubMed] [Google Scholar]
- Chen C, Blakeley LR & Koutalos Y (2009). Formation of all‐trans retinol after visual pigment bleaching in mouse photoreceptors. Invest Ophthalmol Vis Sci 50, 3589–3595. [DOI] [PMC free article] [PubMed] [Google Scholar]
- Chen C & Koutalos Y (2010). Rapid formation of all‐trans retinol after bleaching in frog and mouse rod photoreceptor outer segments. Photochem Photobiol Sci 9, 1475–1479. [DOI] [PMC free article] [PubMed] [Google Scholar]
- Chen Y, Houghton L, Brenna J & Noy N (1996). Docosahexaenoic acid modulates the interactions of the interphotoreceptor retinoid‐binding protein with 11‐cis‐retinal. J Biol Chem 271, 20507–20515. [DOI] [PubMed] [Google Scholar]
- Curcio C, Sloan K, Kalina R & Hendrickson A (1990). Human photoreceptor topography. J Comp Neurol 292, 497–523. [DOI] [PubMed] [Google Scholar]
- Dean DM, Nguitragool W, Miri A, McCabe SL & Zimmerman AL (2002). All‐trans‐retinal shuts down rod cyclic nucleotide‐gated ion channels: a novel role for photoreceptor retinoids in the response to bright light? Proc Natl Acad Sci USA 99, 8372–8377. [DOI] [PMC free article] [PubMed] [Google Scholar]
- Doble N, Choi S, Codona J, Christou J, Enoch J & Williams D (2011). In vivo imaging of the human rod photoreceptor mosaic. Opt Lett 36, 31–33. [DOI] [PMC free article] [PubMed] [Google Scholar]
- Flannery J, O'Day W, Pfeffer B, Horwitz J & Bok D (1990). Uptake, processing, and release of retinoids by cultured human retinal pigment epithelium. Exp Eye Res 51, 717–728. [DOI] [PubMed] [Google Scholar]
- Fliesler S & Anderson R (1983). Chemistry and metabolism of lipids in the vertebrate retina. Prog Lipid Res 22, 79–131. [DOI] [PubMed] [Google Scholar]
- Gupta V, Rajala A & Rajala R (2012). Insulin receptor regulates photoreceptor CNG channel activity. Am J Physiol Endocrinol Metab 303, E1363–E1372. [DOI] [PMC free article] [PubMed] [Google Scholar]
- Hagins W, Penn R & Yoshikami S (1970). Dark current and photocurrent in retinal rods. Biophys J 10, 380–412. [DOI] [PMC free article] [PubMed] [Google Scholar]
- He Q, Alexeev D, Estevez ME, McCabe SL, Calvert PD, Ong DE, Cornwall MC, Zimmerman AL & Makino CL (2006). Cyclic nucleotide‐gated ion channels in rod photoreceptors are protected from retinoid inhibition. J Gen Physiol 128, 473–485. [DOI] [PMC free article] [PubMed] [Google Scholar]
- Heck M, Schadel SA, Maretzki D, Bartl FJ, Ritter E, Palczewski K & Hofmann KP (2003). Signaling states of rhodopsin. Formation of the storage form, metarhodopsin III, from active metarhodopsin II. J Biol Chem 278, 3162–3169. [DOI] [PMC free article] [PubMed] [Google Scholar]
- Jones J, Gockerman A, Busby W, Wright G & Clemmons D (1993). Insulin‐like growth factor binding protein 1 stimulates cell migration and binds to the a5b1 integrin by means of its Arg‐Gly‐Asp sequence. Proc Natl Acad Sci 90, 10553–10557. [DOI] [PMC free article] [PubMed] [Google Scholar]
- Karwoski C, Lu H & Newman E (1989). Spatial buffering of light‐evoked potassium increases by retinal Müller (glial) cells. Science 244, 578–580. [DOI] [PMC free article] [PubMed] [Google Scholar]
- King JL & Guidry C (2004). Muller cell production of insulin‐like growth factor‐binding proteins in vitro: modulation with phenotype and growth factor stimulation. Invest Ophthalmol Vis Sci 45, 4535–4542. [DOI] [PubMed] [Google Scholar]
- Kolesnikov AV, Golobokova E & Govardovskii VI (2003). The identity of metarhodopsin III. Vis Neurosci 20, 249–265. [DOI] [PubMed] [Google Scholar]
- Liang Y, Fotiadis D, Maeda T, Maeda A, Modzelewska A, Filipek S, Saperstein DA, Engel A & Palczewski K (2004). Rhodopsin signaling and organization in heterozygote rhodopsin knockout mice. J Biol Chem 279, 48189–48196. [DOI] [PMC free article] [PubMed] [Google Scholar]
- Lyubarsky A, Daniele L & Pugh EJ (2004). From candelas to photoisomerizations in the mouse eye by rhodopsin bleaching in situ and the light‐rearing dependence of the major components of the mouse ERG. Vision Res 44, 3235–3251. [DOI] [PubMed] [Google Scholar]
- McKeown AS, Kraft TW & Loop M (2015). Increased visual sensitivity following periods of dim illumination. Invest Ophthalmol Vis Sci 56, 1864–1871. [DOI] [PMC free article] [PubMed] [Google Scholar]
- McKeown AS & Kraft TW (2014). Adaptive potentiation in rod photoreceptors after light exposure. J Gen Physiol 143, 733–743. [DOI] [PMC free article] [PubMed] [Google Scholar]
- Merino D, Duncan JL, Tiruveedhula P & Roorda A (2011). Observation of cone and rod photoreceptors in normal subjects and patients using a new generation adaptive optics scanning laser ophthalmoscope. Biomed Opt Express 2, 2189–2201. [DOI] [PMC free article] [PubMed] [Google Scholar]
- Miyagishima KJ, Cornwall MC & Sampath AP (2009). Metabolic constraints on the recovery of sensitivity after visual pigment bleaching in retinal rods. J Gen Physiol 134, 165–175. [DOI] [PMC free article] [PubMed] [Google Scholar]
- Mukherjee S, King J & Guidry C (2009). Phenotype‐associated changes in retinal pigment epithelial cell expression of insulin‐like growth factor binding proteins. Invest Ophthalmol Vis Sci 50, 5449–5455. [DOI] [PubMed] [Google Scholar]
- Newman E (1993). Inward‐rectifying potassium channels in retinal glial (Müller) cells. J Neurosci 13, 3333–3345. [DOI] [PMC free article] [PubMed] [Google Scholar]
- Nickell S, Park PS, Baumeister W & Palczewski K (2007). Three‐dimensional architecture of murine rod outer segments determined by cryoelectron tomography. J Cell Biol 177, 917–925. [DOI] [PMC free article] [PubMed] [Google Scholar]
- Owsley C, McGwin G, Jackson G, Heimburger D, Piyathilake C, Klein R, White M & Kallies K (2006). Effect of short‐term, high‐dose retinol on dark adaptation in aging and early age‐related maculopathy. Invest Ophthalmol Vis Sci 47, 1310–1318. [DOI] [PubMed] [Google Scholar]
- Palczewski K, Van Hooser J, Garwin G, Chen J, Liou G & Saari J (1999). Kinetics of visual pigment regeneration in excised mouse eyes and in mice with a targeted disruption of the gene encoding interphotoreceptor retinoid‐binding protein or arrestin. Biochemistry 38, 12012–12019. [DOI] [PubMed] [Google Scholar]
- Qtaishat NM, Wiggert B, Pepperberg DR (2005). Interphotoreceptor retinoid‐binding protein (IRBP) promotes the release of all‐trans retinol from the isolated retina following rhodopsin bleaching illumination. Exp Eye Res 81, 455–463. [DOI] [PubMed] [Google Scholar]
- Rajala A, Anderson RE, Ma JX, Lem J, Al‐Ubaidi MR & Rajala RV (2007). G‐protein‐coupled receptor rhodopsin regulates the phosphorylation of retinal insulin receptor. J Biol Chem 282, 9865–9873. [DOI] [PubMed] [Google Scholar]
- Rajala A, Daly RJ, Tanito M, Allen DT, Holt LJ, Lobanova ES, Arshavsky VY & Rajala RV (2009). Growth factor receptor‐bound protein 14 undergoes light‐dependent intracellular translocation in rod photoreceptors: functional role in retinal insulin receptor activation. Biochemistry 48, 5563–5572. [DOI] [PMC free article] [PubMed] [Google Scholar]
- Rajala A, Tanito M, Le YZ, Kahn CR & Rajala RV (2008). Loss of neuroprotective survival signal in mice lacking insulin receptor gene in rod photoreceptor cells. J Biol Chem 283, 19781–19792. [DOI] [PMC free article] [PubMed] [Google Scholar]
- Rajala RV, Tanito M, Neel BG & Rajala A (2010). Enhanced retinal insulin receptor‐activated neuroprotective survival signal in mice lacking the protein‐tyrosine phosphatase‐1B gene. J Biol Chem 285, 8894–8904. [DOI] [PMC free article] [PubMed] [Google Scholar]
- Saari J, Teller D, Crabb J & Bredberg L (1985). Properties of an interphotoreceptor retinoid‐binding protein from bovine retina. J Biol Chem 261, 195–201. [PubMed] [Google Scholar]
- Savchenko A, Kraft TW, Molokanova E & Kramer RH (2001). Growth factors regulate phototransduction in retinal rods by modulating cyclic nucleotide‐gated channels through dephosphorylation of a specific tyrosine residue. Proc Natl Acad Sci USA 98, 5880–5885. [DOI] [PMC free article] [PubMed] [Google Scholar]
- Schneider B, Papermaster D, Liou G, Fong S‐L & Bridges C (1986). Electron microscopic immunocytochemistry of interstitiol retinol‐binding protein in vertebrate retinas. Invest Ophthalmol Vis Sci 27, 679–688. [PubMed] [Google Scholar]
- Shaw NS & Noy N (2001). Interphotoreceptor retinoid‐binding protein contains three retinoid binding sites. Exp Eye Res 72, 183–190. [DOI] [PubMed] [Google Scholar]
- Shinde VM, Sizova OS, Lin JH, LaVail MM, Gorbatyuk MS (2012). ER stress in retinal degeneration in S334ter Rho rats. PLoS One 7, e33266. [DOI] [PMC free article] [PubMed] [Google Scholar]
- Szuts E & Harosi F (1991). Solubility of retinoids in water. Arch Biochem Biophys 287, 297–304. [DOI] [PubMed] [Google Scholar]
- Tsina E, Chen C, Koutalos Y, Ala‐Laurila P, Tsacopoulos M, Wiggert B, Crouch RK & Cornwall MC (2004). Physiological and microfluorometric studies of reduction and clearance of retinal in bleached rod photoreceptors. J Gen Physiol 124, 429–443. [DOI] [PMC free article] [PubMed] [Google Scholar]
- Waldbillig R, Fletcher R, Chader G, Rajagopalan S & LeRoith D (1987). Retinal insulin receptors. 2. Characterization and insulin‐induced tyrosine kinase activity in bovine retinal rod outer segments. Exp Eye Res 45, 837–844. [DOI] [PubMed] [Google Scholar]
- Waldbillig R, Pfeffer B, Schoen T, Aldler A, Shen‐Orr Z, Scavo L, LeRoith D & Chader G (1991). Evidence for an insulin‐like growth factor autocrine‐paracrine system in the retinal photoreceptor‐pigment epithelial cell complex. J Neurochem 57, 1522–1533. [DOI] [PubMed] [Google Scholar]
- Weng J, Mata N, Azarian S, Tzekov R, Birch D & Travis G (1999). Insights into the function of rim protein in photoreceptors and etiology of Stargardt's disease from the phenotype in knockout mice. Cell 98, 13–23. [DOI] [PubMed] [Google Scholar]
- Wu Q, Blakely L, Cornwall MC, Crouch RK, Wiggert B & Koutalos Y (2007). Interphotoreceptor retinoid‐binding protein is the physiologically relevant carrier that removes retinol from rod photoreceptor outer segments. Biochemistry 46, 8669–8679. [DOI] [PMC free article] [PubMed] [Google Scholar]
- Zick Y, Spiegel A & Sagi‐Eisenberg R (1987). Insulin‐like growth factor I receptors in retinal rod outer segments. J Biol Chem 262, 10259–10264. [PubMed] [Google Scholar]