

Abstract
Key points
Kainate receptor heteromerization and auxiliary subunits, Neto1 and Neto2, attenuate polyamine ion‐channel block by facilitating blocker permeation.
Relief of polyamine block in GluK2/GluK5 heteromers results from a key proline residue that produces architectural changes in the channel pore α‐helical region.
Auxiliary subunits exert an additive effect to heteromerization, and thus relief of polyamine block is due to a different mechanism.
Our findings have broad implications for work on polyamine block of other cation‐selective ion channels.
Abstract
Channel block and permeation by cytoplasmic polyamines is a common feature of many cation‐selective ion channels. Although the channel block mechanism has been studied extensively, polyamine permeation has been considered less significant as it occurs at extreme positive membrane potentials. Here, we show that kainate receptor (KAR) heteromerization and association with auxiliary proteins, Neto1 and Neto2, attenuate polyamine block by enhancing blocker permeation. Consequently, polyamine permeation and unblock occur at more negative and physiologically relevant membrane potentials. In GluK2/GluK5 heteromers, enhanced permeation is due to a single proline residue in GluK5 that alters the dynamics of the α‐helical region of the selectivity filter. The effect of auxiliary proteins is additive, and therefore the structural basis of polyamine permeation and unblock is through a different mechanism. As native receptors are thought to assemble as heteromers in complex with auxiliary proteins, our data identify an unappreciated impact of polyamine permeation in shaping the signalling properties of neuronal KARs and point to a structural mechanism that may be shared amongst other cation‐selective ion channels.
Key points
Kainate receptor heteromerization and auxiliary subunits, Neto1 and Neto2, attenuate polyamine ion‐channel block by facilitating blocker permeation.
Relief of polyamine block in GluK2/GluK5 heteromers results from a key proline residue that produces architectural changes in the channel pore α‐helical region.
Auxiliary subunits exert an additive effect to heteromerization, and thus relief of polyamine block is due to a different mechanism.
Our findings have broad implications for work on polyamine block of other cation‐selective ion channels.
Abbreviations
- iGluR
ionotropic glutamate receptor
- KAR
kainate receptor
- l‐Glu
l‐glutamate
- MD
molecular dynamics
- POPC
1‐palmitoyl‐2‐oleoyl‐sn‐glycero‐3‐phosphocholine
- Put
putrescine
- RMSD
root mean square deviation
- SMD
steered molecular dynamics
- Spm
spermine
- Spd
spermidine
Introduction
Polyamines are expressed ubiquitously in bacterial, plant and animal cells where they fulfil a variety of roles essential for life (Tabor & Tabor, 1964, 1985). Mammals possess two polyamines, the tetra‐ and tri‐amines, spermine (Spm) and spermidine (Spd), respectively, that are derived from the diamine precursor, putrescine (Put), through tightly regulated biosynthetic pathways. Disruption in the synthesis or catabolism of polyamines leads to a variety of disease states from cancer to neurodevelopmental disorders (Nowotarski et al. 2013; Pegg, 2014), underlining their physiological importance. Given their cationic nature, polyamines interact with negatively charged domains of biomolecules (Tabor & Tabor, 1984) including the electrostatic pore regions of voltage‐ and ligand‐gated ion channels where they bind and consequently block ion flow with micromolar affinity (Lopatin et al. 1994; Bowie & Mayer, 1995; Gomez & Hellstrand, 1995; Haghighi & Cooper, 1998; Lu & Ding, 1999; Kerschbaum et al. 2003; Fu et al. 2012). In this capacity, cytoplasmic polyamines are recognized as important determinants of neuronal signalling by regulating action potential firing rates (Fleidervish et al. 2008) as well as the strength of neurotransmission (Rozov & Burnashev, 1999; Aizenman et al. 2002).
Polyamines are often referred to as permeant channel blockers due to their ability to both block and traverse the ion‐permeation pathway of cation‐selective ion channels (Bowie et al. 1999). For almost all ion channels, cytoplasmic polyamine block is observed at negative and physiologically relevant membrane potentials, making it an ideal regulator of cellular excitability (Nichols & Lopatin, 1997; Bowie et al. 1999; Lu, 2004; Baronas & Kurata, 2014). In contrast, polyamine permeation occurs at extreme (>+50 mV) positive membrane potentials (Bahring et al. 1997) and therefore has not been considered particularly significant. Given this arrangement, however, the fraction of channels blocked by polyamines at any given membrane potential is the sum of these two opposing mechanisms. Consequently, the overall level of polyamine block could, in principle, be shaped by any mechanism that enhances the relative contribution of polyamine permeation.
At glutamatergic synapses of the developing and mature CNS, polyamines have been well characterized to act as permeant channel blockers of both AMPA‐ and kainate‐type (KARs) ionotropic glutamate receptors (iGluRs) (Bowie & Mayer, 1995; Kamboj et al. 1995; Koh et al. 1995). In each case, the degree of polyamine block is voltage‐dependent and dynamically regulated, with two of the most prevalent mechanisms occurring through either changes in receptor subunit composition or by receptor association with auxiliary proteins (Cull‐Candy et al. 2006; Perrais et al. 2010; Jackson & Nicoll, 2011). At KARs, polyamine block is attenuated by either the formation of heteromers that contain the GluK4 or GluK5 subunit (Barberis et al. 2008) or by co‐assembly with auxiliary proteins, Neto1 and Neto2 (Fisher & Mott, 2012). Interestingly, removal of the positively charged Arg–Lys–Lys motif of the Neto1 or Neto2 C‐tail restores polyamine block, suggesting that relief of block may involve a charge screening mechanism that affects the pore (Fisher & Mott, 2012). Whether a similar electrostatic mechanism explains the attenuation of block at GluK2/GluK5 heteromers remains to be established.
Here, we have tested the hypothesis that KAR heteromers and auxiliary proteins attenuate channel block by a common mechanism. We show that in both cases relief of polyamine block results from an enhanced rate of polyamine permeation. Relief of block in heteromers is due to a proline residue from GluK5 that is predicted to alter the pore architecture, thereby facilitating polyamine permeation. The effect of auxiliary proteins is additive to that of the pore‐forming subunits and we therefore conclude that they enhance polyamine permeation through a different mechanism. As native receptors primarily assemble as heteromers in complex with auxiliary proteins, our data identify an unappreciated impact of polyamine permeation in shaping the signalling properties of KARs in neuronal circuits.
Methods
Plasmids and molecular biology
All experiments were performed using cDNA of rat GluK2 and GluK5 kainate‐type iGluRs, mouse Neto1‐HA and rat Neto2. For electrophysiology, GluK2a(V,C,Q) and GluK5 cDNA each contained a downstream internal ribosome entry site (IRES) sequence encoding mCherry and eGFP, respectively, which were used to identify transfected cells. cDNA of GluK2(G615P) and GluK5(P599G) were made using site‐directed mutagenesis with all constructs verified by restriction digest analysis and sequencing.
Cell culture and transfection
HEK293T/17 cells (ATCC, Manassas, VA, USA) were maintained in minimal essential medium (MEM) containing glutaMAX© supplemented with 10% fetal bovine serum (Invitrogen, Carlsbad, CA, USA). Cells were plated at low density (1.6–2.0×10⁴ cells ml−1) on poly‐d‐lysine‐coated 35 mm plastic dishes and were transiently transfected 24 h later using the calcium phosphate technique. A GluK2:GluK5 or GluK2:Neto1/2 cDNA molar ratio of 1:10 was used for all co‐transfections.
Electrophysiological recordings
Experiments were performed 36–48 h after transfection. Agonist solutions were rapidly applied to outside‐out patches excised from transfected cells using a piezoelectric stack (Physik Instrumente, Auburn, MA, USA). Solution exchange (10–90% rise time of 250–350 μs) was determined in a separate experiment by measuring the liquid junction current. All recordings were performed using an Axopatch 200B (Molecular Devices, Sunnyvale, CA, USA) using thick‐walled borosilicate glass pipettes (3–6 MΩ) coated with dental wax to reduce electrical noise. Current records were filtered at 5 kHz, digitized at 25 kHz and series resistance (3–12 MΩ) was compensated for by 95%. Recordings were performed at a range of holding potentials from −100 to +100 mV to study polyamine channel block. Data acquisition was performed using pClamp9 or pClamp10 software (Molecular Devices) and tabulated using Excel. All experiments were performed at room temperature.
All chemicals were purchased from Sigma‐Aldrich (St Louis, MO, USA) unless otherwise indicated. External solutions contained (in mm) 150 NaCl, 5 HEPES, 0.1 MgCl2 and 0.1 CaCl2, pH 7.3–7.4. The internal solution contained (in mm) 115 NaCl, 10 NaF, 5 HEPES, 5 Na4BAPTA (Life Technologies, Invitrogen, Burlington, ON, Canada), 1 MgCl2, 0.5 CaCl2 and 10 Na2ATP, pH 7.3–7.4. The osmotic pressure of all solutions was adjusted to 295–300 mOsm with sucrose. In experiments where polyamine block was examined, Na2ATP in the internal solution was replaced with 60 μm Spm and the osmotic pressure adjusted to 295–300 mOsm with sucrose. For Ca2+ permeability experiments, the external solution contained (in mm) 105 NaCl, 30 CaCl2, 5 HEPES and 0.1 MgCl2, pH 7.3–7.4 (295 mOsm). For polyamine permeability experiments, the NaCl in the external solution was replaced by 90 mm Spm, pH was adjusted to 7.3–7.4 using the Spm free base and the osmotic pressure was adjusted with sucrose. Concentrated (10× or 100×) agonist stock solutions were prepared by dissolving agonist [l‐glutamate or AMPA (Tocris, Ellisville, MO, USA)] in the appropriate external solution, adjusting the pH to 7.3–7.4, and stored frozen at −20°C. Stocks were thawed on the day of the experiment and used to prepare agonist‐containing external solutions. For heteromeric GluK2/GluK5 receptors, only patches where the contribution of the slowest exponential component (%A3) was above 25% were considered for analysis, unless otherwise stated.
Data analysis and fitting
Agonist‐evoked membrane conductance (G) was calculated using eqn (1):
| (1) |
where I is the current at V holding potential and V rev is the reversal potential.
Conductance–voltage (G–V) relationships were fit using Origin 7 (OriginLab, Northampton, MA, USA) with the following equation (from Bowie et al. 1998):
| (2) |
where G max is the maximal conductance, [Spm] is the internal Spm concentration and K d is the dissociation constant.
Binding (k on), unbinding (k off) and permeation (k perm) rates were defined as previously (Bowie et al. 1998):
| (3) |
| (4) |
| (5) |
To estimate k off and k perm, K d was first calculated as:
which was redefined to eqn (6):
| (6) |
where
Binding rates were assumed to be constant for GluK2/GluK5, GluK2+Neto1 and GluK2+Neto2 (see Results for more details), and the values for a and b were taken from Bowie et al. (1998).
The voltage‐dependent conductance of KARs under basal conditions is appreciably different between receptor types within the range ±100 mV. This emphasizes the impact of auxiliary proteins in changing the basic gating properties of KARs and the importance of accounting for these significant differences in gating properties. The intrinsic G/V relationships were fit with eqn (7) using Origin 7:
| (7) |
where G 0 is the minimal conductance and V is the membrane potential. Values are summarized in Table 1.
Table 1.
Fit parameters for intrinsic G–V relationships
| G0 | V | |
|---|---|---|
| GluK2 | 1.0699 | 41.4 |
| GluK2/GluK5 | 1.1168 | 55.7 |
| GluK2+Neto1 | 1.0003 | 16.3 |
| GluK2+Neto2 | 1.0094 | 25.5 |
| GluK2/GluK5(P599G) | 1.0240 | 38.4 |
| GluK2(G615P) | 1.0163 | 31.7 |
| GluK2 – 300 μm | 1.0736 | 37.6 |
| GluK2/GluK5 – 300 μm | 1.1282 | 60.0 |
The Ca2+ permeability relative to Na+ (P Ca /P Na) was determined using the constant field equation from Kamboj et al. (1995):
| (8) |
where P Ca and P Na are the permeability coefficients for Ca2+ and Na+, respectively, ΔV rev is the reversal potential shift, F is Faraday's constant, R is the gas constant and T is the temperature in Kelvin.
Relative Spm permeability (P Spm /P Na) was calculated from the reversal potential (V rev) measurements in Spm‐rich external solutions using the following equation from Bahring et al. (1997):
| (9) |
where Ix is the current carried by ion X at a membrane potential V m, Px is the corresponding permeability (P Na = 1), [X]i and [X]o are the internal and external Spm concentrations, z is the valence, and F, R and T are as above. Experimentally determined reversal potentials were used for V m. We obtained P Spm/P Na using the definition that I Na + I Spm = 0 at the reversal potential. The reversal potentials were corrected for liquid junction potentials that were determined experimentally.
All data were illustrated using Origin 7 and Adobe Illustrator.
Statistics
Statistical analysis was performed using the statistical software SPSS Statistics. Data were assumed to be distributed normally. The numbers provided for ‘n’ refer to the number of individual patches.
Molecular dynamics simulations
Molecular dynamics (MD) simulations were performed to study whether inserting proline residues into the α‐helical region of the P‐loop had an effect on the pore architecture. No atomic‐resolution open‐channel structure of an iGluR has been determined, so an open‐channel structure of the non‐selective NaK cation channel from Bacillus cereus determined to a resolution of 1.6 Å was used as a model system (PDB #3E86) (Alam & Jiang, 2009 a). Figure 7 below shows a structural alignment of the GluA2 (PDB #3KG2) and the NaK (PDB #3E86) channel pores. Given that they have very similar topologies, the NaK pore structure was used as this structure has the selectivity filter resolved at atomic resolution and is described as being in the open state as opposed to the GluA2 structure which is considered closed and where the selectivity filter region is unresolved.
Figure 7. The NaK structure is similar to the GluA2 structure .
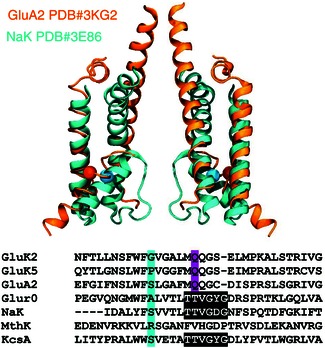
The inverted structure of the open NaK channel (PDB #3E86, cyan) is overlaid with that of the closed GluA2 (PDB #3KG2, orange), illustrating that the two channels share a similar architecture. The proline position is indicated by a sphere. Only two chains are shown and for GluA2, only transmembrane helices M1–3 are included. The two structures are aligned using M2, Cα atoms of residues 573–586 in GluA2 and of residues 50–63 in the NaK channel. The position equivalent to the proline in GluK5 is highlighted by showing the Cα atom of this residue with a sphere (Ser580 in GluA2, Ser57 in NaK). A sequence alignment is shown, highlighting the Gly and Pro residues in GluK2 and GluK5, respectively, which correspond to an Ser in NaK.
To generate a membrane slab for further simulation, the tetrameric physiological unit of the NaK channel (residues 23–113, ignoring ions and other small molecules) was converted to Coarse Grain (CG) representation (Martini v2.1) (Monticelli et al. 2008) to allow for self‐assembly and equilibration of a bilayer consisting of 200 1‐palmitoyl‐2‐oleoyl‐sn‐glycero‐3‐phosphocholine (POPC) molecules around the protein structure. This system was simulated for 100 ns at 323 K in Gromacs v4.6.3 (Hess et al. 2008) to allow formation of a POPC bilayer (Stansfeld et al. 2015).
Following this, the system was converted back to atomistic representation using a CG2AT‐align method (Stansfeld & Sansom, 2011) and this membrane slab was then used for further system setup with the different protein mutants aligned to the position of the protein. The (4S)‐2‐methyl‐2,4‐pentanediol molecule, observed in the crystal structure, was deleted. The crystal structure has four ions bound in the filter region: one calcium ion in the external site, one sodium ion in the vestibule site, one caesium ion in site 3 and another sodium ion in site 4. To keep the ion composition simple, the calcium ion and the caesium ion were changed to potassium and sodium, respectively. Both monovalent and divalent cations can bind at the external site, but sodium does not appear to be a good binder at this site (Alam & Jiang, 2009 b), and thus the calcium ion was exchanged for potassium. The vestibular site and sites 3 and 4 all appear to prefer sodium, so the caesium ion in site 3 was exchanged for sodium. Crystallographic water molecules were retained. The protein along with ions and protein‐bound water molecules was inserted into the pre‐generated POPC membrane slab, and water molecules for solvation were further added using the Solvate Plugin of VMD (Humphrey et al. 1996). Ions were added with the Autoionize Plugin in VMD to create a neutral system with an approximate ion concentration of 150 mm. The anion was chloride and because the NaK channel transports both sodium and potassium, approximately half of the cations were sodium and the other half potassium.
The system was then energy minimized for 5000 steps and equilibrated for 10 ns with protein heavy atoms along with ions bound to the filter harmonically restrained with a force constant of 7 kcal mol–1 Å–2. Lipid molecules which, after 10 ns, were still stuck in odd positions between protein helices, resulting from the self‐assembly process, were deleted and the system was energy minimized for 5000 steps and 500 ns of unbiased MD simulation was performed. This structure (with the oddly positioned lipid molecules removed) was further used for construction of the mutant systems using the Mutator Plugin of VMD. These systems were likewise energy minimized for 5000 steps followed by 500 ns of unbiased MD simulation. In addition to the NaK crystal structure (WT, mimicking the GluK2 homotetramer), we simulated the NaK structure with S57P in two opposing chains (A and C in 2Pro, mimicking the GluK2/GluK2 heteromer if assuming a 2:2 assembly with GluK2–GluK5–GluK2–GluK5 packing at the membrane level) and the NaK structure with the S57P mutation imposed in all four chains [4Pro, mimicking the GluK2(G615P) homotetramer]. Each 500 ns simulation was repeated, so the final data set consisted of 2×500 ns for each of the protein constructs.
All atomistic simulations were performed with NAMD v2.9 (Phillips et al. 2005) using the CHARMM 36 force field (Klauda et al. 2010; Best et al. 2012) for protein and lipids and the TIP3P water model (Jorgensen et al. 1983). Simulations were performed in the NPT ensemble at a temperature of 310 K and a pressure of 1 atm. Langevin dynamics with a damping coefficient of 0.5 ps−1 was employed to control the temperature. The pressure was maintained using the Langevin piston Nosé–Hoover method with a piston period of 100 fs and a damping timescale of 50 fs. Lennard–Jones interactions were treated with a cutoff of 12 Å and the switching function applied from 10 Å, while full electrostatics were accounted for using Particle‐Mesh Ewald (PME) (Darden et al. 1993) summation with a real‐space cutoff of 12 Å and a 1 Å grid spacing. The pairlist, with a cutoff of 14 Å, was updated every 20 fs. Periodic boundary conditions were applied in all simulations. The time step was 2 fs with full electrostatics calculated every second step. Water molecules were kept rigid by the SETTLE (Miyamoto & Kollman, 1992) algorithm and other bonds to hydrogen atoms by the SHAKE (Ryckaert et al. 1977) algorithm. Snapshots were collected every 5 ps.
Polyamine ligands
The structures for Spm, Spd and Put were downloaded from the HIC‐Up database (Kleywegt & Jones, 1998) (‘ideal coordinates’, http://xray.bmc.uu.se/hicup/XXX/ where XXX = SPM, SPD, PUT), and hydrogen atoms were added in Maestro (Maestro, version 9.7, Schrödinger, LLC, New York, 2014). All amine nitrogen atoms were treated as charged. Ligand topologies and parameters for the CHARMM General Force Field (CGenFF) (Vanommeslaeghe et al. 2010; Yu et al. 2012) v3.0.1 were generated using the CGenFF program v1.0.0 (Vanommeslaeghe & MacKerell, 2012; Vanommeslaeghe et al. 2012) (https://cgenff.paramchem.org).
NaK–polyamine complexes
The most symmetrical and the most asymmetrical snapshot in terms of cross‐pore distance (see Fig. 6 D below) was taken from each of the simulations of WT, 2Pro and 4Pro, leaving out the first 100 ns of simulation. Spm was inserted into the filter region by aligning the charged nitrogen atoms of Spm with the original position of the four cations in the filter. These four ions were then deleted to remove overlap and ensure charge neutrality, and furthermore water molecules in the filter overlapping with Spm were deleted. Spd and Put were inserted to the filter region of WT snapshots in a similar way, although due to the smaller number of nitrogen atoms in these ligands, central carbon atoms were used along with the nitrogen atoms in the alignment to original ion positions. For Spd, three of the original cations in the filter were deleted, and for Put, only two. No other ions were binding to the filter region in any of the complexes. The simulation systems were then energy minimized for 2000 steps followed by 30 ns of unbiased MD simulation.
Figure 6. Prolines in GluK5 pore are predicted to alter pore dimensions .

A, sequence alignment of the kainate receptor subunits. A proline is present in the secondary subunits where a conserved glycine is present in primary subunits. This residue is located within a region with a predicted α‐helical structure of the P‐loop. B, crystal structure of the NaK channel (PDB#3E86). Proline residues were mutated in the equivalent α‐helical structure of subunits A and C (yellow spheres). C, side view of the A/C (cyan) and B/D (orange) subunits of the inverted NaK pore before (grey) and after (coloured) 257 ns simulations. D, cross‐pore distance measurements (see black spheres in C) were measured for 500 ns (two repeats for each condition).
All polyamines remained bound to the filter region throughout the 30 ns of relaxation. To probe the energetics involved in the unbinding of the polyamines from the filter, 15 ns of steered MD (SMD) simulations were performed on all NaK–polyamine complexes, starting after 30 ns of unbiased simulation. The SMD atoms, here the terminal nitrogen atom facing the pulling direction, were harmonically constrained with force constant of 7.2 kcal mol–1 Å–2, corresponding to 500 pN Å–1, to move with velocity 2.5 Å ns–1 in the negative direction along the z‐axis (towards the extracellular side for the NaK channel, corresponding to the intracellular side for the KAR channel). Forces were saved every 200 fs. To avoid the whole system being pulled along z, the Cα atoms of residues 23–28 were restrained harmonically with a force constant of 7.2 kcal mol–1 Å–2.
The work was calculated from the force profiles by numerical integration according to:
| (10) |
where v is the constant velocity (2.5 Å ns–1), f(t) is the force at the specific time step given in the SMD output and dt is the time step between the data points (200 fs).
Results
Heteromerization and auxiliary proteins attenuate inward rectification of KARs
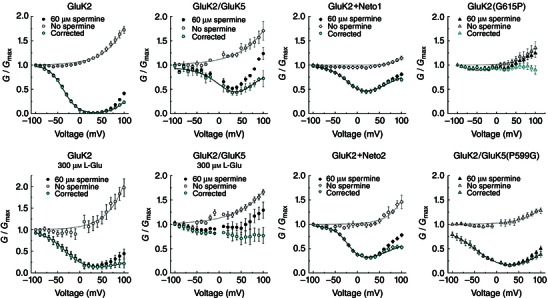
To better understand how heteromerization and auxiliary proteins attenuate channel block, we studied KAR responses in outside‐out membrane patches at a range of membrane potentials to observe when polyamines enter the pore to block it. To mimic the time course of neurotransmitter release in the synaptic cleft, 1 mm l‐glutamate (l‐Glu) was applied to excised patches for 1 ms and 60 μm Spm was included in the internal solution to match known cytoplasmic levels of the blocker (Bowie & Mayer, 1995). Figure 1 summarizes these experiments, where the degree of inward rectification induced by polyamine block of GluK2 homomers was compared to that of GluK2/GluK5 heteromers or GluK2 homomers co‐assembled with the auxiliary proteins, Neto1 and Neto2.
Figure 1. Heteromerization and auxiliary proteins reduce inward rectification of KARs .

A, C, E, F, typical membrane currents evoked by 1 mm l‐Glu (1 ms application) at various holding potentials (−100 to +100 mV, 20 mV increments) in the presence of 60 μm internal Spm. Patch numbers: GluK2, 120403p1; GluK2/GluK5, 120417p3; GluK2+Neto1, 130506p3; and GluK2+Neto2, 131104p3. B, D, G, average I–V plots for GluK2 (n = 5), GluK2/GluK5 (n = 4), GluK2+Neto1 (n = 12) and GluK2+Neto2 (n = 7). Data are presented as mean ± SEM. Current values are normalized to the current at −100 mV. H, to obtain the rectification ratio, the peak current at +80 mV was divided by that at −80 mV. Rectification ratios for individual patches are shown as empty circles; columns represent the mean and error bars indicate SEM. One‐way ANOVA, F 3,24 = 60.819, P = 2.32E‐11, post hoc Tukey HSD pairwise comparisons: ****P < 1.33E‐8; n.s., not significant.
In agreement with other studies, peak GluK2 receptor responses exhibited a bi‐rectifying behaviour (range: −100 to + 100 mV) due to the onset and relief of block at hyperpolarizing and depolarizing membrane potentials, respectively (Fig. 1 A and B) (Bowie & Mayer, 1995; Bowie et al. 1998). In contrast, I–V plots of GluK2/GluK5 heteromers (Fig. 1 C and D) or GluK2 with Neto1 or Neto2 (Fig. 1 E–G) (Barberis et al. 2008; Fisher & Mott, 2012) tended towards linearity. Rectification ratios were smallest for GluK2 homomers (0.20 ± 0.02, n = 5), highlighting that Spm channel block strongly opposes ion flow at positive membrane potentials (Fig. 1 A, B and H). This effect was much weaker with GluK2/GluK5 heteromers (rectification ratio = 0.89 ± 0.07, n = 4) and following co‐assembly with auxiliary proteins (Neto1, 0.66 ± 0.02, n = 12; Neto2, 0.64 ± 0.03, n = 7) (Fig. 1 H), reaffirming that, in each case, polyamine block is significantly attenuated. Despite the similarity of the effects, it still remains to be established if heteromerization and auxiliary proteins attenuate block by a similar or different mechanism.
To better understand the voltage‐dependency of the onset and relief of block, we converted the I–V data from each dataset into G–V plots (Fig. 2). KARs exhibit significant outward rectification at positive membrane potentials in the absence of channel blockers (Bowie et al. 1998). To take this into account, we performed additional experiments to obtain control I–V data for all receptor combinations and then subtracted this non‐linearity from data obtained in the presence of Spm (Figs 2 and 3). Corrected G–V plots were then fit with a single binding site model of channel block (Bowie et al. 1998) (see Methods) to estimate the equilibrium dissociation constant of Spm at 0 mV (K d(0mV)) as well as the voltage‐dependency of the onset and relief of block (h and k, respectively; Table 2).
Figure 2. Association of GluK2 with GluK5 or auxiliary proteins reduces polyamine block by increasing permeation rates .

A, conductance–voltage (G–V) plots for GluK2/GluK5 in the presence (black circles) and absence (white circles) of 60 μm internal Spm. Cyan circles represent the corrected G–V (n = 4), obtained by dividing the Spm G–V by the fit of the Spm‐free G–V. B, corrected G–V plot for GluK2 (n = 5). C, rates of onset, unbinding and permeation for GluK2 (see Methods). k on was estimated using values from Bowie et al. (1998). D, corrected G–V plots for GluK2+Neto1 (cyan, n = 12) and GluK2+Neto2 (orange, n = 7). All data are represented as the mean ± SEM. G–V plots were fit with eqn (2). E and F, comparison of the estimated unbinding (k off, E) and permeation (k perm, F) rates for GluK2 (1), GluK2/GluK5 (2), GluK2+Neto1 (3) and GluK2+Neto2 (4).
Figure 3. G–V corrections for intrinsic outward rectification in the absence of internal polyamines .
G–V relationships in the absence (white symbols) or presence (black symbols) of internal polyamines were plotted. The corrected G–V relationships (cyan symbols) were obtained by dividing the value of the spermine G–V by the non‐spermine G–V (G corr = G Spm/G noSpm). Note the importance of performing this correction for each receptor type, as the intrinsic outward rectification properties differ.
Table 2.
Spermine affinities of kainate receptors
| Receptor | Mean | SEM | n | |
|---|---|---|---|---|
| GluK2 | K d (0 mV) (μm) | 5.8 | 0.3 | 5 |
| h (mV) | −16.0 | 0.5 | ||
| k (mV) | 20.4 | 1.0 | ||
| GluK2/GluK5 | K d (0 mV) (μm) | 119 | 30 | 5 |
| h (mV) | −25.9 | 3.8 | ||
| k (mV) | 69.7 | 36.0 | ||
| GluK2+Neto1 | K d (0 mV) (μm) | 71 | 13 | 6 |
| h (mV) | −24.0 | 1.8 | ||
| k (mV) | 43.3 | 4.3 | ||
| GluK2+Neto2 | K d (0 mV) (μm) | 39 | 2 | 7 |
| h (mV) | −18.5 | 1.1 | ||
| k (mV) | 48.6 | 5.3 | ||
| GluK2/GluK5(P599G) | K d (0 mV) (μm) | 19 | 2 | 4 |
| h (mV) | −32.3 | 3.8 | ||
| k (mV) | 41.4 | 4.7 | ||
| GluK2 (300 μm l‐Glu) | K d (0 mV) (μm) | 21 | 6 | 3 |
| h (mV) | −24.2 | 1.9 | ||
| k (mV) | 56.2 | 14.1 | ||
| GluK2/GluK5 | K d (0 mV) (μm) | 170 | 33 | 3 |
| (300 μm l‐Glu) | h (mV) | −51.4 | 20.0 | |
| k (mV) | 107.7 | 47.2 | ||
| GluK2/GluK5 | K d (0 mV) (μm) | 81 | 40 | 3 |
| (1 mm AMPA) | h (mV) | −73.4 | 27.7 | |
| k (mV) | 56.8 | 22.9 |
Affinities were obtained using responses evoked by 1 ms applications of 1 mm l‐Glu in 150 mm NaCl external solution. Values for ‘h’ and ‘k’ indicate the voltage dependency.
In agreement with previous work (Bowie et al. 1998), the K d(0mV) of Spm for GluK2 homomers was estimated to be 5.8 ± 0.3 μm, with voltage‐dependencies of the onset and relief of block of −16 ± 0.5 and +20.4 ± 1.0 mV per e‐fold change in membrane potential, respectively (Table 2). In comparison, KAR heteromerization and association with auxiliary proteins affected both Spm binding and the voltage‐dependency of block. Fits of corrected G–V plots estimated the K d(0mV) of Spm to be 39 ± 2, 71 ± 13 and 119 ± 30 μm for GluK2+Neto2, GluK2+Neto1 and GluK2/GluK5 channels, respectively (Table 2), representing a 6‐ to 20‐fold reduction in blocker affinity. Interestingly, heteromerization and auxiliary protein association mainly affected the voltage‐dependency of the relief of block (i.e. k), which was about 2‐ to 3‐fold weaker compared to that of GluK2 homomers (Table 2). For example, fits of corrected G–V plots estimated the voltage‐dependency of relief for GluK2/GluK5 heteromers to be +69.7 mV per e‐fold change in membrane potential compared to +20.4 mV for GluK2 homomers. In keeping with this, selective activation of GluK2/GluK5 heteromers with either 1 mm AMPA (Herb et al. 1992) or 300 μm l‐Glu (Barberis et al. 2008) estimated K d(0 mV) to be 81 ± 40 and 170 ± 33 μm, respectively, with the voltage‐dependency of relief corresponding to +56.8 and +107.7 mV per e‐fold change in membrane potential, respectively (Table 2). In contrast, the differences between the voltage‐dependency of onset of block (i.e. h) were more modest (Table 2), and the binding rates for Spm (k on, Fig. 2 C) were assumed to be constant. The unbinding (k off) and permeation rates (k perm) were estimated using previous estimates of k on (Fig. 2 C) (Bowie et al. 1998). Plots of unbinding (k off) and permeation (k perm) for Spm at GluK2 homomers predict that relief of block occurs only at extreme membrane potentials (i.e. > +50 mV), where the rates for k perm become dominant (Fig. 2 C). In contrast, similar plots of k off (Fig. 2 E) and k perm (Fig. 2 F) with GluK2/GluK5 heteromers, GluK2+Neto1 or GluK2+Neto2 (Fig. 2 E and F) reveal that there are substantial shifts in estimates of unbinding and permeation rates that account for the overall attenuation in channel block. Specifically, there is a substantial hyperpolarizing shift in k perm so that Spm permeation is expected to be appreciable even at membrane potentials of −50 mV (Fig. 2 F).
Given the specific nature of these effects, we reasoned that the attenuation of polyamine channel block by heteromerization or association with auxiliary proteins occurs because Spm permeation rates are enhanced under these conditions. To test this experimentally, we performed bi‐ionic reversal potential experiments to determine the extent to which KAR composition affected polyamine permeation rates.
Heteromerization and auxiliary proteins relieve channel block by facilitating polyamine permeation
To determine the permeability of Spm relative to that of Na+ (P Spm/P Na), we measured the reversal potential of KAR responses in solutions where the main external permeant cation was either 150 mm Na+ or 90 mm Spm. In all cases, the main permeant cation of the internal solution was 150 mm Na+ (Fig. 4 and see Methods).
Figure 4. Spermine permeability is increased in GluK2/GluK5 and GluK2+Neto2 .

Electrophysiological traces of GluK2 (A and B, patch 130730p2), GluK2/GluK5 (D and E, patches 121122p1 and 131206p2) and GluK2+Neto2 (G and H, patches 131017p3 and 140410p9) evoked by 1 mm l‐Glu (250 ms) at various holding potentials (−100 to +100 mV, 40 mV increments) in 150 mm NaCl external solution (left) or 90 mm Spm external solution (right). Insets show the current traces at −100 mV in 90 mm Spm. I–V plots in 90 mm external Spm for GluK2 (C, n = 4), GluK2/GluK5 (F, n = 3) and GluK2+Neto2 (I, n = 5). Arrows represent the reversal potentials for GluK2/GluK5 (V rev = −43.2 mV) and GluK2+Neto2 (V rev = −33.6 mV). Insets show the I–V plots ranging from −100 to +100 mV. Grey lines are the fits of the same receptor in the presence of 150 mm external NaCl. Data are represented as means ± SEM. Current values (both Na+ and Spm currents) are normalized to the Na+ current at −100 mV in the same patch.
As expected, responses mediated by GluK2 (V rev = −0.2 ± 1.5 mV, Fig. 4 A and C, inset), GluK2/GluK5 (V rev = −0.5 ± 0.8 mV, Fig. 4 D and F, inset) and GluK2+Neto2 (V rev = −0.7 ± 0.8 mV, Fig. 4 G and I, inset) in symmetrical 150 mm Na+ solutions reversed close to 0 mV, demonstrating that Na+ ions are equally permeable from both sides of the plasma membrane. In contrast, reversal potentials determined with external 90 mm Spm as the main permeant cation were dependent upon the KAR composition. With GluK2 homomers, we failed to observe a reliable inward current in 90 mm external Spm and therefore were unable to estimate P Spm/P Na (Fig. 4 B and C), an observation similar to a previous study of polyamine permeation (Bahring et al. 1997). In keeping with this, preliminary experiments suggested that polyamines with fewer charged groups, namely Put (z = +2) and Spd (z = +3), were more permeant than Spm (z = +4). Reversal potentials with 90 mm external Put or Spd as the main permeant cation were −8.0 ± 2.7 mV (n = 2) and −34.4 ± 1.6 mV (n = 3), respectively, estimating P Put/P Na to be 0.23 ± 0.02 and P Spd/P Na to be 0.049 ± 0.002 for GluK2 homomers. This indicates that permeant channel blockers with smaller valencies have a greater tendency to permeate through the KAR channel, in agreement with prior work (Bahring et al. 1997; Cui et al. 1998). In contrast to GluK2 homomers, Spm‐mediated inward currents were observed with both GluK2/GluK5 (Fig. 4 E and F) and GluK2+Neto2 (Fig. 4 H and I), with reversal potentials of −43.2 ± 1.2 mV (n = 3) and −33.6 ± 4.5 mV (n = 4), respectively. As a result, the calculated P Spm/P Na for GluK2/GluK5 and GluK2+Neto2 receptors were 0.024 ± 0.001 and 0.042 ± 0.009, respectively. Taken together, these data provide evidence that GluK2/GluK5 and GluK2+Neto2 receptors were more permeable to Spm compared to GluK2 homomers.
A reduction in polyamine block is thought to go hand‐in‐hand with Ca2+ permeability in non‐NMDA receptors (Burnashev, 1996). Despite these differences, KAR heteromerization or association with the auxiliary proteins do not attenuate Ca2+ permeability. For example, in Ca2+‐rich external solutions (i.e. 30 mm CaCl2 + 105 mm NaCl), the reversal potential of GluK2 I–V plots was +1.0 ± 0.5 mV (n = 5) which was shifted to a slightly more positive potential of +5.0 ± 1.8 mV (n = 3) with GluK2/GluK5 heteromers (Fig. 5 E and F). As a result, the relative Ca2+ permeabilities (P Ca/P Na) of GluK2 homomers and GluK2/GluK5 heteromers were estimated to be 2.3 and 3.1, respectively. As a previous study has reported similar findings with the auxiliary proteins, Neto1 and Neto2 (Fisher & Mott, 2012), we concluded that differences in the pore properties of KARs induced by heteromerization or auxiliary proteins could not be revealed by studying divalent permeability; we therefore focused on polyamine block. Thus, KARs essentially behave as molecular sieves (Burnashev, 1996; Bahring et al. 1997) such that the movement of bulky permeating ions (i.e. Spm) is hindered in the permeation pathway while that of much smaller divalent cations, such as Ca2+ ions, is not. As explained below, we performed MD simulations to better understand this distinction by looking at how the pore region of KARs might be affected by modest changes in the ion‐permeation pathway.
Figure 5. Ca2+ permeability is similar for GluK2 and GluK2/GluK5 kainate receptors .
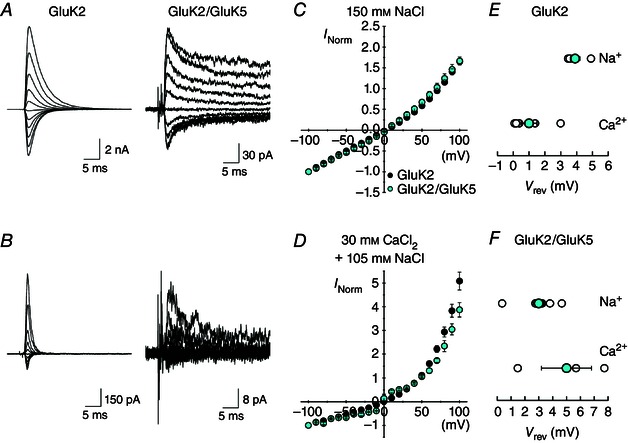
A, example membrane currents for GluK2 (left, patch 120507p1) and GluK2/GluK5 (right, patch 120522p2) evoked by 1 ms l‐Glu applications (1 mm, in 150 mm NaCl) at various holding potentials (−100 to +100 mV, 20 mV increments) in the absence of internal polyamines. B, example membrane currents for GluK2 (left, same patch as in A) and GluK2/GluK5 (right, same patch as in A) evoked by 1 ms l‐Glu applications (1 mm, in 30 mm CaCl2) at various holding potentials (−100 to +100 mV, 20 mV increments) in the absence of internal polyamines. C, I–V relationships for GluK2 (black, n = 4) and GluK2/GluK5 (cyan, n = 8) in 150 mm NaCl external solution. D, I–V relationships for GluK2 (black, n = 5) and GluK2/GluK5 (cyan, n = 3) in 30 mm CaCl2 external solution. Current values are normalized to the current at −100 mV. E and F, reversal potentials in 150 mm NaCl and 30 mm CaCl2 external solutions for GluK2 (E) and GluK2/GluK5 (F). All data are represented as mean ± SEM.
MD simulations predict a structural change in the channel pore
Sequence alignment of all KAR subunits was performed to identify differences between the GluK2 and GluK2/GluK5 receptors (Fig. 6 A). The most striking difference was found in the α‐helical region of the re‐entrant loop (P‐loop; Fig. 6 A) where a glycine residue (i.e. GluK2 Gly615) is found in all primary subunits (GluK1‐3) while a proline residue is found in the equivalent position (i.e. GluK5 Pro599) of secondary subunits (GluK4 and GluK5), which do not form functional homomers. As each residue is located within a predicted α‐helical region of the re‐entrant P‐loop of KARs (Panchenko et al. 1999) (Fig. 6 A), we reasoned that the Gly and Pro may exert differential effects on channel block and permeation. Specifically, we hypothesized that the Pro of the GluK5 subunit would result in structural changes in the heteromeric KAR pore regions, as has been proposed for Pro residues in other α‐helical regions of ion‐channels, such as the S6 helix of Shaker (Bright et al. 2002) and the M2 helix of KcsA K+ channels (Fowler & Sansom, 2013).
To explore this, MD simulations were used to study how the introduction of the Pro residue may affect the pore structure and its dynamics (Fig. 6 B–D). As a high‐resolution structure of the KAR pore region is not yet available, we performed MD simulations using the structure of the Bacillus cereus NaK channel pore [PDB 3E86 (Alam & Jiang, 2009 a), 1.6 Å resolution] as it has been used successfully to provide insight into the NMDA‐type iGluR (Siegler Retchless et al. 2012). This structure has 4‐fold symmetry, as expected for the GluK2 tetramer (Wilding et al. 2014) and furthermore illustrates an open conformation (Fig. 6 B and C). Although the iGluR pore structure has been compared to the KcsA structure (Sobolevsky et al. 2009), it also shares remarkable structural similarities with the NaK channel pore (Fig. 7). Moreover, because the NaK channel is a non‐selective cation channel, its pore properties are expected to be closer to that of the iGluR. For these reasons, the NaK structure was used as a model of the pore in our MD simulations. To simulate a heteromer having a 2:2 stoichiometry, as is the case for GluK2/GluK5 KARs (Reiner et al. 2012), prolines were introduced into the equivalent α‐helical positions of the NaK structure on opposing subunits (i.e. A and C), in agreement with prior work on KAR heteromers (Kumar et al. 2011).
Changes in cross‐pore distances between the centre of mass of the α‐carbons of residues 50–53 in opposing subunits are summarized in Fig. 6 D. As expected, the A/C and B/D cross‐pore distances in the wild‐type (WT) NaK pore quickly reached equilibrium and remained fairly constant for the rest of the 500 ns simulation (Fig. 6 D and supplementary Movies S1 and S2), consistent with a 4‐fold symmetrical pore arrangement. In contrast, the pore adopted a 2‐fold symmetry with prolines on opposing subunits (Fig. 6 D and Movies S1 and S2). For example, the mean distance between helices A/C increased by approximately 1 Å, while the distance between WT helices (B/D) decreased reciprocally (Fig. 6 D and Movies S1 and S2). Interestingly, the two simulation repeats with prolines introduced in all four helices illustrated two different outcomes (Fig. 6 D, 4Pro). In one case, helices adopted a 4‐fold symmetry but with larger separation than the WT (Fig. 6 D, Run 1); in the second case, they adopted a 2‐fold symmetry (Fig. 6 D, Run 2). Thus, despite the trajectories showing two different effects of proline insertions, they probably reflect the same result, namely that the Pro residue induces a more stochastic behaviour of the P‐loop compared to the WT pore conformation.
To better understand how the Pro residues affect the dynamics of the NaK α‐helical P‐loop, we examined the root mean square deviation (RMSD) of each helix in comparison to the reference structure (Fig. 8; PDB #3E86). Interestingly, the mean RMSD of Pro‐containing helices in all simulations was about 0.5 Å, a 2‐fold increase compared to the RMSD of WT helices (Fig. 8), indicating that they are able to move further away compared to their WT counterparts. Moreover, the RMSD fluctuation in the Pro‐containing helices was much greater than in WT helices, spanning almost 0.2 Å, while the WT fluctuations spanned less than 0.1 Å (Fig. 8). Given this, we hypothesized that increased dynamics in the P‐loop α‐helices may be responsible for the enhanced polyamine permeation rates observed experimentally.
Figure 8. RMSD is larger in helices containing prolines .

The RMSD values calculated for the Cα atoms of the P‐loop helix (residues 50–62) of each chain of the NaK channel over the course of the 500 ns simulation. The alignment and RMSD calculation were performed for one chain at a time, aligning by residues 50–62 of the given helix for which the RMSD is calculated. WT helices are shown in black/grey, helices from the 2Pro simulation in red/orange and those of the 4Pro simulation in blue/cyan.
MD simulations predict increased polyamine permeation
To test whether Pro‐induced changes in the position of the helices could facilitate blocker permeation, we compared the work required to pull pore‐bound polyamines to the extracellular side of WT and mutant NaK pore regions, corresponding to the intracellular side in KARs (Fig. 9). Polyamines were also pulled to the intracellular side of the NaK pore, but the results from these experiments were inconclusive. From each of the WT trajectories in Fig. 6 D, the most symmetrical and the most asymmetrical snapshot (in terms of the cross‐pore distance) was found and used as a starting structure, giving rise to a total of four different protein structures. Three polyamines of different structure and charge (Put, Spd and Spm) were modelled into the filter by overlaying with the original cations bound in the filter of the NaK structure (Fig. 9 A) (Alam & Jiang, 2009 a). After 30 ns of relaxation, all polyamines were still bound to the filter region. To probe the strength with which the polyamines bind to the filter, SMD simulations were subsequently performed. In the SMD simulations, polyamines were pulled out of the filter along the z‐axis toward the intracellular side of the membrane (Movie S3). Each SMD simulation produced a force profile from which the work involved in the process was calculated (Fig. 9 B). The eight snapshots shown in Fig. 10 correspond to time steps at which the force peaks, each denoted in Fig. 9 B by an asterisk, along with snapshots before and near the end of the SMD simulation. From the SMD simulations with different polyamines, a clear trend in the work values was observed (Fig. 9 C and Movie S3), suggesting that, in the WT pore, it is easier for the smaller polyamines (Put and Spd) to pass through from the filter than Spm, in agreement with our data and that of others (Bahring et al. 1997). Similar SMD simulations were performed with Spm inserted into the most symmetrical or the most asymmetrical snapshots from the 2Pro and 4Pro trajectories from Fig. 6 D. As before, all Spm molecules were still bound to the filter region in the 12 different systems (4×WT, 4×2Pro, 4×4Pro) after 30 ns of relaxation. The calculated work values for pulling Spm to the solvent were lower for the 2Pro and 4Pro mutants than for the WT pore (Fig. 9 D). Thus, this model system suggests that the Pro residue in the α‐helical region of the GluK5 P‐loop may be enough to disturb Spm binding and ensure higher permeation and unblock in the GluK2/GluK5 heteromers.
Figure 9. Proline in the M2 helix controls spermine block and permeation .
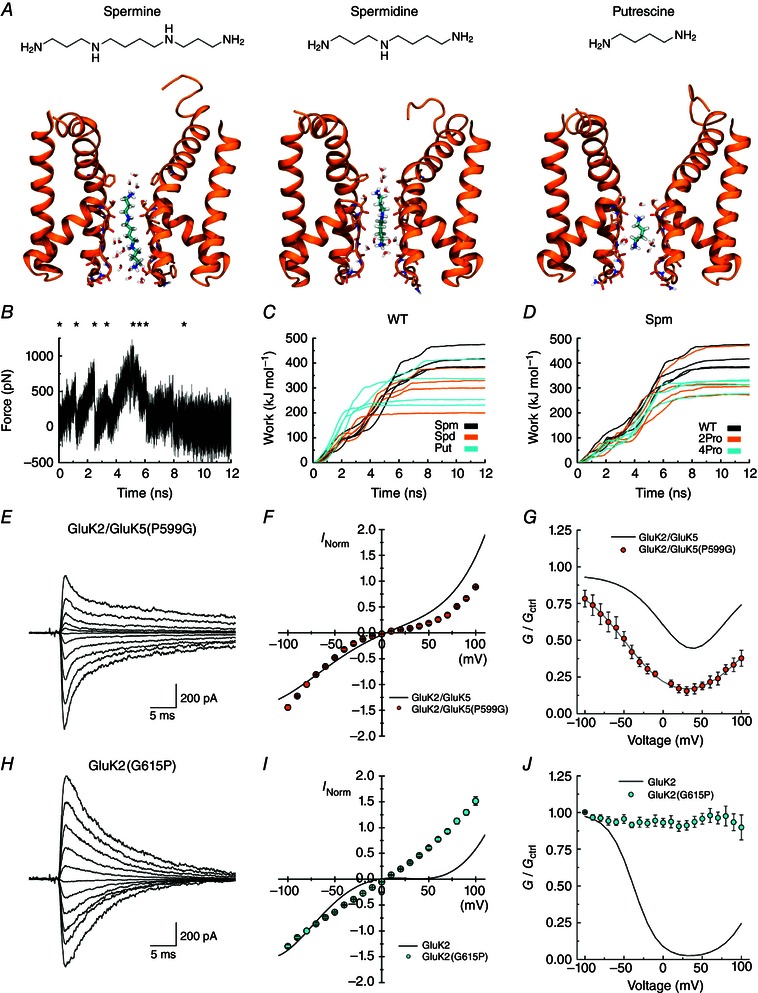
A, each of the three polyamines binding in the NaK filter region, from left to right: spermine (Spm), spermidine (Spd), putrescine (Put). For simplicity, only chains A and C of the protein are included and non‐polar hydrogen atoms of the protein are omitted. Carbon atoms of the ligands are shown in cyan. B, an example of a force profile illustrating the force added when pulling Spm out of the WT filter towards the intracellular side. C, work profiles for pulling the three different polyamines to the intracellular side in the WT protein. Spm results are shown in black, Spd in orange and Put in cyan. The work involved in Spm release is generally larger than for release of the smaller polyamines. D, work profiles for pulling Spm to the intracellular side for the WT protein (black), the 2Pro mutant (orange) and the 4Pro mutant (cyan). E and H, example responses of GluK2/GluK5(P599G) (E, patch 130610p7) and GluK2(G615P) (H, patch 130606p2) at various holding potentials (−100 to +100 mV, 20 mV increments) in the presence of 60 μm internal spermine. Average I–V plots (F, I) and corrected G–V plots (G, J) for these receptors in the presence of internal spermine. Relationships for GluK2 and GluK2/GluK5 (grey lines in G and J) are shown for comparison. Data are represented as mean ± SEM. Current values are normalized to the current at −100 mV.
Figure 10. Snapshots illustrating the interactions as Spm is pulled toward the intracellular side of the membrane .
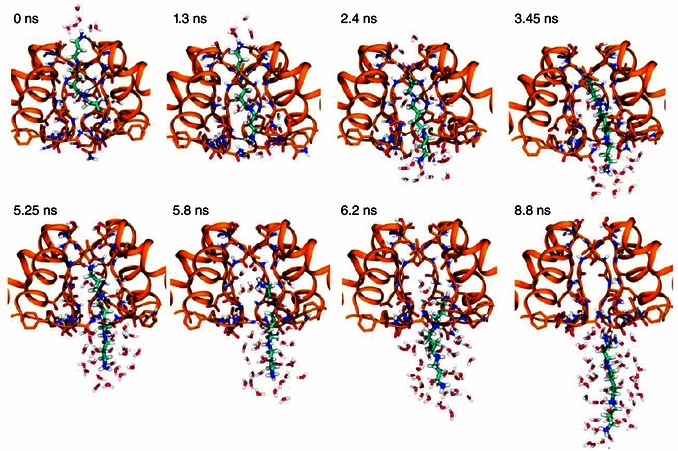
Snapshots corresponding to the asterisks in Fig. 9 B. Spermine is shown with cyan carbon atoms. Hydrogen bonds between spermine and the protein [dist(H–O) < 2.5 Å] are indicated with black lines.
Pro599 in the GluK5 pore is the main determinant of polyamine block
To assess whether GluK5 Pro599 is responsible for enhanced polyamine permeation, we measured the degree of channel block after substituting it with a Gly residue, as is found in GluK2 (Fig. 9 E–G). As anticipated, the degree of inward rectification of GluK2/GluK5(P599G) channels was significantly more pronounced than observed with WT heteromers (Fig. 9 F). This finding demonstrates that Pro599 is a critical determinant of polyamine block. Fits of the corrected G–V plot estimated the K d(0mV) of GluK2/GluK5(P599G) receptors to be 19 ± 2 μm, which was 4–5 fold more potent than WT heteromers with a K d(0mV) of 119 ± 30 μm (Fig. 9 G and Table 2). Interestingly, the K d(0mV) of Spm for GluK2/GluK5 (P599G) was statistically indistinguishable from GluK2 homomers [one‐way ANOVA, F 7,28 = 8.506, P = 0.000014; post hoc Tukey honest significant difference (HSD) pairwise comparison, P = 1.000; Table 2], indicating that the removal of Pro599 from GluK2/GluK5 heteromers enhances channel block. As a result, the differences between the G–V plots of GluK2 (Fig. 2 B) and mutant heteromers (Fig. 9 G) are found in the voltage‐dependency of block (Table 2).
To test if the reverse substitution would render GluK2 receptors polyamine‐insensitive, Gly615 was replaced with a Pro residue, as is found in GluK5 (Fig. 9 H–J). In contrast to WT GluK2, the I–V plot for GluK2(G615P) in the presence of 60 μm internal Spm was almost entirely linear, demonstrating that the introduction of Pro615 in the pore region of GluK2 eliminates polyamine block (Fig. 9 I). In agreement with this, the corrected GluK2(G615P) G–V plot lacked voltage‐dependency (Fig. 9 J), further underlining that this Pro residue is the principal determinant of Spm block in GluK2/GluK5 heteromers.
Auxiliary proteins and GluK5 relieve polyamine block by distinct mechanisms
To test whether auxiliary proteins relieve KAR channel block by a similar or different mechanism, we took advantage of the fact that GluK2(G615P) channels are unaffected by Spm block (Fig. 9 H–J). We reasoned that if auxiliary subunits attenuate Spm block by a different mechanism, their co‐expression with GluK2(G615P) would increase the relative Spm permeability of the channel complex. Conversely, if they attenuate Spm block by a similar mechanism, the ability of Spm to permeate GluK2(G615P) channels would remain unchanged by co‐expression with an auxiliary subunit.
In contrast to WT GluK2 (Fig. 11 A and D), Spm‐mediated inward currents were readily observed at negative membrane potentials with GluK2(G615P) (Fig. 11 B and E). The reversal potential of GluK2(G615P) with 90 mm external Spm was −25.5 ± 2.4 mV (n = 5) (Fig. 11 B and E), estimating the P Spm/P Na to be 0.062 ± 0.008 (Fig. 11 G), similar to GluK2/GluK5 and GluK2+Neto2 (Fig. 11 G).
Figure 11. G615P mutation and Neto2 association increase spermine permeation of GluK2 .

Example responses of GluK2 (A, same data as in Fig. 3, GluK2(G615P) (B, patch 130906p2) and GluK2(G615P)+Neto2 (C, patch 140814p4) in 90 mm external Spm, at various holding potentials (−100 to +100 mV, 40 mV increments). Insets show the response in 90 mm external Spm at −100 mV. Average I–V plot for GluK2 (D, same data as in Fig. 3), GluK2(G615P) (E, n = 5) and GluK2(G615P)+Neto2 (F, n = 4) in 90 mm external Spm; arrows indicate reversal potentials for GluK2(G615P) (V rev = −25.5 mV) and GluK2(G615P)+Neto2 (V rev = −15.6 mV). Insets show the I–V plots ranging from −100 to +100 mV. Grey lines are the fits of the same receptor in the presence of 150 mm external NaCl. Data are represented as means and SEM. Current values (both Na+ and Spm currents) are normalized to the Na+ current at −100 mV in the same patch. G, left: summary plot showing the V rev (in 90 mm Spm) for the various receptors tested. Right: summary plot showing the calculated relative Spm permeabilities (P Spm/P Na). One‐way ANOVA, F 3,12 = 9.801, P = 0.002; post hoc Tukey HSD pairwise comparisons: *P = 0.027 and **P = 0.005 and 0.002 for G615P+Neto2–GluK2+Neto2 and G5615P+Neto2–GluK2/GluK5 comparisons, respectively.
Interestingly, the magnitude of Spm‐induced inward currents in patches containing GluK2(G615P) channels co‐expressed with Neto2 was increased by about 2‐fold (Fig. 11 C and F). For example, the Spm‐mediated current at −100 mV was 8 ± 5% (n = 5) of the Na+‐mediated current with GluK2(G615P) and 19 ± 12% (n = 7) with GluK2(G615P)+Neto2. In addition, the reversal potential observed with 90 mm external Spm was more positive for GluK2(G615P)+Neto2 than GluK2(G615P) alone (V rev = −15.6 ± 2.3 mV; n = 4), estimating P Spm/P Na to be 0.12 ± 0.02 (Fig. 11 G). One‐way ANOVA performed on the relative Spm permeability revealed that P Spm/P Na for GluK2(G615P)+Neto2 was significantly larger than for GluK2(G615P), GluK2+Neto2 and GluK2/GluK5 (Fig. 11, see figure legend for P values). These results indicate that co‐expression of KARs with Neto2 increases blocker permeation in an additive manner, suggesting that it is acting through a mechanism that is distinct from that of the Pro residues in GluK5 subunits.
Discussion
The present study advances our understanding of polyamine block of KARs in several fundamental ways. First, we report that heteromerization and auxiliary proteins unexpectedly attenuate channel block by enhancing polyamine permeation rates. Second, MD simulations suggest that relief of block is due to a structural change in the α‐helical region of the KAR pore, which is distinct from the charge‐screening mechanism ascribed to GluA2‐containing AMPARs. Our data identify that each of two GluK5 subunits in the GluK2/GluK5 heteromer possesses a critical proline residue that is predicted to push the helices outward, leading to a 2‐fold symmetrical pore arrangement and increased pore helix fluctuation. Third and finally, heteromerization and auxiliary proteins relieve polyamine block by a distinct pathway. Consequently, Neto1 and Neto2 do not attenuate polyamine block by channelling their effect through the proline residue of GluK5 subunits.
The dynamic nature of polyamine block
Our study reveals that subunit composition affects the functional properties of KARs differently than AMPARs. In AMPARs, the Q/R site of the GluA2 subunit is >99% edited to an Arg but remains unedited in all other subunits (Sommer et al. 1991). This distinction is significant because it generates the two major AMPAR classes that are either GluA2‐containing, polyamine‐insensitive and divalent cation‐impermeable or GluA2‐lacking, polyamine‐sensitive and divalent cation‐permeable (Cull‐Candy et al. 2006) (but see Bowie, 2012). Importantly, polyamine‐insensitivity of GluA2‐containing AMPARs is thought to be due to the electrostatic effect of Arg at the Q/R site of GluA2, which repels polyamines in the narrowest region of the pore (Bowie et al. 1999). However, this reliance on the editing state of the Q/R site is not thought to be as important for KAR heteromers because it is edited only 40% in GluK1 subunits with a range of estimates for GluK2 from <5 to 75% in the developing and adult rodent brain (Sommer et al. 1991; Puchalski et al. 1994; Schmitt et al. 1996). It has yet to be tested whether the Q/R site of other KAR subunits (i.e. GluK3‐5) is edited or not. Our data demonstrate that GluK2/GluK5 heteromers attenuate polyamine block not by electrostatic repulsion but rather through a novel mechanism involving a structural change in the pore helices. Accordingly, the binding affinity for polyamines in the pore is reduced, enhancing their permeation rates. This is achieved through the distinctive cyclical structure of the proline side chain that is conformationally rigid and lacks the N–H hydrogen bond donor, and thus can uniquely distort α‐helical structures. As proline residues are found exclusively in GluK4–5 subunits and are absent from GluK1–3 subunits, we predict that heteromers containing either GluK4 or GluK5 will exhibit a diminished level of polyamine block even if the Q/R site of all four subunits is unedited, as is the case in this study. This arrangement is distinct from AMPARs where the coupling of polyamine block and divalent cation permeability is governed by a common structural determinant, namely the Q/R site. As different structural domains govern polyamine block and Ca2+ permeability in KAR heteromers, native receptors will exhibit appreciable Ca2+ permeability that is unconstrained by significant voltage‐dependent modifications in membrane conductance due to polyamine block.
Prolines in the KAR pore α‐helices promote altered pore dynamics
MD simulations are consistent with a mechanism in which proline residues are arranged on opposing subunits of the NaK tetramer, resulting in a 2‐fold symmetrical pore arrangement that alters the pore dynamics. In keeping with this, recent studies have shown that GluK2/GluK5 heteromers have a subunit copy number of 2:2 (Reiner et al. 2012). Interestingly, prolines are found in many transmembrane α‐helices of transport proteins and ion channels, as is the case in the present study, but are uncommon in water‐soluble helices (Brandl & Deber, 1986; Barlow & Thornton, 1988; Tieleman et al. 2001). They are most frequently located on the hydrophilic side of the helix (Woolfson & Williams, 1990), where they destabilize the helix and tend to produce hinges, kinks or swivels (Cordes et al. 2002). Given these observations, we hypothesized that the proline found in the re‐entrant P‐loop of the GluK5 subunit might result in a similar structural rearrangement in the KAR channel pore, as has been proposed for the S6 α‐helix in Shaker (Bright et al. 2002) and the M2 helix in KcsA potassium channels (Fowler & Sansom, 2013). In the latter case, the introduction of prolines in the M2 helices predicted the formation of kinks and helical rearrangement after only 10 ns of MD simulation, with the pore helices adopting 2‐fold symmetry instead of 4‐fold symmetry (Fowler & Sansom, 2013). Similarly, the introduction of prolines in the P‐loop of the NaK channel pore, which was used in the present study as a model of the KAR channel pore, resulted in small changes in the position of the outer region of the helices. Accordingly, our data suggest that reduced channel block and enhanced polyamine permeation rates occur through an increased structural flexibility of the pore α‐helices due to proline residues that bring about an asymmetrical re‐arrangement and enlargement of the KAR channel pore.
Auxiliary proteins and polyamine block
Auxiliary proteins of AMPARs and KARs are not pore‐forming components of the channel (Chen et al. 2000; Tomita et al. 2003; Zhang et al. 2009) and therefore it has been unclear how they cause attenuation of polyamine channel block. The proximal end of the C‐terminal region of the TARP, γ‐2 or stargazin, has been shown to attenuate polyamine block of AMPARs through a mechanism that involves a direct interaction with the intracellular domain of GluA1 or GluA4 subunits (Soto et al. 2014). A similar finding has been reported with Neto2, where positive residues in the proximal intracellular C‐terminal domain are implicated in reducing polyamine block (Fisher & Mott, 2012). Although it is still unclear how these residues affect inward rectification of GluK2 channels, we found that the auxiliary protein achieves this by increasing the blocker permeation, which seems at odds with the charge screening hypothesis. Our data demonstrate that Neto1 and Neto2 exert a structural effect on the channel pore that is distinct from that seen in GluK2/GluK5 heteromers. Exactly how auxiliary proteins achieve this remains to be investigated. However, given the similarity between the effect of auxiliary proteins on KARs and AMPARs, we predict that TARPs and cornichons are likely to attenuate polyamine block of AMPARs by the same mechanism, i.e. by increasing polyamine permeation.
Additional information
Competing interests
The authors declare no competing financial interests.
Author Contributions
P.M.G.E.B. designed and performed experiments, analysed data and wrote the paper; M.R.P.A. designed experiments and wrote the paper; M.M. designed and performed experiments, analysed data and wrote the paper; P.C.B. and D.B. designed experiments and wrote the paper. All authors have approved the final version of the manuscript, agree to be accountable for all aspects of the work and qualify for authorship.
Supporting information
Movie S1. MD simulation of the NaK channel with 2 Pro substitutions. This movie illustrates the MD simulation of the 2Pro mutant of the NaK channel over 500 ns. Ser57 was substituted with a Pro residue in opposing subunits A and C, and the Cα of the inserted Pro is shown as a yellow sphere. The NaK structure is inverted so that the orientation of the helices matches that of the kainate receptor. The four subunits of the tetramer are shown as pairs of opposing subunits. The A and C subunits are on the left (cyan) and the B and D subunits are on the right (orange). The original protein structure is shown in white; the selectivity filter is highlighted in magenta. The Pro‐containing α‐helices (cyan, including the selectivity filter) tend to move outward, while the WT helices (orange) tend to move inward.
Movie S2. MD simulation of the NaK with 2 Pro substitutions, intracellular view. This movie illustrates the same MD simulation as in Movie S1, viewed from the intracellular side. The Pro‐containing helices (cyan) seem to bend back, pulling the selectivity filter (magenta) away from the original crystal structure (white). In contrast, the selectivity filter for the WT helices tends to move slightly closer, causing a more asymmetrical arrangement of the filter, which in turn may affect polyamine permeation.
Movie S3. SMD simulation pulling pore‐bound polyamines to the intracellular side. This movie illustrates the binding (from left to right) of Spm, Spd and Put to the WT NaK pore region simulated for 30 ns of relaxation before being pulled to the intracellular side. Ligands are illustrated with cyan carbon atoms and for clarity only chains A and C are shown. Protein residues in the filter are shown with licorice representation along with other protein residues and water molecules within 4 Å of the ligands.
Acknowledgements
This work was supported by operating grants from the Canadian Institutes of Health Research (to D.B.), the Leverhulme Trust RPG‐059 (P.C.B and M.M.) and the Medical Research Council (MR/M0004331, P.C.B). P.M.G.E.B. was supported by a graduate student fellowship from the Fonds de Recherche en Santé du Québec and M.R.P.A. was supported by a Banting and Best graduate fellowship from the CIHR. D.B. is the recipient of a Canada Research Chair. M.M. was supported by a postdoctoral fellowship from the Alfred Benzon Foundation. This work made use of the facilities of ARCHER (www.archer.ac.uk) granted via the UK High‐End Computing Consortium for Biomolecular Simulation, HECBioSim (hecbiosim.ac.uk, grant no. EP/L000253/1) and HECToR, the UK's national high‐performance computing service, funded by the Office of Science and Technology through EPSRC's High End Computing Programme. We also acknowledge the use of the IRIDIS High Performance Computing Facility, Advanced Research Computing, Oxford, the National Service for Computational Chemistry Software and the Blue Joule facility at the Hartree Centre. We thank R. McInnes for the Neto1‐HA plasmid and J. R. Howe for the Neto2 plasmid. We wish to thank members of the Bowie lab for insightful discussion of the manuscript.
M.M. and M.R.P.A. contributed equally and are arranged alphabetically.
References
- Aizenman CD, Munoz‐Elias G & Cline HT (2002). Visually driven modulation of glutamatergic synaptic transmission is mediated by the regulation of intracellular polyamines. Neuron 34, 623–634. [DOI] [PubMed] [Google Scholar]
- Alam A & Jiang Y (2009. a). High‐resolution structure of the open NaK channel. Nat Struct Mol Biol 16, 30–34. [DOI] [PMC free article] [PubMed] [Google Scholar]
- Alam A & Jiang Y (2009. b). Structural analysis of ion selectivity in the NaK channel. Nat Struct Mol Biol 16, 35–41. [DOI] [PMC free article] [PubMed] [Google Scholar]
- Bahring R, Bowie D, Benveniste M & Mayer ML (1997). Permeation and block of rat GluR6 glutamate receptor channels by internal and external polyamines. J Physiol 502, 575–589. [DOI] [PMC free article] [PubMed] [Google Scholar]
- Barberis A, Sachidhanandam S & Mulle C (2008). GluR6/KA2 kainate receptors mediate slow‐deactivating currents. J Neurosci 28, 6402–6406. [DOI] [PMC free article] [PubMed] [Google Scholar]
- Barlow DJ & Thornton JM (1988). Helix geometry in proteins. J Mol Biol 201, 601–619. [DOI] [PubMed] [Google Scholar]
- Baronas VA & Kurata HT (2014). Inward rectifiers and their regulation by endogenous polyamines. Front Physiol 5, 325. [DOI] [PMC free article] [PubMed] [Google Scholar]
- Best RB, Zhu X, Shim J, Lopes PE, Mittal J, Feig M & Mackerell AD, Jr (2012). Optimization of the additive CHARMM all‐atom protein force field targeting improved sampling of the backbone φ, ψ and side‐chain χ(1) and χ(2) dihedral angles. J Chem Theory Comput 8, 3257–3273. [DOI] [PMC free article] [PubMed] [Google Scholar]
- Bowie D (2012). Redefining the classification of AMPA‐selective ionotropic glutamate receptors. J Physiol 590, 49–61. [DOI] [PMC free article] [PubMed] [Google Scholar]
- Bowie D, Bahring R & Mayer ML (1999). Block of AMPA and kainate receptors by polyamines and arthropod toxins In Handbook of Experimental Pharmacology, Ionotropic Glutamate Receptors in the CNS, ed. Jonas P. & Monyer H, pp. 251–373. Springer, Berlin. [Google Scholar]
- Bowie D, Lange GD & Mayer ML (1998). Activity‐dependent modulation of glutamate receptors by polyamines. J Neurosci 18, 8175–8185. [DOI] [PMC free article] [PubMed] [Google Scholar]
- Bowie D & Mayer ML (1995). Inward rectification of both AMPA and kainate subtype glutamate receptors generated by polyamine‐mediated ion channel block. Neuron 15, 453–462. [DOI] [PubMed] [Google Scholar]
- Brandl CJ & Deber CM (1986). Hypothesis about the function of membrane‐buried proline residues in transport proteins. Proc Natl Acad Sci USA 83, 917–921. [DOI] [PMC free article] [PubMed] [Google Scholar]
- Bright JN, Shrivastava IH, Cordes FS & Sansom MS (2002). Conformational dynamics of helix S6 from Shaker potassium channel: simulation studies. Biopolymers 64, 303–313. [DOI] [PubMed] [Google Scholar]
- Burnashev N (1996). Calcium permeability of glutamate‐gated channels in the central nervous system. Curr Opin Neurobiol 6, 311–317. [DOI] [PubMed] [Google Scholar]
- Chen L, Chetkovich DM, Petralia RS, Sweeney NT, Kawasaki Y, Wenthold RJ, Bredt DS & Nicoll RA (2000). Stargazin regulates synaptic targeting of AMPA receptors by two distinct mechanisms. Nature 408, 936–943. [DOI] [PubMed] [Google Scholar]
- Cordes FS, Bright JN & Sansom MSP (2002). Proline‐induced distortions of transmembrane helices. J Mol Biol 323, 951–960. [DOI] [PubMed] [Google Scholar]
- Cui C, Bahring R & Mayer ML (1998). The role of hydrophobic interactions in binding of polyamines to non NMDA receptor ion channels. Neuropharmacology 37, 1381–1391. [DOI] [PubMed] [Google Scholar]
- Cull‐Candy S, Kelly L & Farrant M (2006). Regulation of Ca2+‐permeable AMPA receptors: synaptic plasticity and beyond. Curr Opin Neurobiol 16, 288–297. [DOI] [PubMed] [Google Scholar]
- Darden T, York D & Pedersen L (1993). Particle mesh Ewald: an N⋅log(N) method for Ewald sums in large systems. J Chem Phys 98, 10089–10092. [Google Scholar]
- Fisher JL & Mott DD (2012). The auxiliary subunits Neto1 and Neto2 reduce voltage‐dependent inhibition of recombinant kainate receptors. J Neurosci 32, 12928–12933. [DOI] [PMC free article] [PubMed] [Google Scholar]
- Fleidervish IA, Libman L, Katz E & Gutnick MJ (2008). Endogenous polyamines regulate cortical neuronal excitability by blocking voltage‐gated Na+ channels. Proc Natl Acad Sci USA 105, 18994–18999. [DOI] [PMC free article] [PubMed] [Google Scholar]
- Fowler PW & Sansom MS (2013). The pore of voltage‐gated potassium ion channels is strained when closed. Nat Commun 4, 1872. [DOI] [PMC free article] [PubMed] [Google Scholar]
- Fu LY, Cummins TR & Moczydlowski EG (2012). Sensitivity of cloned muscle, heart and neuronal voltage‐gated sodium channels to block by polyamines: a possible basis for modulation of excitability in vivo . Channels (Austin) 6, 41–49. [DOI] [PMC free article] [PubMed] [Google Scholar]
- Gomez M & Hellstrand P (1995). Effects of polyamines on voltage‐activated calcium channels in guinea‐pig intestinal smooth muscle. Pflugers Arch 430, 501–507. [DOI] [PubMed] [Google Scholar]
- Haghighi AP & Cooper E (1998). Neuronal nicotinic acetylcholine receptors are blocked by intracellular spermine in a voltage‐dependent manner. J Neurosci 18, 4050–4062. [DOI] [PMC free article] [PubMed] [Google Scholar]
- Herb A, Burnashev N, Werner P, Sakmann B, Wisden W & Seeburg PH (1992). The KA‐2 subunit of excitatory amino acid receptors shows widespread expression in brain and forms ion channels with distantly related subunits. Neuron 8, 775–785. [DOI] [PubMed] [Google Scholar]
- Hess B, Kutzner C, van der Spoel D & Lindahl E (2008). GROMACS 4: algorithms for highly efficient, load‐balanced, and scalable molecular simulation. J Chem Theory Comput 4, 435–447. [DOI] [PubMed] [Google Scholar]
- Humphrey W, Dalke A & Schulten K (1996). VMD: visual molecular dynamics. J Mol Graph 14, 33–38. [DOI] [PubMed] [Google Scholar]
- Jackson AC & Nicoll RA (2011). The expanding social network of ionotropic glutamate receptors: TARPs and other transmembrane auxiliary subunits. Neuron 70, 178–199. [DOI] [PMC free article] [PubMed] [Google Scholar]
- Jorgensen WL, Chandrasekhar J, Madura JD, Impey RW & Klein ML (1983). Comparison of simple potential functions for simulating liquid water. J Chem Phys 79, 926–935. [Google Scholar]
- Kamboj SK, Swanson GT & Cull‐Candy SG (1995). Intracellular spermine confers rectification on rat calcium‐permeable AMPA and kainate receptors. J Physiol 486, 297–303. [DOI] [PMC free article] [PubMed] [Google Scholar]
- Kerschbaum HH, Kozak JA & Cahalan MD (2003). Polyvalent cations as permeant probes of MIC and TRPM7 pores. Biophys J 84, 2293–2305. [DOI] [PMC free article] [PubMed] [Google Scholar]
- Klauda JB, Venable RM, Freites JA, O'Connor JW, Tobias DJ, Mondragon‐Ramirez C, Vorobyov I, MacKerell AD, Jr & Pastor RW (2010). Update of the CHARMM all‐atom additive force field for lipids: validation on six lipid types. J Phys Chem B 114, 7830–7843. [DOI] [PMC free article] [PubMed] [Google Scholar]
- Kleywegt GJ & Jones TA (1998). Databases in protein crystallography. Acta Crystallogr D Biol Crystallogr 54, 1119–1131. [DOI] [PubMed] [Google Scholar]
- Koh DS, Burnashev N & Jonas P (1995). Block of native Ca2+‐permeable AMPA receptors in rat brain by intracellular polyamines generates double rectification. J Physiol 486, 305–312. [DOI] [PMC free article] [PubMed] [Google Scholar]
- Kumar J, Schuck P & Mayer ML (2011). Structure and assembly mechanism for heteromeric kainate receptors. Neuron 71, 319–331. [DOI] [PMC free article] [PubMed] [Google Scholar]
- Lopatin AN, Makhina EN & Nichols CG (1994). Potassium channel block by cytoplasmic polyamines as the mechanism of intrinsic rectification. Nature 372, 366–369. [DOI] [PubMed] [Google Scholar]
- Lu Z (2004). Mechanism of rectification in inward‐rectifier K+ channels. Annu Rev Physiol 66, 103–129. [DOI] [PubMed] [Google Scholar]
- Lu Z & Ding L (1999). Blockade of a retinal cGMP‐gated channel by polyamines. J Gen Physiol 113, 35–43. [DOI] [PMC free article] [PubMed] [Google Scholar]
- Miyamoto S & Kollman PA (1992). Settle: an analytical version of the SHAKE and RATTLE algorithm for rigid water models. J Comput Chem 13, 952–962. [Google Scholar]
- Monticelli L, Kandasamy SK, Periole X, Larson RG, Tieleman DP & Marrink S‐J (2008). The MARTINI coarse‐grained force field: extension to proteins. J Chem Theor Comput 4, 819–834. [DOI] [PubMed] [Google Scholar]
- Nichols CG & Lopatin AN (1997). Inward rectifier potassium channels. Annu Rev Physiol 59, 171–191. [DOI] [PubMed] [Google Scholar]
- Nowotarski SL, Woster PM & Casero RA Jr (2013). Polyamines and cancer: implications for chemotherapy and chemoprevention. Expert Rev Mol Med 15, e3. [DOI] [PMC free article] [PubMed] [Google Scholar]
- Panchenko VA, Glasser CR, Partin KM & Mayer ML (1999). Amino acid substitutions in the pore of rat glutamate receptors at sites influencing block by polyamines. J Physiol 520, 337–357. [DOI] [PMC free article] [PubMed] [Google Scholar]
- Pegg AE (2014). The function of spermine. IUBMB Life 66, 8–18. [DOI] [PubMed] [Google Scholar]
- Perrais D, Veran J & Mulle C (2010). Gating and permeation of kainate receptors: differences unveiled. Trends Pharmacol Sci 31, 516–522. [DOI] [PubMed] [Google Scholar]
- Phillips JC, Braun R, Wang W, Gumbart J, Tajkhorshid E, Villa E, Chipot C, Skeel RD, Kale L & Schulten K (2005). Scalable molecular dynamics with NAMD. J Comput Chem 26, 1781–1802. [DOI] [PMC free article] [PubMed] [Google Scholar]
- Puchalski RB, Louis JC, Brose N, Traynelis SF, Egebjerg J, Kukekov V, Wenthold RJ, Rogers SW, Lin F, Moran T, Morrison JH & Heinemann SF (1994). Selective RNA editing and subunit assembly of native glutamate receptors. Neuron 13, 131–147. [DOI] [PubMed] [Google Scholar]
- Reiner A, Arant RJ & Isacoff EY (2012). Assembly stoichiometry of the GluK2/GluK5 kainate receptor complex. Cell Rep 1, 234–240. [DOI] [PMC free article] [PubMed] [Google Scholar]
- Rozov A & Burnashev N (1999). Polyamine‐dependent facilitation of postsynaptic AMPA receptors counteracts paired‐pulse depression. Nature 401, 594–598. [DOI] [PubMed] [Google Scholar]
- Ryckaert J‐P, Ciccotti G & Berendsen HJC (1977). Numerical integration of the cartesian equations of motion of a system with constraints: molecular dynamics of n‐alkanes. J Comput Phys 23, 327–341. [Google Scholar]
- Schmitt J, Dux E, Gissel C & Paschen W (1996). Regional analysis of developmental changes in the extent of GluR6 mRNA editing in rat brain. Brain Res Dev Brain Res 91, 153–157. [DOI] [PubMed] [Google Scholar]
- Siegler Retchless B, Gao W & Johnson JW (2012). A single GluN2 subunit residue controls NMDA receptor channel properties via intersubunit interaction. Nat Neurosci 15, 406–413, S401–402. [DOI] [PMC free article] [PubMed] [Google Scholar]
- Sobolevsky AI, Rosconi MP & Gouaux E (2009). X‐ray structure, symmetry and mechanism of an AMPA‐subtype glutamate receptor. Nature 462, 745–756. [DOI] [PMC free article] [PubMed] [Google Scholar]
- Sommer B, Kohler M, Sprengel R & Seeburg PH (1991). RNA editing in brain controls a determinant of ion flow in glutamate‐gated channels. Cell 67, 11–19. [DOI] [PubMed] [Google Scholar]
- Soto D, Coombs ID, Gratacos‐Batlle E, Farrant M & Cull‐Candy SG (2014). Molecular mechanisms contributing to TARP regulation of channel conductance and polyamine block of calcium‐permeable AMPA receptors. J Neurosci 34, 11673–11683. [DOI] [PMC free article] [PubMed] [Google Scholar]
- Stansfeld PJ, Goose JE, Caffrey M, Carpenter EP, Parker JL, Newstead S & Sansom MS (2015). MemProtMD: automated insertion of membrane protein structures into explicit lipid membranes. Structure 23, 1350–1361. [DOI] [PMC free article] [PubMed] [Google Scholar]
- Stansfeld PJ & Sansom MSP (2011). From coarse grained to atomistic: a serial multiscale approach to membrane protein simulations. J Chem Theor Comput 7, 1157–1166. [DOI] [PubMed] [Google Scholar]
- Tabor CW & Tabor H (1984). Polyamines. Annu Rev Biochem 53, 749–790. [DOI] [PubMed] [Google Scholar]
- Tabor CW & Tabor H (1985). Polyamines in microorganisms. Microbiol Rev 49, 81–99. [DOI] [PMC free article] [PubMed] [Google Scholar]
- Tabor H & Tabor CW (1964). Spermidine, spermine, and related amines. Pharmacol Rev 16, 245–300. [PubMed] [Google Scholar]
- Tieleman DP, Shrivastava IH, Ulmschneider MR & Sansom MS (2001). Proline‐induced hinges in transmembrane helices: possible roles in ion channel gating. Proteins 44, 63–72. [DOI] [PubMed] [Google Scholar]
- Tomita S, Chen L, Kawasaki Y, Petralia RS, Wenthold RJ, Nicoll RA & Bredt DS (2003). Functional studies and distribution define a family of transmembrane AMPA receptor regulatory proteins. J Cell Biol 161, 805–816. [DOI] [PMC free article] [PubMed] [Google Scholar]
- Vanommeslaeghe K, Hatcher E, Acharya C, Kundu S, Zhong S, Shim J, Darian E, Guvench O, Lopes P, Vorobyov I & Mackerell AD, Jr (2010). CHARMM general force field: a force field for drug‐like molecules compatible with the CHARMM all‐atom additive biological force fields. J Comput Chem 31, 671–690. [DOI] [PMC free article] [PubMed] [Google Scholar]
- Vanommeslaeghe K & MacKerell AD (2012). Automation of the CHARMM general force field (CGenFF) I: Bond perception and atom typing. J Chem Inform Model 52, 3144–3154. [DOI] [PMC free article] [PubMed] [Google Scholar]
- Vanommeslaeghe K, Raman EP & MacKerell AD (2012). Automation of the CHARMM general force field (CGenFF) II: Assignment of bonded parameters and partial atomic charges. J Chem Inform Model 52, 3155–3168. [DOI] [PMC free article] [PubMed] [Google Scholar]
- Wilding TJ, Lopez MN & Huettner JE (2014). Radial symmetry in a chimeric glutamate receptor pore. Nat Commun 5, 3349. [DOI] [PMC free article] [PubMed] [Google Scholar]
- Woolfson DN & Williams DH (1990). The influence of proline residues on alpha‐helical structure. FEBS Lett 277, 185–188. [DOI] [PubMed] [Google Scholar]
- Yu W, He X, Vanommeslaeghe K & MacKerell AD (2012). Extension of the CHARMM general force field to sulfonyl‐containing compounds and its utility in biomolecular simulations. J Comput Chem 33, 2451–2468. [DOI] [PMC free article] [PubMed] [Google Scholar]
- Zhang W, St‐Gelais F, Grabner CP, Trinidad JC, Sumioka A, Morimoto‐Tomita M, Kim KS, Straub C, Burlingame AL, Howe JR & Tomita S (2009). A transmembrane accessory subunit that modulates kainate‐type glutamate receptors. Neuron 61, 385–396. [DOI] [PMC free article] [PubMed] [Google Scholar]
Associated Data
This section collects any data citations, data availability statements, or supplementary materials included in this article.
Supplementary Materials
Movie S1. MD simulation of the NaK channel with 2 Pro substitutions. This movie illustrates the MD simulation of the 2Pro mutant of the NaK channel over 500 ns. Ser57 was substituted with a Pro residue in opposing subunits A and C, and the Cα of the inserted Pro is shown as a yellow sphere. The NaK structure is inverted so that the orientation of the helices matches that of the kainate receptor. The four subunits of the tetramer are shown as pairs of opposing subunits. The A and C subunits are on the left (cyan) and the B and D subunits are on the right (orange). The original protein structure is shown in white; the selectivity filter is highlighted in magenta. The Pro‐containing α‐helices (cyan, including the selectivity filter) tend to move outward, while the WT helices (orange) tend to move inward.
Movie S2. MD simulation of the NaK with 2 Pro substitutions, intracellular view. This movie illustrates the same MD simulation as in Movie S1, viewed from the intracellular side. The Pro‐containing helices (cyan) seem to bend back, pulling the selectivity filter (magenta) away from the original crystal structure (white). In contrast, the selectivity filter for the WT helices tends to move slightly closer, causing a more asymmetrical arrangement of the filter, which in turn may affect polyamine permeation.
Movie S3. SMD simulation pulling pore‐bound polyamines to the intracellular side. This movie illustrates the binding (from left to right) of Spm, Spd and Put to the WT NaK pore region simulated for 30 ns of relaxation before being pulled to the intracellular side. Ligands are illustrated with cyan carbon atoms and for clarity only chains A and C are shown. Protein residues in the filter are shown with licorice representation along with other protein residues and water molecules within 4 Å of the ligands.