Abstract
A chemical exchange saturation transfer (CEST) experiment can be performed in an ultrafast fashion if a gradient field is applied simultaneously with the saturation pulse. This approach has been demonstrated for studying dia- and para-magnetic CEST agents, hyperpolarized Xe gas and in vivo spectroscopy. In this study we present a simple method for the simultaneous screening of multiple samples. Furthermore, by interleaving a number of saturation and readout periods within the TR, a series of images with different saturation times can be acquired, allowing for the quantification of exchange rates using the variable saturation time (QUEST) approach in a much accelerated fashion, thus enabling high throughput screening of CEST contrast agents.
Introduction
Chemical exchange saturation transfer (CEST) imaging has become an important MRI contrast mechanism, providing molecular level information with MRI sensitivity. Instead of detecting the MRI signal from biologically relevant molecules directly, CEST imaging detects bulk water magnetization. When the magnetization of the exchangeable protons is saturated by radio frequency (RF) pulses, the magnetization can be transferred to bulk water though chemical exchange, resulting in a reduction of the water signal as a function of the irradiation frequency. The same principle has also been applied in studying hyperpolarized encapsulated 129Xe nuclei indirectly through saturation transfer to free 129Xe (HyperCEST) [1, 2]. To quantify the CEST effect, the bulk water or free Xe signal, respectively, is plotted as a function of saturation frequency offset to generate a so-called Z-spectrum.
When examining different potential CEST contrast agents, it is often necessary to screen a large number of molecules under varying conditions (e.g. pH, temperature, irradiation power and duration) and the requirement for acquiring a full Z-spectrum is very time consuming. Long before the field of CEST emerged, Swanson et al. developed a fast method to study the MT effect [3]. In this approach, a gradient field is applied simultaneously with the saturation pulse. Under the effect of the gradient, the resonance frequency of the spins becomes a function of their spatial location. The saturation frequency is thus encoded in space. We have recently demonstrated that this technique can be used in CEST allowing a Z-spectrum to be acquired in just two scans [4]. Compared with the conventional Z-spectrum acquisition of one frequency per repetition time TR, this method accelerates Z-spectrum acquisition greatly and was therefore named ultrafast Z-spectroscopy (UFZ)[4]. A similar method named gradient-encoded Z-spectroscopy was developed by Döpfert et al. [5] UFZ was also implemented for the acquisition of in vivo spectroscopy [6] and ultrafast HyperCEST Z-spectra [7, 8]. One particular advantage of the UFZ in the context of HyperCEST is that the Z-spectrum becomes less dependent of shot-noise originating, for example, from varying polarization levels in individual experiments.
The acquisition of the CEST Z-spectra of multiple samples simultaneously greatly improves the efficiency of the screening process [9, 10]. By combining the UFZ with imaging techniques, another order of magnitude in speed can be achieved. For instance, Schröder et al have demonstrated that UFZ combined with compressed sensing allows one to obtain highly accelerated multi-sample z-spectrum [10]. The design of such a sampling scheme and the reconstruction method prevents such a technique from being widely used by non-experts. We demonstrate that good quality Z-spectra can be obtained by ultrafast CEST imaging (UCI) using the rapid acquisition with refocused echoes (RARE) method, and thus making it easily available to many potential users.
In additional to chemical shift, the exchange rate affects the setting of optimal saturation parameters, such as saturation time, power, and delays between a train of saturation pulses [11]. For endogenous CEST contrast agents, knowing the exchange rate as well as chemical shift can enable more specific observation of a certain metabolite. For example, strong and relatively short saturation helps to achieve more weighting towards the fast-exchanging amine protons over slow-exchanging amide protons [12]. Similarly for exogenous CEST agents, knowledge regarding the exchange rate is essential in designing the ideal contrast agent [13-15]. Exchange rates can be quantified by acquiring a series of full Z-spectra with different saturation times or saturation powers (QUEST and QUESP methods) [16-18]. A single-shot QUEST series was demonstrated by Boutin et al [7]. The resultant QUEST or QUESP spectra are then fitted with Bloch-McConnell equations to extract the exchange rate. In analogy to the fast Look-Locker T1 measurements, we show that by repetitively interleaving gradient-encoded saturation and an echo planar imaging (EPI) readout, an incremental saturation time is achieved, which subsequently allows for QUEST-type analysis. As a result, both chemical shift and exchange rate information for multiple samples can be revealed in less than one minute.
Methods
The UFZ method applies an encoding gradient simultaneously with a saturation RF pulse irradiating at a certain frequency offset. Therefore the saturation frequency offsets become a function of spatial position along the gradient direction in the sample. Only spins in the position that is on-resonance with the RF saturation experience direct saturation, proton spins in other spatial locations experience off-resonance saturation at a frequency offset that is determined by their distance to the on-resonance slice. The exchangeable species that would undergo chemical exchange at certain frequency offsets would now be exchanging at certain spatial locations instead due to this frequency encoding. Following a readout RF pulse, the exchange profile can then be acquired by another gradient. Similar to the conventional Z-spectrum acquisition, a spectrum without saturation is recorded for normalization to remove the proton density weighting.
Sample preparation
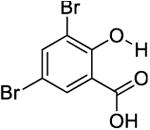
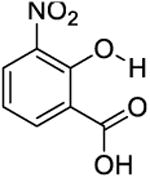
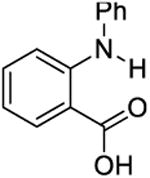
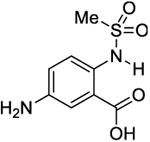
The phantom was made up of eight 5mm (OD) standard NMR tubes arranged in a pattern as shown in Figure 2a for MRI imaging. Each tube contained one of the following compounds: Salicylic acid (1), 3,5-Dibromosalicylic acid (2), 3-Nitrosalicylic acid (3), 2-Cyclohexylamino-benzoic acid (4), 5-amino-2-(methanesulfonamido)-benzoic acid (5), 2-(methylsulfonyl)amino-benzoic acid (6), 4,6-Dihydroxyisophthalic acid (7) and 2,5-Dihydroxyterephthalic acid (8). These compounds were randomly selected from the library of compounds reported in the literature [13, 15]. A 10 mM solution of each compound was prepared in a phosphate buffered saline solution with a pH of 7.3, titrated by highly concentrated HCl/NaOH solutions
Figure 2.
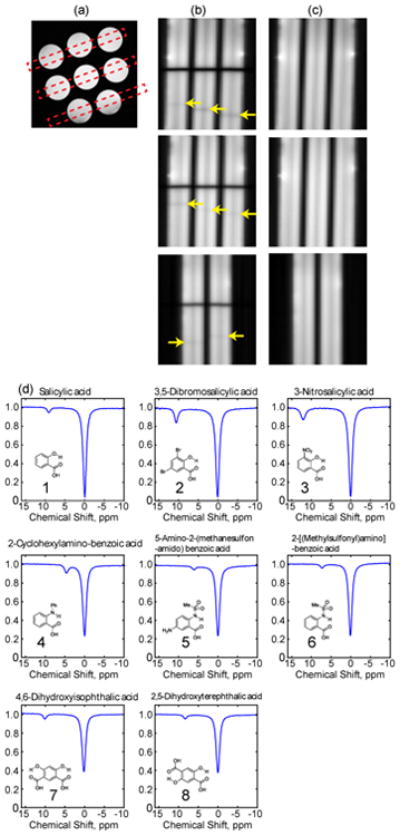
(a), Cross sections of the phantoms assembly showing the 3 imaging slices chosen; (b) and (c), fast Z spectroscopic images with and without saturation, respectively. The yellow arrows in (b) point at the dark bands as a result of chemical exchanges. (d), the normalized Z spectra of each sample in the assembly.
MRI data acquisitions
MRI experiments were performed on a Bruker 17.6 T NMR spectrometer equipped with a Micro 2.5 gradient system. A 20 mm diameter volume coil was employed for RF transmission and reception. An assembly of phantoms, consisting of multiple 5 mm NMR tubes filled with several diaCEST contrast agents, was imaged.
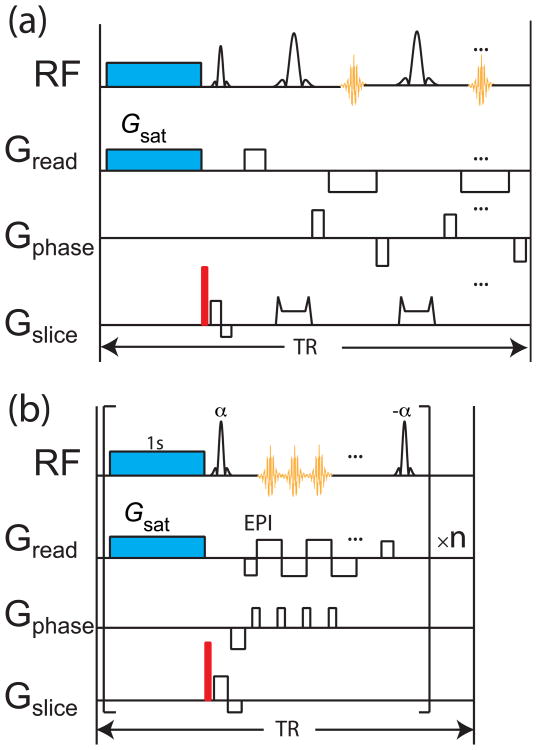
As shown in Figure 1a, the standard RARE sequence was utilized following the UFZ preparation. For the scan with saturation, a 6 μT pulse with a duration of 5 s was applied simultaneously with a 30 μT/mm gradient field. The crusher gradient following the saturation pulse was applied at 60 μT/mm for 1 ms. For readout, TR/TE = 10 s/16.8 ms with a TSE turbo factor of 32. Three slices of 2.5 mm thickness were acquired within the FOV of 2 cm2. A matrix of size 256×32 was acquired. The total scan time was 20 s.
Figure 1.
(a), Pulse sequence for UFZ-RARE; (b), sequence of UFZ-QUEST, the saturation-EPI readout block is repeated several times to generate a series of Z-spectra for QUEST analysis. The crusher gradients are labeled in red. In the UFZ-QUEST sequence, the flip angle of the EPI excitation pulse is α and the flip back pulse is - α.
The sequence utilized for UFZ-QUEST is illustrated in Figure 1b. When using an EPI readout for Ultrafast QUEST, the EPI readout was repeated 6 times corresponding to saturation times of 1 to 6 s for each image, respectively. A linear k-space order was used. To have sufficient SNR at all saturation times, a 3.6 mm slice covering 3 phantoms was selected. 8 μT RF saturation pulses were applied simultaneously with a 37.5 μT/mm gradient field. The FOV was 2 cm2, TR= 10s, TEeffective = 9ms, flip angle α = 10°. 4 EPI segments were used to assure image quality.
Data analysis
The images with saturation (Son) were normalized to the images without saturation (Soff) to remove proton density contrast. The exchange rates were obtained by globally fitting the series of Z-spectra acquired by UFZ-QUEST with different saturation times using the Bloch-McConnell equations [16, 19] with a two-pool model (solute proton pool and a water proton pool). The magnetization is evolved under each element of the RF channel in Figure 1b including the saturation pulse, an excitation pulse with flip angle = α, delay during the EPI readout, and a flip back pulse with flip angle = - α. Then it is looped through each consecutive readout block. The Bloch equations were fit numerically to the whole Z-spectrum from each module using a Levenberg-Marquardt algorithm. The water and solute concentrations used for the fittings are cw = 110 M and cs = 10 mM, respectively, except for sample 7 and 8 where cs = 20 mM since there are 2 exchangeable protons. For the solute pool, the longitudinal relaxation rate (R1s) was 0.7 s-1 and the solute transverse relaxation rate (R2s) was 39 s-1. Water relaxation parameters were refined for each fit using the following initial guesses and constraints in parentheses: longitudinal relaxation rate (R1w) was 0.3 s-1 (0.28 - 0.4 s-1) and the transverse relaxation rate (R2w) was 2.8 s-1 (2 -10 s-1). For exchange rates, constraints were set at kex_min = 100 Hz and kex_max = 2000 Hz to speed up the fitting process. Errors (95% confidence limits) were calculated from the parameter covariance obtained from the fit and weighting the calculated standard error according to a normal distribution. All code was written in-house with Python (Anaconda Software Distribution. Version 2-2.4.0. Continuum Analytics, 2015. <https://continuum.io>). A link to the fitting scripts can be obtained by emailing the authors.
Results and Discussion
UFZ-RARE
Three slices were acquired within a single TR according to Figure 2a. The images acquired with (Son) and without (Sref) saturation are shown in the first and second columns, respectively. The image readout dimension, which is also the Z–spectroscopy dimension, was chosen to be along the length of the sample. This procedure provides both good signal-to-noise ratios and high frequency resolution in the Z spectra. In the Son images (Figure 2b), the central black bands correspond to the direct saturation of water; and the faint dark bands beneath the central bands (labeled with yellow arrows in Figure 2b) are due to the CEST effect. The location of these bands can be shifted easily by changing the saturation frequency offset, gradient polarity and gradient strength to accommodate CEST contrast agents with larger chemical shifts such as paramagnetic CEST agents. Once the saturation parameters are optimized, one can readily compare these agents based on the location of the faint dark bands without further processing. For fast visual screening the Sref (Figure 2c) may not be needed. To generate a full Z- spectrum, however, the Sref is needed to remove proton density contrast, and to eliminate imperfections arising from gradient non-linearity and spatial irregularities of the sample (including for example, imperfect shim, defects of the sample such as air bubbles or precipitates).
Z-spectra of each sample are shown in Figure 2d. The chemical shift of the exchangeable protons in each compound appears at the same frequency as reported previously by Yang et al. using the conventional frequency sweeping method. [13] One can appreciate the uniform baseline of the water signal in these Z-spectra. Since the saturation pulse has only been applied once, magnetic field drift caused by gradient heating can be effectively avoided. Comparing Z-spectra from different slices, it can be noticed that there are some contrast differences for slices acquired at longer times after labeling, due to T1 relaxation. In the current study, we applied 32 phase encoding steps, which are more than needed to distinguish the 3 samples in each imaging plane. As a result, the readout time for each slice is relatively long. Using less phase encoding steps, parallel imaging or multiband acquisition can reduce such a limitation. The CEST effect can be quantified using the area in the water direct saturation signal as a reference.
UFZ-QUEST
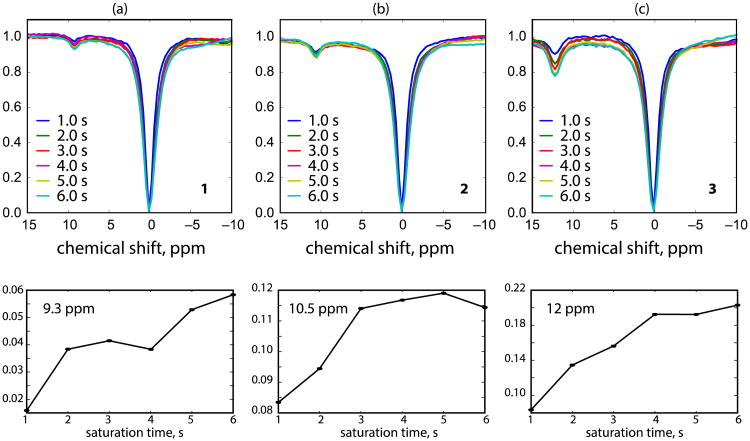
Figure 3 shows Z-spectra of samples 1, 2 and 3 with 6 incremented saturation time of 1 to 6 s recorded using the UFZ-QUEST. It can be seen that the CEST effect buildup with respect to the saturation time is similar to conventional QUEST experiments. Water direct saturation also increases slightly with longer saturation time. The signal-to-noise ratio (SNR) values of the Z-spectra acquired by UFZ-QUEST are lower than those acquired with UFZ-RARE, which is due to the much higher receiver bandwidth applied in EPI comparing to RARE sequence and the small excitation angles applied in EPI readout. Nevertheless, the peaks from the exchanging protons are clearly seen with some slight distortion at the baseline of the Z-spectra. Since a gradient echo EPI was used for image acquisition in UFZ-QUEST, the MRI signal on the transverse plane decays following T2* and is severely affected by susceptibility effect in the samples. In order to minimize the MRI signal loss during the EPI readout period and to obtain reliable parameters from the QUEST fitting, the majority of the water magnetization needs to be kept along the longitudinal direction, which is following the idea applied in the inversion recovery look-locker sequence for rapid T1 measurement [20]. Therefore, a small flip angle (α) was applied for the signal excitation in EPI readout, and a flip back pulse (α) was added at the end of each EPI readout period to recover the remaining magnetization similar to the MeLOVARS approach [21]. The flip back pulse can also partially compensate the pulse imperfection due to B1 inhomogeneity. In the current study, the B1 inhomogeneity was not a major issue, and only reduced the saturation efficiency at the two ends of the Z-spectrum. However, it can be an issue for high field human scanners. Generally, a flip angle α < 30° should be used to allow reasonable fitting accuracy [21]. Here, a flip angle of 10° was chosen based on the simulation and the optimization in the literature [21]. The relatively weak MRI signal as a result of a small flip angle can be partially compensated for by using multi-shot EPI with short echo times. The multi-shot EPI acquisition not only reduces the echo time to minimize the MRI signal loss, but also improves the image quality significantly. Due to pronounced susceptibility effects caused by the water-glass-air interface at the 750MHz micro-imaging system, we needed to limit the length of the readout and a 4-segment EPI was applied in the current study. The readout can be lengthened (and thus the number of segments reduced) by decreasing the image resolution or reducing the susceptibility effect by immersing the glass tubes in oil such as Fomblin.
Figure 3.
The UFZ-QUEST Z-spectra and the corresponding signal buildup curve of samples 1 (a), 2 (b) and 3 (c) with saturation times incremented from 1s to 6 s.
The exchange rates (kex) for each compound obtained from the UFZ-QUEST method are listed in Table 1. These rates were obtained by simultaneously fitting Bloch-McConnell equations to the entire Z-spectrum obtained from each module in the UFZ-QUEST sequence. In principle, the build-up curves obtained at a single frequency (lower panels in Fig. 3) can be fit with the analytical solution for proton transfer ratio as originally proposed in the QUEST approach. Compared to conventional QUEST Z-spectra, these curves had lower SNR. We therefore included the whole Z-spectrum in the Bloch fittings which is more tolerant with respect to SNR and therefore expected to produce more accurate exchange rates. This also allows false local minima to be avoided by including multiple points around the exchangeable peak. In addition, since chemical exchange affects the apparent transverse water relaxation rate [22, 23], the choice of water T2 significantly influences the exchange rates for the solute protons obtained from Bloch equation fitting. Thus, including the direct water saturation line in the fits allowed estimation of R1w and R2w by fitting the direct water saturation lineshape and subsequent fitting for kex while keeping all other Bloch equation parameters fixed.
Table 1.
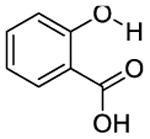
The chemical shift and the fitted exchange rates using UFZ-QUEST. Error bars indicate 95% confidence limits.
| Compound | Chemical Shift relative to water frequency, ppm | kex, S-1, this study | kex, S-1, previous study[13] | |
|---|---|---|---|---|
| 1 |
|
9.3 | 410 ± 80 | 410 ± 20 |
| 2 |
|
10.5 | 650 ± 100 | 550 ± 40 |
| 3 |
|
12 | 1600 ± 400 | 1400 ± 300 |
| 4 |
|
4.8 | 800 ± 200 | 700 ± 40 |
| 5 |
|
6.3 | 180 ± 60 | 540 ±30 |
| 6 |
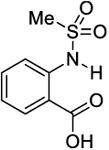
|
7.3 | 200 ± 60 | 470 ±30 |
| 7 |

|
9.8 | 500 ± 100 | 460 ± 30 |
| 8 |
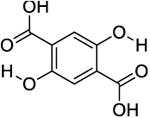
|
8.3 | 600 ± 150 | 980 ± 40 |
Even though the exchange rates from UFZ (except for sample 5 and 6) were comparable with those previously reported in the literature using the individually acquired QUEST Z-spectra [13], they were slightly faster than the conventional QUEST. Inherently, there is a signal loss during each image readout period, which is a tradeoff of the ultrafast method compared to the conventional QUEST approach. This additional loss of signal shortens the lifetime of exchangeable species which leads to a slight over-estimation of exchange rates. The greater discrepancies of exchange rate for sample 5 and 6 are not clear and we tentatively attribute these to possible differences in sample preparation.
Conclusion
We demonstrate that the gradient encoded ultrafast CEST approach can be used as a preparation module for a standard imaging readout method such as RARE to rapidly acquire high quality Z-spectra from multiple samples simultaneously. Furthermore, an ultrafast QUEST method, where the EPI readout was interleaved with a gradient encoded ultrafast CEST module, was introduced. A series of Z–spectra with incrementing saturation time, can be acquired in a single scan, and can be used to extract exchange rates or for optimizing saturation parameters. Both easy-to-implement methods make high throughput screening of CEST contrast agents feasible.
Highlights.
Ultrafast chemical exchange saturation transfer (CEST) experiment is achievable when a gradient field is applied simultaneously with the saturation pulse.
We present a simple method for simultaneous screening of multiple samples.
Interleaving several saturation and readout periods within a single TR enables fast quantification of exchange rate.
The reported approach can be used in high throughput screening of CEST contrast agents.
Acknowledgments
The authors would like to thank Drs. Xing Yang and Martin G. Pomper for providing the samples. This work was supported by the National Institute of Health (R01EB015032 and R01 EB016045).
Grant support from NIH: R01 EB015032 and R01 EB016045
Footnotes
Publisher's Disclaimer: This is a PDF file of an unedited manuscript that has been accepted for publication. As a service to our customers we are providing this early version of the manuscript. The manuscript will undergo copyediting, typesetting, and review of the resulting proof before it is published in its final citable form. Please note that during the production process errors may be discovered which could affect the content, and all legal disclaimers that apply to the journal pertain.
References
- 1.Schröder L, Lowery TJ, Hilty C, Wemmer DE, Pines A. Molecular Imaging Using a Targeted Magnetic Resonance Hyperpolarized Biosensor. Science. 2006;314:446–449. doi: 10.1126/science.1131847. [DOI] [PubMed] [Google Scholar]
- 2.Stevens TK, Palaniappan KK, Ramirez RM, Francis MB, Wemmer DE, Pines A. HyperCEST detection of a 129Xe-based contrast agent composed of cryptophane-A molecular cages on a bacteriophage scaffold. Magn Reson Med. 2013;69:1245–1252. doi: 10.1002/mrm.24371. [DOI] [PubMed] [Google Scholar]
- 3.Swanson SD. Broad-Band Excitation and Detection of Cross-Relaxation NMR-Spectra. J Magn Reson. 1991;95:615–618. [Google Scholar]
- 4.Xu X, Lee JS, Jerschow A. Ultrafast scanning of exchangeable sites by NMR spectroscopy. Angew Chem Inter Ed. 2013;52:8281–8284. doi: 10.1002/anie.201303255. [DOI] [PMC free article] [PubMed] [Google Scholar]
- 5.Döpfert J, Witte C, Schröder L. Slice-selective gradient-encoded CEST spectroscopy for monitoring dynamic parameters and high-throughput sample characterization. J Magn Reson. 2013;237:34–39. doi: 10.1016/j.jmr.2013.09.007. [DOI] [PubMed] [Google Scholar]
- 6.Liu Z, Dimitrov IE, Lenkinski RE, Hajibeigi A, Vinogradov E. UCEPR: Ultrafast localized CEST-spectroscopy with PRESS in phantoms and in vivo. Magn Reson Med. 2015 doi: 10.1002/mrm.25780. [DOI] [PMC free article] [PubMed] [Google Scholar]
- 7.Boutin C, Léonce E, Brotin T, Jerschow A, Berthault P. Ultrafast Z-Spectroscopy for (129)Xe NMR-Based Sensors. J Phys Chem lett. 2013;4:4172–4176. doi: 10.1021/jz402261h. [DOI] [PMC free article] [PubMed] [Google Scholar]
- 8.Döpfert J, Witte C, Schröder L. Fast Gradient-Encoded CEST Spectroscopy of Hyperpolarized Xenon. ChemPhysChem. 2014;15:261–264. doi: 10.1002/cphc.201300888. [DOI] [PubMed] [Google Scholar]
- 9.Liu G, Gilad AA, Bulte JWM, van Zijl PCM, McMahon MT. High-throughput screening of chemical exchange saturation transfer MR contrast agents. Contr Media & Molec Imag. 2010;5:162–170. doi: 10.1002/cmmi.383. [DOI] [PMC free article] [PubMed] [Google Scholar]
- 10.Döpfert J, Zaiss M, Witte C, Schröder L. Ultrafast CEST imaging. J Magn Reson. 2014;243:47–53. doi: 10.1016/j.jmr.2014.03.008. [DOI] [PubMed] [Google Scholar]
- 11.Xu J, Yadav NN, Bar-Shir A, Jones CK, Chan KWY, Zhang J, Walczak P, McMahon MT, van Zijl PCM. Variable delay multi-pulse train for fast chemical exchange saturation transfer and relayed-nuclear overhauser enhancement MRI. Magn Reson Med. 2014;71:1798–1812. doi: 10.1002/mrm.24850. [DOI] [PMC free article] [PubMed] [Google Scholar]
- 12.Cai KJ, Haris M, Singh A, Kogan F, Greenberg JH, Hariharan H, Detre JA, Reddy R. Magnetic resonance imaging of glutamate. Nat Med. 2012;18:302–306. doi: 10.1038/nm.2615. [DOI] [PMC free article] [PubMed] [Google Scholar]
- 13.Yang X, Yadav NN, Song X, Ray Banerjee S, Edelman H, Minn I, van Zijl PC, Pomper MG, Mc Mahon MT. Tuning phenols with Intra-Molecular bond Shifted HYdrogens (IM-SHY) as diaCEST MRI contrast agents. Chemistry. 2014;20:15824–15832. doi: 10.1002/chem.201403943. [DOI] [PMC free article] [PubMed] [Google Scholar]
- 14.Hancu I, Dixon WT, Woods M, Vinogradov E, Sherry AD, Lenkinski RE. CEST and PARACEST MR contrast agents. Acta Radio. 2010;51:910–923. doi: 10.3109/02841851.2010.502126. [DOI] [PMC free article] [PubMed] [Google Scholar]
- 15.Song X, Yang X, Ray Banerjee S, Pomper MG, Mc Mahon MT. Anthranilic acid analogs as diamagnetic CEST MRI contrast agents that feature an intramolecular-bond shifted hydrogen. Contr Media & Molec Imag. 2015;10:74–80. doi: 10.1002/cmmi.1597. [DOI] [PMC free article] [PubMed] [Google Scholar]
- 16.McMahon MT, Gilad AA, Zhou J, Sun PZ, Bulte JWM, van Zijl PCM. Quantifying exchange rates in chemical exchange saturation transfer agents using the saturation time and saturation power dependencies of the magnetization transfer effect on the magnetic resonance imaging signal (QUEST and QUESP): Ph calibration for poly-L-lysine and a starburst dendrimer. Magn Reson Med. 2006;55:836–847. doi: 10.1002/mrm.20818. [DOI] [PMC free article] [PubMed] [Google Scholar]
- 17.Sun PZ. Simplified quantification of labile proton concentration-weighted chemical exchange rate (k(ws)) with RF saturation time dependent ratiometric analysis (QUESTRA) - Normalization of relaxation and RF irradiation spillover effects for improved quantitative chemical exchange saturation transfer (CEST) MRI. Magn Reson Med. 2012;67:936–942. doi: 10.1002/mrm.23068. [DOI] [PMC free article] [PubMed] [Google Scholar]
- 18.Randtke EA, Chen LQ, Pagel MD. The reciprocal linear QUEST analysis method facilitates the measurements of chemical exchange rates with CEST MRI. Contr Media & Molec Imag. 2014;9:252–258. doi: 10.1002/cmmi.1566. [DOI] [PMC free article] [PubMed] [Google Scholar]
- 19.McConnell HM. Reaction Rates by Nuclear Magnetic Resonance. J Cham Phys. 1958;28:430–431. [Google Scholar]
- 20.Gowland P, Mansfield P. Accurate measurement of T1 in vivo in less than 3 seconds using echo-planar imaging. Magn Reson Med. 1993;30:351–354. doi: 10.1002/mrm.1910300312. [DOI] [PubMed] [Google Scholar]
- 21.Song X, Xu J, Xia S, Yadav NN, Lal B, Laterra J, Bulte JW, van Zijl PC, McMahon MT. Multi-echo length and offset VARied saturation (MeLOVARS) method for improved CEST imaging. Magn Reson Med. 2015;73:488–496. doi: 10.1002/mrm.25567. [DOI] [PMC free article] [PubMed] [Google Scholar]
- 22.Gore JC, Brown MS, Mizumoto CT, Armitage IM. Influence of glycogen on water proton relaxation times. Magnetic Resonance in Medicine. 1986;3:463–466. doi: 10.1002/mrm.1910030312. [DOI] [PubMed] [Google Scholar]
- 23.Yadav NN, Xu J, Bar-Shir A, Qin Q, Chan KW, Grgac K, Li W, McMahon MT, van Zijl PC. Natural D-glucose as a biodegradable MRI relaxation agent. Magn Reson Med. 2014;72:823–828. doi: 10.1002/mrm.25329. [DOI] [PMC free article] [PubMed] [Google Scholar]


