

Abstract
Regulation of gene expression is fundamental in establishing cellular diversity and a target of natural selection. Untranslated mRNA regions (UTRs) are key mediators of post‐transcriptional regulation. Previous studies have predicted thousands of ORFs in 5′ UTRs, the vast majority of which have unknown function. Here, we present a systematic analysis of the translation and function of upstream open reading frames (uORFs) across vertebrates. Using high‐resolution ribosome footprinting, we find that (i) uORFs are prevalent within vertebrate transcriptomes, (ii) the majority show signatures of active translation, and (iii) uORFs act as potent regulators of translation and RNA levels, with a similar magnitude to miRNAs. Reporter experiments reveal clear repression of downstream translation by uORFs/oORFs. uORF number, intercistronic distance, overlap with the CDS, and initiation context most strongly influence translation. Evolution has targeted these features to favor uORFs amenable to regulation over constitutively repressive uORFs/oORFs. Finally, we observe that the regulatory potential of uORFs on individual genes is conserved across species. These results provide insight into the regulatory code within mRNA leader sequences and their capacity to modulate translation across vertebrates.
Keywords: gene regulation, ribosome profiling, translation, uORFs
Subject Categories: Protein Biosynthesis & Quality Control, RNA Biology, Systems & Computational Biology
Introduction
The regulation of protein production determines specific cellular phenotypes, and changes in this regulation are a fundamental driver of evolution. Post‐transcriptional regulation is a major determinant of protein production rates (Tian et al, 2004; Lu et al, 2007). Much of the effort to understand post‐transcriptional regulation has focused on the analysis of 3′ untranslated regions (3′ UTRs) of mRNAs, which can harbor sequences recognized by RNA‐binding proteins (Glisovic et al, 2008; Hafner et al, 2010; Castello et al, 2012; Yartseva & Giraldez, 2015), miRNA recognition sites (Ambros, 2004; Filipowicz et al, 2008; Bartel, 2009), and cytoplasmic polyadenylation elements (Mendez & Richter, 2001; Radford et al, 2008; Ivshina et al, 2014), which affect mRNA translation, localization, and stability. Within the 5′ untranslated region (5′ UTR, leader sequence), various elements have been identified that affect the ability of ribosomes to assemble and initiate, including internal ribosome entry sites (IRESs) (Xue et al, 2014), G‐quadruplexes (Beaudoin & Perreault, 2010; Bugaut & Balasubramanian, 2012), and iron response elements (IREs) (Muckenthaler et al, 2008; Goss & Theil, 2011), but the regulatory capacity of the 5′ UTR has been less well characterized.
Ribosome footprinting enables transcriptome‐wide monitoring of translation via ribosome‐protected mRNA fragments (RPFs) (Steitz, 1969; Wolin & Walter, 1988) as a proxy for translation in vivo (Ingolia et al, 2009). This method has allowed probing of post‐transcriptional regulatory mechanisms in the cell (Guo et al, 2010; Bazzini et al, 2012; Guydosh & Green, 2014; Subtelny et al, 2014) and has revealed translation in many transcribed regions previously thought to be non‐coding (Ingolia et al, 2011, 2014; Brar et al, 2012; Chew et al, 2013; Crappé et al, 2013; Bazzini et al, 2014). In recent ribosome footprinting studies, a large fraction of ribosome footprints outside of canonical protein‐coding regions (CDSs) appear to be derived from ribosomes translating sequences in the 5′ UTR (Ingolia et al, 2011; Brar et al, 2012; Lee et al, 2012; Bazzini et al, 2014), yet the extent and function of translation within the 5′ UTR remains largely unexplored. Various computational methods have been developed to classify ORF translation based on the distribution of ribosome footprints—such as the translated ORF classifier (TOC) (Chew et al, 2013) and ribosome release score (RRS) (Guttman et al, 2013). We recently leveraged the unique trinucleotide movement of active ribosomes and developed ORFscore (Bazzini et al, 2014) to accurately identify translated regions within predicted coding and non‐coding RNAs. This analysis revealed an abundance of short, translated ORFs with unknown function. Mass spectrometry experiments have also identified stable peptides encoded by upstream open reading frames (uORFs) (Oyama et al, 2004; Slavoff et al, 2013; Bazzini et al, 2014). Indeed, sequence‐based analyses have identified uORFs in the transcriptomes of a variety of organisms (Iacono et al, 2005; Zhang et al, 2010; Brar et al, 2012). Yet, compared to the size of the predicted uORF landscape, remarkably few have been functionally studied (Wethmar et al, 2014).
In eukaryotic transcriptomes, translation may itself have regulatory impact on gene expression independent of the encoded peptide. The potential regulatory functions of uORFs have been studied in the context of numerous individual genes (Wethmar et al, 2014; Wethmar, 2014). uORFs have often been implicated as translational repressors; the most well‐studied example of uORF activity occurs in stress response gene GCN4 (ATF4 in vertebrates), in which uORFs repress translation of the main open reading frame until the cell encounters stress conditions (Mueller & Hinnebusch, 1986; Vattem & Wek, 2004). On the other hand, some uORFs have been shown to function through their encoded peptide sequences (Rahmani et al, 2009; Ebina et al, 2015), and it has not yet been determined whether most uORF‐encoded peptides are themselves functional molecules. uORFs can control protein isoform selection by influencing alternate AUG usage (Calkhoven et al, 2000; Kochetov et al, 2008), engaging nonsense‐mediated decay (NMD) (Mendell et al, 2004; Hurt et al, 2013), and modulating internal ribosome entry site (IRES) usage (Fernandez et al, 2005; Bastide et al, 2008). uORF polymorphism has also been implicated in a variety of human diseases (Calvo et al, 2009; Chatterjee et al, 2010; Barbosa & Gene, 2014), and uORF‐containing genes are prominent in key cellular processes and functional classes, such as stress response (Lawless et al, 2009), meiosis (Brar et al, 2012), circadian rhythms (Janich et al, 2015), and tyrosine kinase activity (Wethmar et al, 2015). Finally, proteomic analyses have linked predicted uORFs to lower protein levels (Calvo et al, 2009; Ye et al, 2015). However, it is still unclear what fraction of uORFs undergo translation, how widespread uORF‐mediated regulation is across vertebrate transcriptomes, how this depends on the translation of uORFs, and what sequence elements most influence uORF function.
To gain insight into the extent of translation within leader sequences and the function of these novel translated regions, we generated a subcodon‐resolution ribosome profiling dataset, along with RNA‐seq, spanning five developmental stages in zebrafish (2, 5, 12, 24, 48 hpf) (Bazzini et al, 2014). Here, we have combined this dataset with ribosome profiling data from human and mouse (Ingolia et al, 2011; Thoreen et al, 2012; Ulitsky et al, 2012; Gao et al, 2014; Reid et al, 2014; Rutkowski et al, 2015) to study the nature and effect of leader translation across vertebrates. Using these data, we have investigated (i) the extent of uORF translation across various cell types and stages of vertebrate embryogenesis, (ii) the effect of uORFs on translation and RNA levels, (iii) sequence features that modulate uORF activity, (iv) evolutionarily selection on uORF sequence features, and (v) conservation of uORF regulatory activity between vertebrate species. Together, our analyses reveal an extensive regulatory code within leader sequences in mRNAs with the capacity to modulate translation and mRNA stability, uncovering a conserved and widespread regulatory layer across vertebrates.
Results
uORFs are widespread and translated during development
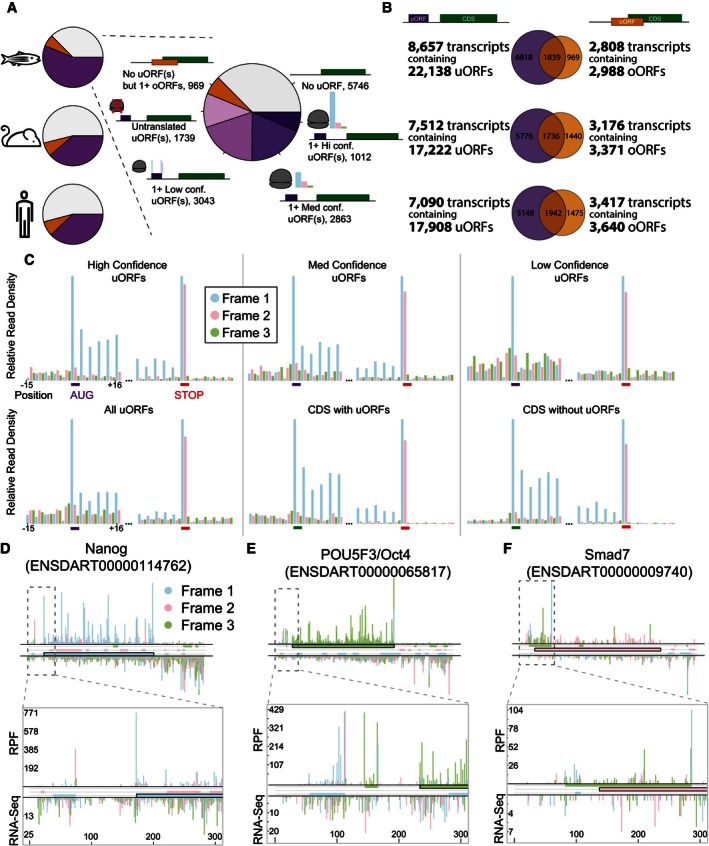
To determine the prevalence of uORFs across vertebrate genomes, we computationally defined all potential uORFs throughout the zebrafish, mouse, and human transcriptomes. We restricted our analysis uORFs initiated by an AUG start codon, as these constitute the majority of leader translation (Ingolia et al, 2014) and display more dynamic translation than near‐cognate initiated ORFs (Brar et al, 2012). We defined a uORF as an in‐frame AUG‐stop pair upstream of the CDS start codon. In the event of multiple initiation sites for a given stop codon, we selected the most distal in‐frame uAUG as the ORF start. In parallel, we also defined all ORFs overlapping the CDS AUG (overlapping uORFs, oORFs). Our analysis revealed that more than half (62.6%) of the protein‐coding genes in zebrafish contain at least one uORF or oORF (Fig 1A) after filtering out redundant transcripts and incompletely annotated 5′ UTRs. The human and mouse transcriptomes had similar uORF content (49.5 and 46.1%, respectively, Fig 1A), consistent with previous computational estimates (Calvo et al, 2009; Ye et al, 2015). The majority of oORF‐containing transcripts also contain at least one uORF (Fig 1B). Given the prevalence of this class of ORFs across vertebrates, we undertook a systematic characterization of their translation and function.
Figure 1. uORFs are widespread and translated during zebrafish development.
-
AClassification of the protein‐coding transcriptome in zebrafish, human, and mouse reveals that uORFs are widespread and translated. Transcripts containing at least one uORF are marked in purple, transcripts containing no uORFs but at least one oORF are marked in orange, and transcripts lacking both are gray. In zebrafish, three different translation thresholds were applied to classify translated uORFs, and each transcript then classified by its highest confidence uORF: low confidence (dark pink): RPF RPKM > 0; medium confidence (light purple): ORFscore > 0; and high confidence (dark purple): ORFscore > 6.044.
-
BuORFs and oORFs are widespread throughout the embryonic transcriptome, with a majority of oORF‐containing transcripts also containing at least one uORF. uORF‐containing (purple) and oORF‐containing (orange) transcripts were counted in mouse, human, and zebrafish, and the overlap is shown by Venn diagrams.
-
CMetagene analysis reveals features of active translation in uORFs classified as translated. Metagene plots display normalized ribosome‐protected fragment density surrounding uORF start and stop codons, colored according to the frame relative to the ORF being translated. CDS regions with and without uORFs are also shown for comparison. Note the clear phasing of ribosome‐protected fragments within high‐ and medium‐confidence uORFs, and the characteristic start and stop RPF peaks across all classes of uORFs.
-
D–FRibosome profiling reveals in‐frame translation of uORFs/oORFs in key developmental regulators. RPF‐line plots show the positional distribution of 28 and 29 nt RPFs (above axes) and mRNA‐seq reads (below axes) in the whole gene (below) and first 300 nt (inset above) of Nanog (D), POU5F3 (E), and Smad7 (F). All putative ORFs (Distal AUG‐Stop) are colored by respective frame (blue, pink and green boxes), as are reads according to their P‐site. Note the agreement between ORF color and RPF color, consistent with a strong in‐frame distribution of reads within individual transcripts.
Ribosome footprinting enables the identification of RNA sequences protected by the ribosome (ribosome‐protected fragments, RPFs) as readout of translation (Ingolia et al, 2009). We recently developed ORFscore, a computational metric which uses the unique trinucleotide periodicity of ribosome footprints to more confidently identify translated ORFs (Bazzini et al, 2014). ORFscore uses a modified chi‐square statistic to take into account both footprint phasing and depth, where the sign of the score represents the dominant reading frame (+: in‐frame) and the magnitude represents footprint depth and phasing. To gain insight into uORF function, we used ribosome occupancy and ORFscore to classify translated uORFs at three levels of confidence, and validated their translation using the unique signatures of initiating and terminating ribosomes. Due to variable digestion/resolution across the mammalian datasets, this analysis was performed only on zebrafish uORFs (transcriptome‐wide uORF location and translation data are provided for all three species in Datasets EV1, EV2, and EV3, see Table EV1 for details). After classification, 45% (6,918) of zebrafish transcripts (79.9% of uORF‐containing transcripts) contained one or more uORFs with ribosome occupancy (Fig 1A). Using ORFscore, we classified 1,012 transcripts containing a confidently translated uORF [11.7% of uORF‐containing transcripts, ORFscore > 6.044 as defined in Bazzini et al (2014)]. An additional 2,863 transcripts (33.1% of uORF‐containing transcripts) had at least one potentially translated uORF (medium confidence, ORFscore > 0, indicating a bias toward in‐frame reads) (Fig 1A). Indeed, metagene analysis of ribosome‐protected fragments in upstream open reading frames revealed clear in‐frame bias for all uORFs identified, with a particularly strong phasing in high‐ and medium‐confidence uORFs, indicating that they are actively translated (Fig 1C). Even low‐confidence uORFs (ORFscore < 0, RPF RPKM > 0) showed a peak of in‐frame reads at their AUG and a characteristic double peak in the stop codon common to all CDS. We note that the confidence levels refer to confidence of detection, not level of translation—low‐confidence uORFs may still be efficiently translated but not confidently detected due to low RNA levels or overlapping ORFs which influence RPF phasing and density. Using the phasing of the ribosome footprints, we could clearly distinguish uORF‐/oORF‐specific translation in a variety of zebrafish transcripts, including the key developmental regulators POU5F3 (Oct4), Nanog, and Smad7 (Fig 1D–F). However, we did not identify any notable gene ontology enrichments in uORF‐containing genes. Given the extensive translation of uORFs, we will hereafter refer to the 5′ UTR as the TLS (transcribed leader sequence). Together, these results show that a large fraction of the ORFs in TLS regions are translated in vivo.
Most uORFs do not encode conserved peptides
One possible outcome of uORF translation is the production of a functional peptide. Such small proteins have by‐and‐large evaded traditional identification, but examples of functional small peptides are now emerging across many organisms and biological processes (Kondo et al, 2010; Magny et al, 2013; Pauli et al, 2014; Slavoff et al, 2014). To investigate whether uORFs primarily encode conserved peptides, we employed PhyloCSF (Lin et al, 2011)—a likelihood‐based method that analyzes signatures of evolutionary conservation in multiple alignments—to score ORFs based on conservation within five teleost fishes or 29 mammals. Only 27 zebrafish uORFs (0.3%) showed strong evidence of conservation (PhyloCSF > 50) (Fig 2A), with the majority of uORFs lacking signs of selective pressure to maintain their amino acid sequence. Interestingly, compared to all uORFs, the subset of confidently translated uORFs was significantly enriched in conserved uORFs (18 uORFs, Fisher exact test P = 7.048e‐9) (Fig 2B and C). Mammalian uORFs similarly lacked conservation at the amino acid level—only 87 mouse uORFs (1.1%) and 149 human uORFs (1.7%) showed likelihood of conservation (Fig EV1A and B) (representative alignments shown in Fig EV1C–I for clarity). Together, these results indicate that the large majority of uORFs do not appear to be under selective pressure to maintain their encoded amino acid sequence, suggesting that any potential function is largely independent of a conserved peptide.
Figure 2. uORFs act repressively in vertebrate development.

-
A, BMost uORFs are not conserved at the peptide sequence level. Pie charts depict coding potential (phyloCSF score) of (A) all potential uORFs and (B) translated uORFs. uORFs with a phyloCSF score ≥ 50 were considered conserved, uORFs were considered weakly conserved if their phyloCSF score was positive but less than the conservation threshold of 50.
-
CTranslated uORFs are enriched in conserved peptides. Enrichment plot indicates log‐odds ratio of conserved uORFs in the set of translated uORFs versus all uORFs.
-
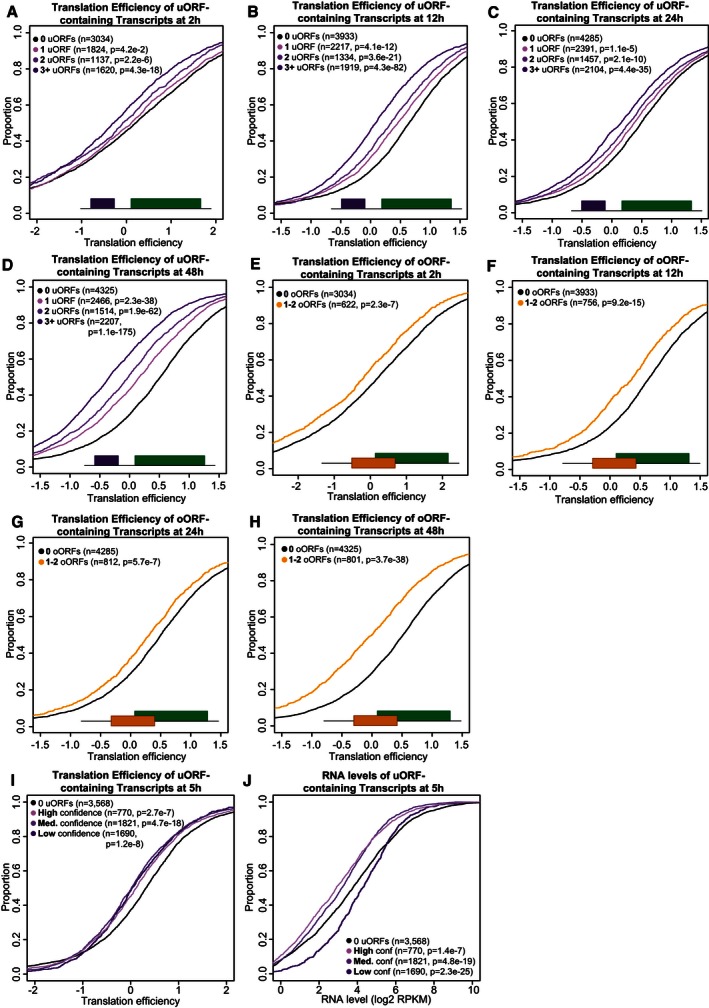
DuORF‐containing transcripts are translationally repressed at 5 hpf. Cumulative distribution of translation efficiency in expressed (> 0.5 RPKM) uORF‐containing transcripts versus transcripts lacking uORFs. Transcripts containing oORFs are excluded from this plot. Control transcripts (0 uORFs) have a coding CDS (Global ORFscore > 6.044) but no uORF in their 5′ TL. Two‐sided Wilcoxon P‐values are provided for each uORF set compared to the control.
-
ETranslation is significantly repressed in oORF‐containing transcripts. Cumulative distribution of translation efficiency at 5 hpf in expressed (> 0.5 RPKM) oORF‐containing transcripts versus transcripts lacking oORFs. Transcripts containing uORFs are excluded from this set. Control transcripts (0 oORFs) have a coding CDS (Global ORFscore > 6.044) but no uORF in their TLS. Two‐sided Wilcoxon P‐value is provided for the oORF set compared to the control.
-
FmiR‐430 is a widespread developmental translation repressor. Cumulative distribution of translation efficiency at 5 hpf in expressed (> 0.5 RPKM) miR‐430 site‐containing transcripts (single or multiple 7/8‐mers) versus transcripts which lack a miR‐430 site in their 3′ UTR. Two‐sided Wilcoxon P‐value is provided for the miR‐430 set compared to the control.
-
GuORFs are associated with lower RNA levels. Cumulative distribution of translation efficiency at 5 hpf in expressed (> 0.5 RPKM) uORF‐containing transcripts versus transcripts lacking uORFs. Transcripts containing oORFs are excluded from this plot. Control transcripts (0 uORFs) have a coding CDS (Global ORFscore > 6.044) but no uORF in their 5′ UTR. Two‐sided Wilcoxon P‐values are provided for each uORF set compared to the control.
-
HoORFs are associated with lower RNA levels. Cumulative distribution of translation efficiency at 5 hpf in expressed (> 0.5 RPKM) oORF‐containing transcripts versus transcripts lacking oORFs. Transcripts containing uORFs are excluded from this set. Control transcripts (0 oORFs) have a coding CDS (Global ORFscore > 6.044) but no uORF in their 5′ UTR. Two‐sided Wilcoxon P‐value is provided for the oORF set compared to the control.
-
ImiR‐430 targets RNAs for degradation by 5 hpf. Cumulative distribution of translation efficiency at 5 hpf in expressed (> 0.5 RPKM) miR‐430 site‐containing transcripts (single or multiple 7/8‐mers) versus transcripts which lack a miR‐430 site in their 3′ UTR. Two‐sided Wilcoxon P‐value is provided for the miR‐430 set compared to the control.
Figure EV1. Conservation of uORFs in mammals.

-
A, BPie charts depict coding potential (phyloCSF score) of (A) human uORFs and (B) mouse uORFs. uORFs with a phyloCSF score ≥ 50 were considered conserved, and uORFs were considered weakly conserved if their phyloCSF score was positive but less than the conservation threshold of 50.
-
CLegend displaying the color codes for various types of substitutions in the representative multiple alignments. Amino acid substitutions are considered conservative if they have a positive BLOSUM62 score.
-
D–IRepresentative human uORF alignments (across 29 mammals) are shown for a (D) conserved uORF, (E) weakly conserved uORF, and (F) non‐conserved uORF. Representative zebrafish uORF alignments (across 5 teleosts) are shown for a (G) conserved uORF, (H) weakly conserved uORF, and (I) non‐conserved uORF.
uORFs are associated with widespread translational repression
Given the active translation of uORFs, and the fact that they do not encode conserved peptides, we next sought to characterize their effect on the transcripts in which they reside. We first analyzed their cis‐acting effect on mRNA translation. To this end, we compared the translation efficiency (RPFs normalized by mRNA levels) (Ingolia et al, 2009) of the CDS in all uORF‐containing transcripts versus those lacking uORFs. This analysis revealed that the presence of uORFs or oORFs in the TLS of a gene was associated with significant translational repression (5 hpf, Fig 2D and E, Wilcoxon P = 7.1e‐33, P = 2.3e‐11 respectively). This repression was significant across all developmental stages measured in zebrafish, with the strongest repression occurring at 48 hpf (Fig EV2A–H). The presence of a single AUG‐overlapping uORF (oORF) was associated with significantly lower translation levels than a single uORF (5 hpf, Wilcoxon P = 1.23e‐3). We observed a significant effect across all three uORF translation confidence levels (5 hpf, Wilcoxon P = 2.7e‐7, P = 4.7e‐18, P = 1.2e‐8, for high‐, medium‐, and low‐confidence translated uORFs, respectively) (Fig EV2I). To determine whether the effect of uORFs is conserved across vertebrates, we next predicted all uORFs across the mouse and human transcriptome and analyzed previously published ribosome profiling datasets (Guo et al, 2010; Ingolia et al, 2011; Thoreen et al, 2012; Gao et al, 2014; Gonzalez et al, 2014; Reid et al, 2014; Rutkowski et al, 2015) (Table EV3). We observed in all mammalian samples that uORF‐containing transcripts are less efficiently translated than mRNAs lacking uORFs (Fig 3A–D and Appendix Fig S1). These results indicate that the association of uORFs and oORFs with lower translation efficiency is significant and shared across vertebrates.
Figure EV2. uORF and oORF presence repress translation across zebrafish development (additional time points).
-
A–DCumulative plots show translation efficiency of CDSs with varying numbers of uORFs for expressed transcripts at (A) 2 hpf, (B) 12 hpf, (C) 24 hpf, and (D) 48 hpf. P‐values are calculated versus transcripts lacking uORFs using a Wilcoxon rank‐sum test with continuity correction.
-
E–HAdditional cumulative plots show translation efficiency of CDSs with or without oORFs for expressed transcripts at (E) 2 hpf, (F) 12 hpf, (G) 24 hpf, and (H) 48 hpf.
-
I, JFurther cumulative plots display translation efficiency of CDSs (I) or RNA expression (J) at 5 hpf in zebrafish transcripts with at least one high‐, medium‐, or low‐confidence uORF versus a control set lacking uORFs.
Figure 3. uORFs and oORFs regulate translation in mammals.
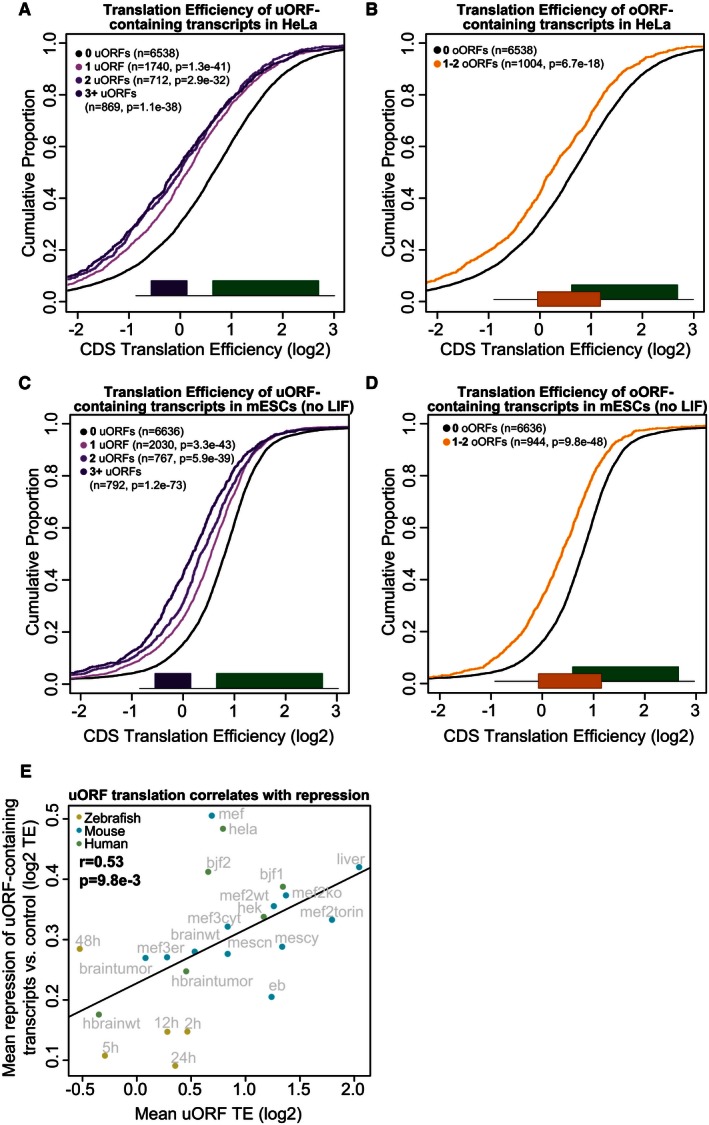
- uORF‐containing transcripts are repressed in HeLa cells. Plot displays the cumulative distribution of translation efficiency in expressed (> 0.5 RPKM) transcripts containing 1, 2, or > 2 uORFs versus transcripts lacking uORFs. Transcripts containing oORFs are excluded from this set. Two‐sided Wilcoxon P‐values are provided for each uORF set compared to the control.
- oORF‐containing transcripts are repressed in HeLa cells. Plot displays the cumulative distribution of translation efficiency in expressed (> 0.5 RPKM) oORF‐containing transcripts versus transcripts lacking oORFs. Transcripts containing uORFs are excluded from this set. Two‐sided Wilcoxon P‐value is provided for the oORF set compared to the control.
- uORF‐containing transcripts are repressed in murine embryonic stem cells. Plot displays the cumulative distribution of translation efficiency in expressed (> 0.5 RPKM) transcripts containing 1, 2, or > 2 uORFs versus transcripts lacking uORFs. Transcripts containing oORFs are excluded from this set. Two‐sided Wilcoxon P‐values are provided for each uORF set compared to the control.
- oORF‐containing transcripts are repressed in murine embryonic stem cells. Plot displays the cumulative distribution of translation efficiency in expressed (> 0.5 RPKM) oORF‐containing transcripts versus transcripts lacking oORFs. Transcripts containing uORFs are excluded from this set. Two‐sided Wilcoxon P‐value is provided for the oORF set compared to the control.
- uORF translation is correlated with CDS repression. Scatterplot displays the per‐sample mean repression of uORF‐containing transcripts versus the mean translation efficiency of uORFs in single‐uORF transcripts. Repression is determined by calculating the difference between the mean TE of CDSs in uORF‐containing transcripts versus the mean TE of CDSs in transcripts lacking uORFs/oORFs in their TLS. Only expressed transcripts (> 0.5 RNA RPKM across samples per organism) were counted. Labels indicate the sample name. For more information on individual samples, see Table EV3.
We next sought to determine whether the level of translation of uORFs influences the level of translational repression of downstream CDSs. Due to their small size, quantitative comparison of translation levels of individual uORFs across conditions is subject to significant noise, and thus, we analyzed this effect at the whole‐transcriptome level across multiple cell/tissue types, conditions, and species. To avoid the potential effects of early uORFs on downstream uORFs, we analyzed only single‐uORF transcripts. Comparing the mean translation efficiency of uORFs to the mean observed repression of uORF‐containing transcripts in each sample reveals a significant correlation (r = 0.53, P = 9.8e‐3) between uORF translation and downstream repression across samples (Fig 3E). These results link not just presence, but translation of uORFs to lower translation of downstream coding regions.
To gain insight into the scale of translational repression in uORF‐containing transcripts, we compared it to the repressive effects of miR‐430, a driving factor in zebrafish development shown to translationally repress and deadenylate a significant portion of the transcriptome during the maternal–zygotic transition (Giraldez et al, 2006; Bazzini et al, 2012). The presence of an upstream/overlapping ORF displayed comparable repression to miR‐430 (Fig 2F and I). These results demonstrate that uORFs are associated with potent translational repression in vivo.
uORF presence correlates with lower steady‐state RNA levels
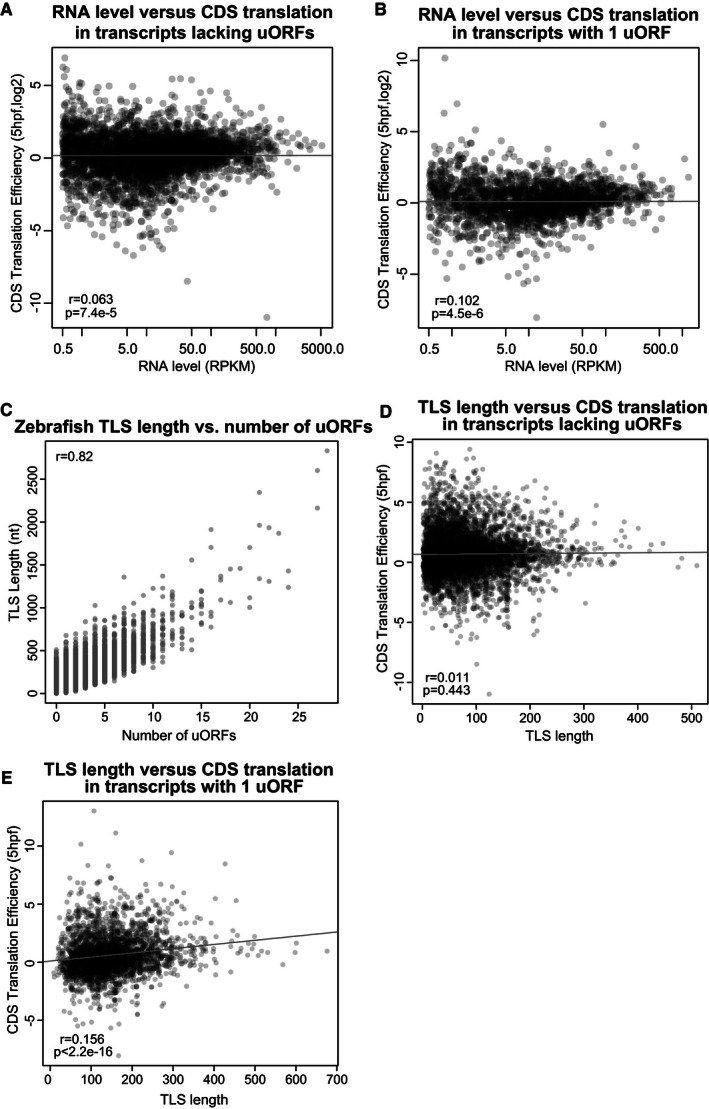
Translation of some uORFs can cause nonsense‐mediated decay (NMD), with larger uORFs and termination events near the 5′ cap predicted to trigger mRNA decay via this pathway (Mendell et al, 2004; Barbosa et al, 2013). We thus analyzed the impact of vertebrate uORFs on steady‐state mRNA levels across human, mouse, and zebrafish. Indeed, we observe that uORFs and oORFs are associated with lower steady‐state RNA level (Fig 2G and H). We also observed a significant effect across all three uORF translation confidence levels (5 hpf, Wilcoxon P = 1.4e‐7, P = 4.8e‐19, P = 2.3e‐25, for high‐, medium‐, and low‐confidence translated uORFs, respectively), though ORFscore detection thresholds bias the high‐confidence set toward higher mRNA levels (Fig EV2J). Correlation between RNA levels and translation efficiency is low (Fig EV3A and B), and we note that that the translation repression effects we observe are not just a result of changes at the RNA level, because we measure translation using translation efficiency, which is normalized to RNA levels. Taken together, these results indicate that uORFs are associated with regulation of vertebrate mRNA levels that correlates with the number of uORFs in a transcript.
Figure EV3. Controls for RNA levels and TLS length.
-
A, BScatterplots show the relationship between RNA level and CDS translation efficiency (zebrafish, 5 hpf) controlling for the number of uORFs by selecting (A) transcripts lacking uORFs (Pearson's r = 0.063, P = 7.4e‐5) and (B) transcripts containing a single uORF (Pearson's r = 0.102, P = 4.5e‐6).
-
CTLS length and number of uORFs are well correlated in zebrafish (Pearson's r = 0.82).
-
D, EScatterplots show the relationship between TLS length and CDS translation efficiency (zebrafish, 5 hpf) controlling for the number of uORFs by selecting (D) transcripts lacking uORFs (Pearson's r = 0.011, P = 0.443) and (E) transcripts containing a single uORF (Pearson's r = 0.156, P < 2.2e‐16).
uORF sequence features influence translational repression
Next, we investigated whether uORF sequence features influence the translational repression of downstream CDS regions. First, we analyzed the level of translational repression versus the number of predicted uORFs in each transcript. We compared the cumulative distribution of translation efficiency for transcripts without uORFs versus transcripts containing 1, 2, or 3+ uORFs in human, mouse, and zebrafish. We observed that the level of repression increases with the number of uORFs per transcript (Fig 2D). Though TLS length is highly correlated with uORF number (r = 0.82, Fig EV3C), the translational repression effect was not merely the result of longer TLS length in mRNAs with more uORFs, because we find that TLS length actually has a positive effect on CDS translation when controlling for uORF number (Fig EV3D and E). These results suggest that multiple uORFs have an additive effect that is linked to increased repression of downstream translation.
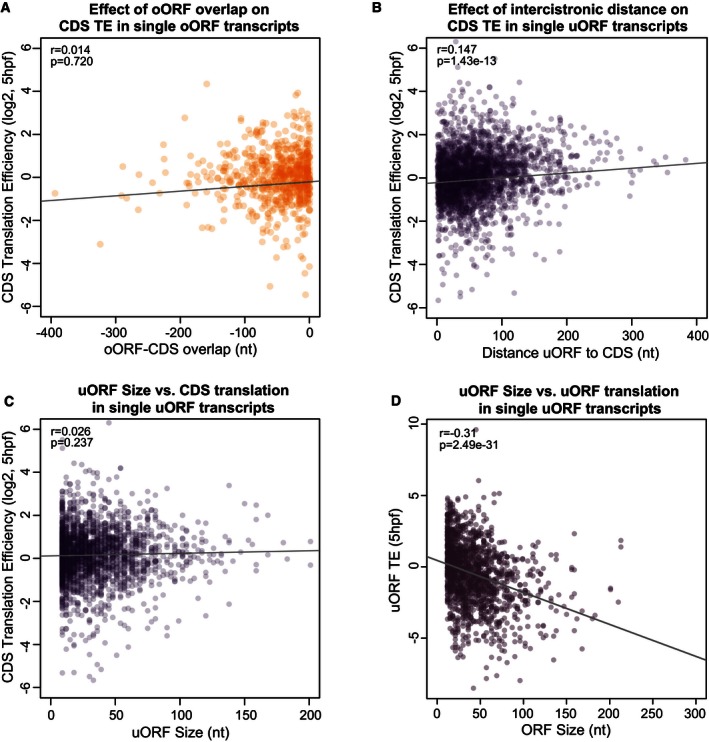
Second, we examined whether uORF‐CDS overlap affects downstream regulation. Overlap of the CDS AUG has been shown in reporter assays to affect repression by uORFs (Calkhoven et al, 2000; Wethmar, 2014). However, a prior proteomic study did not show any difference in repressive capacity from non‐overlapping uORFs (Calvo et al, 2009). To investigate the global effect of AUG‐overlapping ORFs (oORFs) on translation, we grouped genes according to whether or not they contained an oORF and compared the effect on the translation of the CDS. Our analysis revealed that transcripts containing a CDS‐overlapping open reading frame were associated with stronger translational repression than those containing a non‐overlapping uORF (Figs 2E and EV2E–H, Appendix Fig S1). Furthermore, given that RPFs from oORF translation also contribute translation signal to the CDS, it is likely that the level of repression in oORF‐containing genes is being underestimated by using translation efficiency as a metric. The degree of overlap between CDS and oORF did not significantly change this repression (Fig EV4A) (r = 0.014, P = 0.72).
Figure EV4. Additional factors that influence uORF repression in vertebrates (presented in zebrafish at 5 hpf).
-
A–DScatterplots present the effect of various uORF sequence features on translation in zebrafish at 5 hpf. (A) Points indicate the translation efficiency of CDSs in expressed, oORF‐containing transcripts which lack uORFs. The x‐axis indicates the relative position of the CDS AUG to the oORF stop codon, with more negative numbers indicating larger overlap. The amount of overlap is not significantly correlated with CDS TE (Pearson's r = 0.014, P = 0.720). (B, C) Points indicate the translation efficiency of CDSs in expressed, single‐uORF‐containing transcripts which lack oORFs, versus (B) intercistronic distance (Pearson's r = 0.147, P = 1.43e‐13) and (C) uORF size (Pearson's r = 0.026, P = 0.237). (D) uORF size is inversely correlated with uORF translation efficiency (Pearson's r = −0.31, P = 2.49e‐31).
Third, we analyzed the effect of intercistronic distance on uORF repression. Intercistronic distance has been shown to affect reinitiation capacity (Roy et al, 2010), and our analysis of oORFs (by definition, uORFs with no intercistronic region) shows that they are particularly associated with translation repression (Figs 2E and EV2E–H, Appendix Fig S1). Extending this trend, we indeed observe a small but significant correlation between uORF‐CDS distance and CDS translation (single‐uORF transcripts, 5 hpf r = 0.147, P = 1.43e‐13, Fig EV4B), which is higher when only high‐ or medium‐confidence uORFs are considered (5 hpf high‐confidence r = 0.171, P = 0.14; medium‐confidence r = 0.157, P = 1.1e‐4). Finally, although ORF length modulates reinitiation capacity in some known polycistronic transcripts (Luukkonen et al, 1995; Pöyry et al, 2004), we did not observe any significant effect of uORF length on CDS translation efficiency (Fig EV4C) even when the analysis was restricted to medium‐/high‐confidence translated uORFs. However, longer uORFs were translated less efficiently (Fig EV4D). Taken together, these results indicate that the number of uORFs in a given TLS, the overlap of an oORF with the CDS AUG, and the distance between a uORF and the downstream protein‐coding region contribute to the cis‐regulatory activity of uORFs toward the CDS.
uORF initiation contexts influence repression
The sequence context of the initiation site is an important determinant of translation (Kozak, 1987a; Grzegorski et al, 2014; Noderer et al, 2014). uORFs inherently provide the first initiation sites encountered by a 5′–3′ scanning 40S. We hypothesized that the sequence context of the uORF start codon could influence the translation of the uORF and modulate the regulatory effect on the downstream CDS. We scored the initiation contexts of uORFs and oORFs across human, mouse, and zebrafish using species‐specific context scoring matrices based on nucleotide frequency and validated in vivo in zebrafish (Grzegorski et al, 2014). As a control, we randomly sampled a set of 50,000 nucleotide contexts across TLSs within each vertebrate species. High‐ and medium‐confidence translated uORFs possess significantly better initiation contexts than background (Wilcoxon P = 6.76e‐20 (high), P = 4.74e‐24 (medium)) (Figs 4A and EV5A), and their AUG score was significantly correlated with uORF translation (5 hpf, r = 0.22, P < 2.2e‐16), as was AUG score for all uORFs in single‐uORF transcripts (Fig EV5B, r = 0.3, P < 2.2e‐16). To analyze the effect of uAUG context on repression, we selected uORFs in the top and bottom quintile of initiation context for all uORFs and compared the translation efficiency of their downstream CDS. We observed a negative correlation between uORF AUG score and downstream translation efficiency (r = −0.94, P = 5.15e‐5, Fig EV5C). Due to the fact that this score is based only on mononucleotide frequencies, high/low scores are more accurate predictors of initiation efficiency, so we then compared only the set of highest‐scoring uORFs versus the lowest‐scoring set of uORFs. uORFs with more favorable initiation context resulted in significantly lower translation efficiency of the downstream CDS (Wilcoxon P = 1.54e‐6, Fig 4B). These results indicate that the sequence/initiation context of upstream AUG codons is a significant factor in repression of uORF‐containing genes.
Figure 4. uORF sequence features are targets of selection.
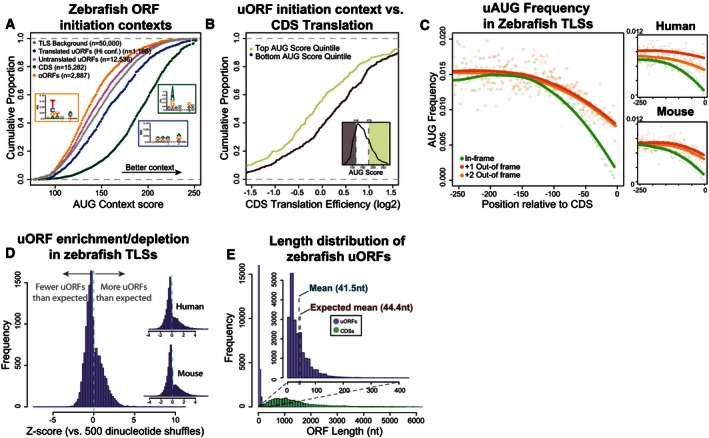
- uORF initiation contexts display signatures of selection. Plot displays cumulative distribution of AUG context scores calculated using nucleotide scoring matrices (Grzegorski et al, 2014) across multiple classes of ORFs (translated uORFs (high confidence), untranslated uORFs, CDS ORFs, and TLS background), with a higher score indicating better initiation context. TLS background represents the distribution of scores of a randomly sampled set of 50,000 sequences from zebrafish 5′ UTRs. Insets display sequence logos for CDSs, translated uORFs, and oORFs.
- uORF initiation context influences repression of downstream translation. Plot displays cumulative distribution of translation efficiency in transcripts with single uORFs in favorable initiation contexts (top quintile of all uORFs) versus unfavorable contexts (bottom quintile of all uORFs). Inset displays where these quintiles lie on the distribution of all uORF AUG scores.
- AUG frequency is lower proximal to the CDS start codon. Plot displays AUG frequency (as a fraction of all codons), split by frame relative to the CDS start codon. Points show frequencies at individual codon positions and loess regression lines display the overall trend.
- Vertebrate TLSs contain fewer uORFs than expected. Histograms show the distribution of z‐scores in zebrafish, mouse, and human TLSs, with positive z‐scores indicating uORF enrichment and negative z‐scores indicating uORF depletion, relative to sequence‐shuffled TLSs.
- uORFs are shorter than expected by chance. Histogram showing length distribution of all uORFs versus canonical protein‐coding regions, with inset providing a closer look at uORFs (bin size 10 nt). Vertical dotted lines indicate the observed mean length of endogeneous uORFs and the mean length of uORFs obtained by sequence shuffling of zebrafish TLSs, which differ significantly (two‐sided P < 4.5e‐308).
Figure EV5. AUG context and translation.

-
ACumulative plots show the distribution of initiation context scores in zebrafish for uORFs, oORFs, 3′ UTR ORFs (dORFs), and CDS, further broken down by their translation classification. The TLS background is calculated by scoring the nucleotide context around 50,000 randomly selected TLS positions.
-
BuORF AUG scores are significantly correlated with uORF translation in single‐uORF transcripts at 5 hpf in zebrafish (Pearson's r = 0.30, P < 2.2e‐16).
-
CuORF AUG scores are inversely correlated with downstream CDS translation in single‐uORF transcripts (Pearson's r = −0.094, P = 5.15e‐5).
-
D, ECumulative plots show the distribution of initiation context scores in (D) mouse and (E) human, for uORFs, oORFs, 3′ UTR ORFs (dORFs), and CDS. The TLS background is calculated by scoring the nucleotide context around 50,000 randomly selected TLS positions in each species.
uORFs and oORFs repress reporter expression
To validate that uORFs were indeed responsible for repression of downstream translation in vivo, we constructed a series of RNA reporters containing GFP with various uORF/oORF configurations in the TLS (no uORFs, 1 uORF, 3 uORFs, 1 oORF, or 1 uORF in weak initiation context) (Fig 5A). To control for possible contribution of other sequence effects, reporter sequences differed by only 1–3 nucleotides. All uORFs/oORFs had the same initiation context score (GATC…GA; 211) with the exception of the weak context reporter (GTTT…GA; 128). We co‐injected each reporter, with DsRed as an injection control, into 1‐cell embryos, and subsequently measured relative GFP/DsRed fluorescence. Repression of uORF‐containing reporters was clearly visible at 24 hpf (Fig 5B, Appendix Fig S2), and quantification of fluorescence revealed repression consistent with ribosome profiling of endogeneous genes (Fig 5C). Reporters with 1 uORF in strong or weak initiation context were both significantly repressed compared to the reporter lacking uORFs (two‐tailed, unpaired t‐test P = 3.21e‐9, P = 2.98e‐3, respectively). The same uORF in a strong initiation context versus a weak context was significantly more repressive (two‐tailed, unpaired t‐test P = 3.24e‐5). Multiple (3) uORFs were significantly more repressive than a single uORF (two‐tailed, unpaired t‐test P = 6.66e‐5), as was a single oORF (two‐tailed, unpaired t‐test P = 7.65e‐11). These results validate our observations based on ribosome profiling data and demonstrate that uORFs are potent regulators of protein production in vivo.
Figure 5. uORFs and oORFs repress downstream reporter translation.

- Schematic displays uORF/oORF configurations for reporter experiments. GFP reporters contained variable uORF configurations: no uORFs, 1 uORF, 3 uORFs, 1 oORF, or 1 uORF in weak initiation context. TLS length (104 nt) and polyA tail length (60A) were constant across all reporters, and TLS sequence differed only by single nucleotide changes at each uORF start codon (or two single nucleotide changes in the weak context reporter). Constructs (100 pg) were coinjected with dsRed (150 pg) into 1‐cell‐stage embryos and quantified at 24 hpf.
- Fluorescent microscopy images of representative embryos expressing each GFP reporter and the dsRed control 24 h post‐injection. uORFs and oORFs repress downstream translation as predicted by analysis of endogeneous transcripts. Repression is observed in reporters with uORF‐/oORF‐containing TLSs, but the effect is weaker for a uORF with a bad initiation context. Group pictures can be found in Appendix Fig S2.
- Bar plot displays fluorescence quantification of 24‐h embryos injected with each reporter. GFP fluorescence intensity was normalized to dsRed intensity in each embryo with robust dsRed expression, then mean fluorescence for each reporter was scaled relative to the no‐uORF reporter (the number of embryos measured for each reporter is displayed below the x‐axis). Error bars display ± SEM. Reporter fluorescence was compared using unpaired two‐tailed Student's t‐test and was significant for all comparisons: **P < 0.01—no uORFs versus 1 weak context uORF (P = 2.98e‐3); ****P < 0.0001—no uORF versus 1 uORF (P = 3.21e‐9), 1 uORF versus 3 uORFs (P = 6.66e‐5), 1 uORF versus 1 oORF (P = 7.65e‐11), 1 uORF versus 1 uORF weak context (P = 3.24e‐5).
Features that characterize repressive uORFs are targets of selection
Upstream open reading frames have been proposed to act broadly as repressors of CDS translation, yet translation of many of these downstream proteins is required for proper organismal function and development. We hypothesized that vertebrates have evolved to mitigate the effects of constitutively repressive uORFs, such that uORF activity can instead be modulated. This could manifest in several ways: general depletion of uORFs, enrichment of features that promote reinitiation after uORF translation, and regulation of initiation at uORF AUGs. Thus, we analyzed the zebrafish transcriptome for signs of selective pressure on uORF presence, on uORF features that influence repression, and on uORF initiation contexts.
Given that uORF number is linked to repressive activity, we next determined whether vertebrate TLSs are relatively enriched/depleted of uORFs. We compared the distribution of uORF numbers in endogeneous TLSs to a control set, where each TLS sequence was shuffled 500 times, preserving dinucleotide frequencies. We observed an overall depletion of uORFs in the TLSs of zebrafish, mouse, and human coding genes (mean z‐score < 0) (Fig 4D). The depletion/enrichment z‐score for each TLS was significantly correlated between mammalian one‐to‐one homologs (Pearson's r = 0.39, P < 2.2e‐16), indicating that uORF richness is not lost between mammalian species. Interestingly, a subset of transcripts had significantly high z‐scores (> 1.96) indicating specific enrichment of uORFs. We propose that these transcripts are potentially under stronger uORF regulation and are thus prime candidates for future study. Next, we analyzed the length distribution of uORFs across vertebrate species. uORFs are short compared to CDS regions, with a mean length of < 60 nt in all species (Fig 4E). To determine the expected uORF length, we shuffled each species TLS transcriptome 500 times, preserving dinucleotide frequencies. We observed that uORFs are significantly shorter than expected by chance in human, mouse, and zebrafish (Appendix Fig S3A and B; 2‐sided normal P = 3.04e‐164, P = 2.09e‐302, P < 4.5e‐308, respectively), indicating a depletion of long ORFs across vertebrates.
Start codons proximal to the CDS region are more likely to initiate oORFs, which are associated with strong translational repression, so we examined the positional distribution of upstream start codons (uAUGs) relative to the CDS. We observed positional biases of uORFs and uAUGs: regardless of relative frame, there was a notable depletion of uAUGs proximal to the CDS start codon (Fig 4C). This bias, consistent with prior computational study (Iacono et al, 2005), was also present in human and mouse (Fig 4C). If well‐translated ORFs have indeed been selected for reinitiation, we would expect that sequence characteristics implicated in reinitiation efficiency (intercistronic distance and uORF length) should be linked to uORF translation levels. Indeed, at 5 hpf in zebrafish, uORF TE is inversely correlated with uORF length (r = −0.223, P = 1.0e‐92) suggesting pressure to maintain efficient reinitiation after well‐translated uORFs.
We next evaluated the sequence composition around uORF start codons to determine whether selection had acted upon their initiation contexts. Though a fraction of uORFs are present in favorable contexts, the majority of zebrafish uORFs have a lower AUG score than CDSs, with 20% of zebrafish uORFs scoring as high as the median score for a CDS AUG (Fig 4A). Human and mouse uORFs displayed similarly unfavorable initiation contexts (Fig EV5D and E). Because ribosomes cannot reinitiate downstream of oORFs to translate a full CDS region, their repression must be controlled primarily through translation initiation. Thus, selection against favorable oORF initiation contexts could allow control at the initiation level over otherwise‐constitutive repression. Indeed, zebrafish oORFs have significantly less favorable initiation contexts that would be expected by chance (Figs 4A and EV5A, Wilcoxon P = 8.74e‐55). These results, combined with signatures of selection on other sequence features, indicate that uORFs are under evolutionary selection for features likely to prevent constitutive repression and facilitate modulation of their activity.
uORF‐CDS relationship is conserved in vertebrates
Next we asked whether the activity of uORF‐containing TLSs is conserved across species. To this end, we identified orthologs between mouse and human based on Ensembl one‐to‐one homology mapping (Cunningham et al, 2014). As a measurement of activity, we calculated the ratio of ribosome footprints in the TLS to those in the CDS for each gene (Fig 6A), applying minimal thresholds to TLS length (100 nt) in both species to account for misannotation of transcription start sites. To establish a background, we shuffled TLS‐CDS pairings within species, maintaining CDS pairings across species, to ensure any observed effect did not simply arise from conservation of CDS composition/features. We observed significant correlation across similar cell/tissue types between species (fibroblasts r = 0.486, P < 2.2e‐16, Fig 6B; brain r = 0.423, P < 2.2e‐16, Fig 6D). These were more correlated than the baseline of shuffled TLS‐CDS pairs (fibroblasts r = 0.093, P < 2.2e‐16, Fig 6C; brain r = 0.128, P < 2.2e‐16, Fig 6E), indicating that not just expression/CDS translation, but also the specific relationship between TLS translation and CDS translation, is conserved. These results indicate that uORF activity tends to be conserved at the level of individual genes across vertebrate species.
Figure 6. uORF regulatory activity is conserved across vertebrates.

-
ACartoon shows strategy for investigating conservation of uORF regulatory activity. The ratio of translation between the TLS and CDS is calculated and compared between 1‐to‐1 homologs in the same tissue type across species.
-
B–EuORF activity is correlated across species. Scatterplots display the translation ratio comparison between the same transcripts (TLS length > 100 nt, 1‐1 mouse–human homology) in fibroblasts (BJF cells in human: sample bjf2, MEF cells in mouse: sample mef2wt) (B) and brain (samples hbrainwt and brainwt) (D). The correlation between species is not due to CDS signal correlation. Scatterplots (C, E) display the translation ratio comparison between homologous transcripts (TLS length > 100 nt, 1‐1 mouse–human homology) in fibroblasts (B) and brain (D), maintaining CDS pairings while shuffling which TLS is associated with each CDS.
Discussion
Our analysis of upstream open reading frames across three vertebrate species reveals five key insights into the extent and role of vertebrate upstream open reading frames. First, uORFs are prevalent features in the TLS, with 46–60% of genes containing at least one uORF or oORF across the vertebrate species studied. This abundance, consistent with previous predictions (Calvo et al, 2009; Ye et al, 2015), underscores the need for functional study of vertebrate uORFs. We leveraged the power of in vivo ribosome profiling data to determine which of these uORFs are translated. A significant number of zebrafish uORFs (61%) display signatures of active translation (low, medium, and high confidence), which is likely an underestimate since our analysis is restricted to a limited set of time points and developmental stages. These results indicate that a large fraction of the transcriptome is under the influence of uORFs.
Second, uORFs carry out broad repression of downstream translation. The large majority of uORF peptide sequences do not appear to be conserved, though a set of 18 translated, conserved uORFs in zebrafish warrants future study. Because their transcription is inherently linked to the rest of their transcriptional unit, uORF‐encoded peptides share genomic regulatory control with their downstream protein with potentially interesting biological implications. We do not rule out function of some of the peptides encoded by uORFs; indeed, functional uORF‐encoded peptide sequences have been identified in Arabidopsis (Rahmani et al, 2009; Ebina et al, 2015). The function of uORF amino acid sequences could also reside in individual inefficient codons, which when translated could lead to loss of mRNA stability (Presnyak et al, 2015). We observed that the presence of uORFs predominantly results in lower CDS translation. Reporters containing uORFs and oORFs in various configurations validated the repressive effects of uORFs and oORFs in vivo. The regulatory effect of uORFs on translation is at least equivalent to that of a strongly repressive microRNA, exemplified by a comparison to miR‐430, a microRNA that broadly represses translation of maternal mRNAs during embryonic development (Giraldez et al, 2006; Bazzini et al, 2012; Subtelny et al, 2014), indicating the potency of regulation mediated by uORFs. Our analysis of protein translation downstream of uORFs revealed that uORFs drive widespread repression in multiple species, supporting uORFs as a physiologically relevant, widespread regulatory mechanism in vertebrates.
Third, sequence features modulate the regulatory capacity of uORFs. The relative repression of uORF‐containing genes is more pronounced when the ORF overlaps the translation start site of the CDS. Extending this phenomenon, we found that intercistronic distance influences the degree of observed repression, likely due to its effect on reinitiation efficiency (Kozak, 1987b). Beyond reinitiation, we were further able to link the regulatory activity of uORFs to their translation and implicate their initiation sequence contexts as strong determinants of uORF repression both endogenously and in injected reporters. The initiation context is strongly linked to uORF activity, and given the multiple mechanisms that can control translation initiation stringency (Jackson et al, 2010), this provides a resourceful means by which cells could modulate the repressive activity of uORFs/oORFs during development and physiological responses. Another layer of uORF regulation may be encoded in RNA structure surrounding upstream initiation codons—RNA structures can control initiation efficiency (Wan et al, 2011), and structured RNA segments may be skipped by ribosome via shunting (Hemmings‐Mieszczak et al, 2000; Paek et al, 2012). Given the correlation of individual uORF features with translation repression, it may be possible with further study to derive a multi‐feature predictor that will pinpoint the most repressive TLSs for future investigation in vivo. Based on our genomics and reporter analysis, we predict that uORF number, initiation context, and the presence of oORF will likely have the strongest contributions to CDS regulation in such a model. Specific combinations of uORF sequence features could also be used to better tune gene expression in synthetic constructs (Ferreira et al, 2013). Our results provide evidence that this widespread regulatory phenomenon depends on sequence features, which will help to identify clinically relevant uORFs and serve as an entry point to define their biological function in the context of human disease.
Fourth, beyond effects on translation, we also observed a link between uORF presence and steady‐state mRNA levels: transcripts with uORFs tend to have lower mRNA levels that those without, correlating with the number of uORFs present. This might be related to an engagement of NMD (He et al, 2003; Hurt et al, 2013). Conversely, efficient translation of the protein‐coding region has been implicated as a major factor in maintaining RNA stability (Huch & Nissan, 2014; Presnyak et al, 2015), so uORF regulation of steady‐state RNA level could also arise as an effect of translational repression. These findings also have implications for the study of long non‐coding RNAs, many of which contain short translated ORFs similar to uORFs (Chew et al, 2013; Guttman et al, 2013; Bazzini et al, 2014) that could control their expression in a similar manner.
Finally, we observed conservation of uORF activity across vertebrates, and signatures of selective pressure on the sequence features that influence it. We have shown correlation of the UTR‐CDS translation relationship between homologous genes across species, indicating the preservation of uORF‐mediated regulatory programs. Across species, uORFs are sparser, shorter, further away from protein‐coding regions, and in unfavorable sequence contexts for translation initiation. Our analysis has also identified a set of genes that is particularly enriched for uORFs, an indication of possible regulatory activity. The selective biases we have observed indicate pressure against uORF features that make the ribosome less competent for downstream translation (Kozak, 1987b, 2001; Pöyry et al, 2004), allowing for greater regulatory control through tuning of the translational environment (Jackson et al, 2010). This partially resolves the conundrum of how potentially repressive uORFs could be so widespread, while still allowing translation of the full complement of vertebrate protein‐coding genes across conditions.
One question that remains is how the regulatory effects of uORFs are modulated in different tissues/conditions, and which processes are most affected. It is possible that regulation occurs via changes in the balance of initiation factors. This mode of regulation has already been implicated in the cellular stress response through eIF2 (Vattem & Wek, 2004; Alves et al, 2009; Palam et al, 2011; Andreev et al, 2015). Recent discoveries have also shown that eukaryotic initiation factors 1 and 5 modulate start codon selection stringency (Maduzia et al, 2010; Loughran et al, 2012), and other factors such as eIF3 and DENR may play a role in determining reinitiation efficiency after uORF translation (Roy et al, 2010; Skabkin et al, 2010; Zhou et al, 2010; Schleich et al, 2014). The regulation of initiation and reinitiation factors may explain the regulatory differences observed between the cell types studied here. uORF repression could also be controlled at the transcriptional level, by modulating TSS usage to differentially include uORFs between different cell types and states (Calkhoven et al, 2000; Bastide et al, 2008). In preliminary observations, we have identified at least 91 known TSS changes in the maternal–zygotic transition (Haberle et al, 2014) that add or eliminate uORFs. Similar transcriptional differences are likely to control uORF activity across a variety of conditions.
In sum, we have identified thousands of translated uORFs, across vertebrate species, and the features that drive their conserved function. Our results define a pervasive cis‐regulatory code within transcribed leader sequences, where uORFs have widespread and conserved functions in regulating translation, shaping gene expression across the vertebrate transcriptome.
Materials and Methods
RNA‐seq sample collection
Twenty embryos were collected from the same clutch from where the ribosome profiling time series was conducted (Bazzini et al, 2014). Total RNA was isolated using 1 ml of Trizol following manufacturer instructions. Ribosomal RNAs were depleted using Ribo‐Zero (Epicentre/Illumina). Libraries were prepared and sequenced in an Illumina Hi‐SEQ, single end, 75 nt reads.
Transcript annotation processing
Zebrafish Ensembl and RefSeq transcriptome annotations were downloaded from Ensembl FTP (release 74; Cunningham et al, 2014) and UCSC. Ensembl genes were filtered for protein‐coding transcripts on autosomes (and sex chromosomes in the case of human and mouse, excluding scaffolds) and merged with RefSeq annotations, eliminating redundant transcript models in which all splice junctions were identical by selecting the version with the most genomically upstream TSS. Transcripts with ambiguous gene IDs (non‐unique mapping from RefSeq transcript ID to Ensembl geneID) were filtered out. Human and mouse Ensembl transcript annotations were downloaded from Ensembl FTP (release 80). Ensembl genes were filtered for protein‐coding transcripts, eliminating redundant transcript models in which all splice junctions were identical by selecting the version with the most genomically upstream TSS. For downstream analysis, the transcript for each gene with the highest maximum RNA expression (RPKM) across all samples in a species was selected. If multiple transcripts for a gene shared the same expression level, the following factors were used to break the tie: the most genomically upstream translation start site relative to the gene orientation, then the longest 5′ UTR, then the gene ID.
Sequencing data processing
Human and mouse RPF/RNASeq data were retrieved from the repositories detailed in Table EV3. Human and mouse RPFs and input samples were first trimmed by searching appropriate adapter sequence requiring 100% match of the first five base pairs and a minimum similarity of 80%. polyA samples from Ingolia et al (2011) were trimmed using a polyA sequence instead of adapter sequence. Zebrafish samples were trimmed by aligning read sequences, requiring 100% match of the first five base pairs and a minimum global alignment score of 60 (matches: 5, mismatches: −4, gap opening: −7, gap extension: −7, cost‐free ends gaps). Reads from mRNA‐Seq samples were not trimmed. Zebrafish, human, and mouse reads were then aligned strand specifically to genome Zv9, GRCh38, GRCm38, respectively, using STAR version 2.4.2a (Dobin et al, 2013) with the following non‐default parameters (outQSconversionAdd option was used to indicate each sample quality scores): –alignEndsType EndToEnd –outFilterMultimapNmax 100 –seedSearchStartLmax 30 –sjdbScore 10. Genomic sequence indices for STAR were built including exon‐junction coordinates from Ensembl r74. RPKMs (Read Per Kb and per Million reads) were computed by summing the total number of reads overlapping the feature (transcript/ORF) by a minimum of 10 nucleotides, including reads matching up to five times in the genome (each mapping site counting 1/n, n = number of mapping sites), and combining replicates for each sample. ORFscore calculations in zebrafish exclude the reads contributed by ribosomes at the start and stop codon (more detail is provided in Bazzini et al, 2014). For TLS read counting, an 18‐nt minimum overlap was required to exclude RPFs from the CDS start codon. Translation efficiency of ORFs was calculated by dividing RPF expression (RPKM) by mRNA expression (RPKM) using the normalized mRNA expression of the entire transcript to avoid length effects due to small uORFs. For all time point‐/sample‐specific analyses and graphs, a minimal RNA level threshold of 0.5 RPKM was applied to exclude non‐expressed transcripts.
Metagene analyses
For each zebrafish transcript group shown in Fig 1A, metagene plots were generated by counting 28 and 29 nt RPF reads at each position. Each read was represented by the single nucleotide at their P‐site (+12) for start codon regions and A‐site (+15) for stop codon regions. So that a few strongly expressed features did not bias the metagene profiles, read counts were normalized per feature (ORF) by dividing each position's count by the sum of all reads in that window, and these normalized counts were then summed across all features.
ORF discovery
After extracting the sequence of each spliced transcript, we defined all possible stop codons in all three reading frames. We defined the ORF for each stop codon as the region between it and the most distal in‐frame start codon with no intervening stop. ORFs were stored in genomic and transcript‐relative coordinates and classified by their relation to the annotated CDS. Upstream open reading frames (uORFs) were defined as ORFs with a stop codon upstream of the annotated CDS of a given transcript, and overlapping open reading frames (oORFs) were defined as ORFs with a start codon upstream of the annotated CDS AUG but a stop codon downstream of the CDS AUG.
AUG context score calculations
For each ORF‐initiation AUG, the four nucleotides upstream, and two nucleotides downstream (−4 ‐> +5) were isolated, excluding the AUG itself. The AUG context score for each ORF was calculated by summing the frequency values for each of these nucleotide in the species‐specific scoring matrices provided by Grzegorski et al (Grzegorski et al, 2014). TLS background scores were calculated by randomly sampling (with replacement) 50,000 TLS regions and a random position within each TLS, then calculating the context score of the nucleotides surrounding each selected position.
Peptide sequence conservation analysis
uORFs were first filtered for ORFs at least 10 aa in size. The teleost phylogenetic tree was downloaded from UCSC (http://hgdownload-test.cse.ucsc.edu/goldenPath/danRer7/multiz8way/) and reduced to 5 fish species—fugu, medaka, stickleback, tetraodon, and zebrafish. ORF coordinates were used to extract and stitch multiple alignment files for each ORF via CodAlignView (“CodAlignView: a tool for visualizing protein‐coding constraint”, I Jungreis, M Lin, M Kellis, in preparation) with the following options for zebrafish: alnset=danRer7 ancestor=None; species=‐X_Tropicalis,Mouse,Human; wrap=0; fastaOut=True and the following for mammals: alnset=[mm10_60_29mammals/hg19] ancestor=None; wrap=0; fastaOut=True. Resulting FASTA files were preprocessed to remove empty lines and illegal characters, then input to phyloCSF (Lin et al, 2011) with the following arguments for zebrafish: 5fish –strategy omega –files [fileList] –minCodons=10 –removeRefGaps. And the following options for mammals: 29mammals –strategy omega –files [fileList] –minCodons=10 –removeRefGaps. ORFs were considered meaningfully conserved if they had a phyloCSF score of at least 50 as in (Pauli et al, 2012; Bazzini et al, 2014), and weakly conserved if they had a phyloCSF score > 0. In mammals, PhyloCSF was also run with the default MLE strategy, but no major difference was observed in the proportion of uORFs conserved. Enrichment of conservation in high‐confidence translated uORFs was calculated by computing a log‐odds ratio between the percentages of conserved uORFs in all uORFs versus the confidently translated uORF subset.
uORF frequency analysis
For ORF frequency analysis, a modified version of the dishuffle script [an implementation of the Altschul‐Erikson shuffling algorithm (Altschul & Erickson, 1985)] from Clote et al (2005) was used to shuffle each zebrafish TLS 500 times and count ORFs in each resulting shuffled TLS set (using the same ORF‐finding method as mentioned in the “ORF discovery” section). Z‐scores were calculated for each TLS by subtracting the mean of the resulting distribution from the observed number of uORFs in the endogeneous TLS, then dividing by the standard deviation.
uORF length analysis
For ORF length analysis, a modified version of the dishuffle script [an implementation of the Altschul‐Erikson shuffling algorithm (Altschul & Erickson, 1985)] from Clote et al (Clote et al, 2005) was used to shuffle each zebrafish TLS and return the length of each ORF in all resulting shuffled TLSs. This was repeated 500 times, resulting in a mean uORF length for each of 500 shuffled ‘transcriptomes’. The endogenous mean uORF length was then compared against the distribution of mean uORF lengths from the shuffled transcriptomes, and two‐sided P‐value calculated using the R pnorm function.
uORF positional bias
To measure positional AUG depletion, the sequence of zebrafish TLSs was searched for all instances of AUG codons. The relative AUG frequency for each position relative to the CDS was calculated by dividing the number of AUGs found at that position by the total number of TLSs that covered that position to normalize for TLS coverage (due to the length distribution of TLSs, positions further from the CDS AUG are covered by fewer TLSs). Local regression lines were predicted using the R loess function.
Conservation of uORF activity
Homology information was downloaded from Ensembl Biomart (http://www.ensembl.org/biomart/) and uORFs with ‘one2one’ direct homology mapping between human and mouse were selected. Within this set, transcripts were filtered for a minimum 100 nt TLS length in each species to remove annotation artifacts. The repressive activity was then calculated by taking the ratio of translation efficiency of the TLS as a whole versus the translation efficiency of the CDS. As a control, TLSs were randomly assigned a CDS (without replacement) and the same ratio was calculated and compared across species.
Reporter design/generation
A synthetic TLS was designed by modifying the sequence of the zebrafish beta‐globin (hbbe1.1) 5′ UTR to remove endogeneous stop codons, add uORF stop codons and placeholder start codons, and add flanking regions containing the SP6 promoter (5′) and GFP overlap (3′)—see Table EV2 for more details. This ultramer primer (fp1) was used to amplify GFP adding a neutral 3′ UTR based on the Illumina 3′ sequencing adapter with a reverse primer (rp1) (Table EV2). The resulting product was purified, cloned into the pCRII‐TOPO plasmid using the TOPO TA cloning kit (ThermoFisher Scientific), and individual colonies were sequenced. A sequence‐confirmed colony was used as a template and amplified with primers fp2‐fp5 & rp1 to generate modified reporter versions with varying uORF configurations (Table EV2, Fig 5A). PCR products were purified and cloned into the pCRII‐TOPO plasmid using the TOPO TA cloning kit (ThermoFisher Scientific), and individual colonies were sequenced. All five TOPO plasmid versions containing sequence‐confirmed reporter constructs were then digested with EcoR1‐HF (NEB) and the reporter templates purified. These templates were used for a final amplification with primers fp_sp6 and rp2 to add a hardcoded 60A polyA tail. The resulting PCR products were gel‐purified and used as template for in vitro transcription using the SP6 mMessage mMachine kit (ThermoFisher) to generate reporter mRNA.
Reporter injection and quantification
One nanoliter of a solution of GFP reporter mRNA at 0.1 μg/μl and DsRed mRNA (as an injection control) at 0.15 μg/μl was injected into wild‐type zebrafish embryos at the one‐cell stage. Reporter expression was quantified in ImageJ (Abràmofff et al, 2005) by comparing the average pixel intensity of GFP to DsRed in each reporter‐injected embryo at 24 hpf. All images were taken at the same magnification/exposure settings minimizing saturated pixels. Background‐corrected total fluorescence of GFP and DsRed in each embryo was calculated by measuring pixel intensity in raw images in a rectangle around each individual embryo, using the formula CTF = Integrated Density − (Area of selected cell X Mean fluorescence of three background readings). All embryos that passed a minimal DsRed expression threshold of 35 CTF were included in quantification. GFP intensity was normalized to DsRed intensity for each embryo by dividing, and then all samples were normalized to the no‐uORF reporter. For presentation in Fig 5B, respective color channels for each fluorescent protein (GFP—green; DsRed—red) were isolated in ImageJ, and brightness of the GFP image was increased linearly for visual clarity (Min 5, Max 168).
Data deposition
RNA‐seq data were deposited in SRA archive SRA314809. Zebrafish ribosome profiling data was previously published and can be found in GEO repository GSE53693.
Author contributions
TGJ, AAB, and AJG conceived of the project. AAB performed sequencing experiments. TGJ designed and performed the data analysis with input from AAB and AJG. TGJ performed reporter experiments with input from AAB and AJG. TGJ wrote the paper with input from AJG and AAB.
Conflict of interest
The authors declare that they have no conflict of interest.
Supporting information
Appendix
Expanded View Figures PDF
Table EV1
Table EV2
Table EV3
Dataset EV1
Dataset EV2
Dataset EV3
Review Process File
Acknowledgements
We thank Charles Vejnar and Miler Lee for technical support and statistical advice, Valeria Yartseva for reagents, Miler Lee for comments on the text, and the rest of the Giraldez laboratory for their contributions. We thank Irwin Jungreis for support preparing alignments for PhyloCSF. This work was supported by the National Institute of Health T32GM007499 (TGJ), R01GM081602‐07 (AJG), R01GM103789‐03 (AJG), R01HD074078‐03 (AJG), the Pew Fellows Program in Biomedical Sciences (AAB), the Pew Scholars Program in the Biomedical Sciences (AJG), the March of Dimes (AJG), and the Yale Scholars Program (AJG).
The EMBO Journal (2016) 35: 706–723
See also: AM McGeachy & NT Ingolia (April 2016)
References
- Abràmofff MD, Magalhães PJ, Ram SJ (2005) Image processing with ImageJ. Biophoton Int 11: 36–43 [Google Scholar]
- Altschul SF, Erickson BW (1985) Significance of nucleotide sequence alignments: a method for random sequence permutation that preserves dinucleotide and codon usage. Mol Biol Evol 2: 526–538 [DOI] [PubMed] [Google Scholar]
- Alves VS, Motta FL, Roffé M, Delamano A, Pesquero JB, Castilho BA (2009) GCN2 activation and eIF2alpha phosphorylation in the maturation of mouse oocytes. Biochem Biophys Res Commun 378: 41–44 [DOI] [PubMed] [Google Scholar]
- Ambros V (2004) The functions of animal microRNAs. Nature 431: 350–355 [DOI] [PubMed] [Google Scholar]
- Andreev DE, O'Connor PB, Fahey C, Kenny EM, Terenin IM, Dmitriev SE, Cormican P, Morris DW, Shatsky IN, Baranov PV (2015) Translation of 5′ leaders is pervasive in genes resistant to eIF2 repression. Elife 4: e03971 [DOI] [PMC free article] [PubMed] [Google Scholar]
- Barbosa C, Peixeiro I, Romão L (2013) Gene expression regulation by upstream open reading frames and human disease. PLoS Genet 9: e1003529 [DOI] [PMC free article] [PubMed] [Google Scholar]
- Barbosa C, Gene D (2014) Upstream open reading frames and human genetic disease. In: eLS John Wiley & Sons, Ltd: Chichester: [Google Scholar]
- Bartel DP (2009) MicroRNAs: target recognition and regulatory functions. Cell 136: 215–233 [DOI] [PMC free article] [PubMed] [Google Scholar]
- Bastide A, Karaa Z, Bornes S, Hieblot C, Lacazette E, Prats H, Touriol C (2008) An upstream open reading frame within an IRES controls expression of a specific VEGF‐A isoform. Nucleic Acids Res 36: 2434–2445 [DOI] [PMC free article] [PubMed] [Google Scholar]
- Bazzini A, Lee M, Giraldez AJ (2012) Ribosome profiling shows that miR‐430 reduces translation before causing mRNA decay in zebrafish. Science 336: 13–17 [DOI] [PMC free article] [PubMed] [Google Scholar]
- Bazzini AA, Johnstone TG, Christiano R, Mackowiak SD, Obermayer B, Fleming ES, Vejnar CE, Lee MT, Rajewsky N, Walther TC, Giraldez AJ (2014) Identification of small ORFs in vertebrates using ribosome footprinting and evolutionary conservation. EMBO J 33: 981–993 [DOI] [PMC free article] [PubMed] [Google Scholar]
- Beaudoin JD, Perreault JP (2010) 5′‐UTR G‐quadruplex structures acting as translational repressors. Nucleic Acids Res 38: 7022–7036 [DOI] [PMC free article] [PubMed] [Google Scholar]
- Brar GA, Yassour M, Friedman N, Regev A, Ingolia NT, Weissman JS (2012) High‐resolution view of the yeast meiotic program revealed by ribosome profiling. Science 335: 552–557 [DOI] [PMC free article] [PubMed] [Google Scholar]
- Bugaut A, Balasubramanian S (2012) 5′‐UTR RNA G‐quadruplexes: translation regulation and targeting. Nucleic Acids Res 40: 4727–4741 [DOI] [PMC free article] [PubMed] [Google Scholar]
- Calkhoven CF, Muller C, Leutz A (2000) Translational control of C/EBPa and C/EBPb isoform expression. Genes Dev 14: 1920–1932 [PMC free article] [PubMed] [Google Scholar]
- Calvo SE, Pagliarini DJ, Mootha VK (2009) Upstream open reading frames cause widespread reduction of protein expression and are polymorphic among humans. Proc Natl Acad Sci USA 106: 7507–7512 [DOI] [PMC free article] [PubMed] [Google Scholar]
- Castello A, Fischer B, Eichelbaum K, Horos R, Beckmann BM, Strein C, Davey NE, Humphreys DT, Preiss T, Steinmetz LM, Krijgsveld J, Hentze MW (2012) Insights into RNA biology from an atlas of mammalian mRNA‐binding proteins. Cell 149: 1393–1406 [DOI] [PubMed] [Google Scholar]
- Chatterjee S, Berwal SK, Pal JK (2010) Pathological mutations in 5′ untranslated regions of human genes. In: Encyclopedia of Life Sciences (ELS). John Wiley & Sons, Ltd: Chichester: [Google Scholar]
- Chew G‐L, Pauli A, Rinn JL, Regev A, Schier AF, Valen E (2013) Ribosome profiling reveals resemblance between long non‐coding RNAs and 5′ leaders of coding RNAs. Development 2834: 2828–2834 [DOI] [PMC free article] [PubMed] [Google Scholar]
- Clote P, Ferré F, Kranakis E, Krizanc D (2005) Structural RNA has lower folding energy than random RNA of the same dinucleotide frequency. RNA 11: 578–591 [DOI] [PMC free article] [PubMed] [Google Scholar]
- Crappé J, Van Criekinge W, Trooskens G, Hayakawa E, Luyten W, Baggerman G, Menschaert G (2013) Combining in silico prediction and ribosome profiling in a genome‐wide search for novel putatively coding sORFs. BMC Genom 14: 648 [DOI] [PMC free article] [PubMed] [Google Scholar]
- Cunningham F, Amode MR, Barrell D, Beal K, Billis K, Brent S, Carvalho‐Silva D, Clapham P, Coates G, Fitzgerald S, Gil L, Giron CG, Gordon L, Hourlier T, Hunt SE, Janacek SH, Johnson N, Juettemann T, Kahari AK, Keenan S et al (2014) Ensembl 2015. Nucleic Acids Res 43: D662–D669 [DOI] [PMC free article] [PubMed] [Google Scholar]
- Dobin A, Davis CA, Schlesinger F, Drenkow J, Zaleski C, Jha S, Batut P, Chaisson M, Gingeras TR (2013) STAR: ultrafast universal RNA‐seq aligner. Bioinformatics 29: 15–21 [DOI] [PMC free article] [PubMed] [Google Scholar]
- Ebina I, Takemoto‐Tsutsumi M, Watanabe S, Koyama H, Endo Y, Kimata K, Igarashi T, Murakami K, Kudo R, Ohsumi A, Noh AL, Takahashi H, Naito S, Onouchi H (2015) Identification of novel Arabidopsis thaliana upstream open reading frames that control expression of the main coding sequences in a peptide sequence‐dependent manner. Nucleic Acids Res 43: 1562–1576 [DOI] [PMC free article] [PubMed] [Google Scholar]
- Fernandez J, Yaman I, Huang C, Liu H, Lopez AB, Komar AA, Caprara MG, Merrick WC, Snider MD, Kaufman RJ, Lamers WH, Hatzoglou M (2005) Ribosome stalling regulates IRES‐mediated translation in eukaryotes, a parallel to prokaryotic attenuation. Mol Cell 17: 405–416 [DOI] [PubMed] [Google Scholar]
- Ferreira JP, Overton KW, Wang CL (2013) Tuning gene expression with synthetic upstream open reading frames. Proc Natl Acad Sci USA 110: 11284–11289 [DOI] [PMC free article] [PubMed] [Google Scholar]
- Filipowicz W, Bhattacharyya SN, Sonenberg N (2008) Mechanisms of post‐transcriptional regulation by microRNAs: are the answers in sight? Nat Rev Genet 9: 102–114 [DOI] [PubMed] [Google Scholar]
- Gao X, Wan J, Liu B, Ma M, Shen B, Qian S‐B (2014) Quantitative profiling of initiating ribosomes in vivo . Nat Methods 12: 147–153 [DOI] [PMC free article] [PubMed] [Google Scholar]
- Giraldez AJ, Mishima Y, Rihel J, Grocock RJ, Van Dongen S, Inoue K, Enright AJ, Schier AF (2006) Zebrafish MiR‐430 promotes deadenylation and clearance of maternal mRNAs. Science 312: 75–79 [DOI] [PubMed] [Google Scholar]
- Glisovic T, Bachorik JL, Yong J, Dreyfuss G (2008) RNA‐binding proteins and post‐transcriptional gene regulation. FEBS Lett 582: 1977–1986 [DOI] [PMC free article] [PubMed] [Google Scholar]
- Gonzalez C, Sims JS, Hornstein N, Mela A, Garcia F, Lei L, Gass DA, Amendolara B, Bruce JN, Canoll P, Sims PA (2014) Ribosome profiling reveals a cell‐type‐specific translational landscape in brain tumors. J Neurosci 34: 10924–10936 [DOI] [PMC free article] [PubMed] [Google Scholar]
- Goss DJ, Theil EC (2011) Iron responsive mRNAs: a family of Fe 2+ sensitive riboregulators. Acc Chem Res 44: 1320–1328 [DOI] [PMC free article] [PubMed] [Google Scholar]
- Grzegorski SJ, Chiari EF, Robbins A, Kish PE, Kahana A (2014) Natural variability of Kozak sequences correlates with function in a zebrafish model. PLoS ONE 9: e108475 [DOI] [PMC free article] [PubMed] [Google Scholar]
- Guo H, Ingolia NT, Weissman JS, Bartel DP (2010) Mammalian microRNAs predominantly act to decrease target mRNA levels. Nature 466: 835–840 [DOI] [PMC free article] [PubMed] [Google Scholar]
- Guttman M, Russell P, Ingolia NT, Weissman JS, Lander ES (2013) Ribosome profiling provides evidence that large noncoding RNAs do not encode proteins. Cell 154: 1–12 [DOI] [PMC free article] [PubMed] [Google Scholar]
- Guydosh NR, Green R (2014) Dom34 rescues ribosomes in 3′ untranslated regions. Cell 156: 950–962 [DOI] [PMC free article] [PubMed] [Google Scholar]
- Haberle V, Li N, Hadzhiev Y, Plessy C, Previti C, Nepal C, Gehrig J, Dong X, Akalin A, Suzuki AM, van IJcken WFJ, Armant O, Ferg M, Strähle U, Carninci P, Müller F, Lenhard B (2014) Two independent transcription initiation codes overlap on vertebrate core promoters. Nature 507: 381–385 [DOI] [PMC free article] [PubMed] [Google Scholar]
- Hafner M, Landthaler M, Burger L, Khorshid M, Hausser J, Berninger P, Rothballer A, Ascano M, Jungkamp AC, Munschauer M, Ulrich A, Wardle GS, Dewell S, Zavolan M, Tuschl T (2010) Transcriptome‐wide identification of RNA‐binding protein and microRNA target sites by PAR‐CLIP. Cell 141: 129–141 [DOI] [PMC free article] [PubMed] [Google Scholar]
- He F, Li X, Spatrick P, Casillo R, Dong S, Jacobson A (2003) Genome‐wide analysis of mRNAs regulated by the nonsense‐mediated and 5′ to 3′ mRNA decay pathways in yeast. Mol Cell 12: 1439–1452 [DOI] [PubMed] [Google Scholar]
- Hemmings‐Mieszczak M, Hohn T, Preiss T (2000) Termination and peptide release at the upstream open reading frame are required for downstream translation on synthetic shunt‐competent mRNA leaders. Mol Cell Biol 20: 6212–6223 [DOI] [PMC free article] [PubMed] [Google Scholar]
- Huch S, Nissan T (2014) Interrelations between translation and general mRNA degradation in yeast. Wiley Interdiscip Rev RNA 5: 747–763 [DOI] [PMC free article] [PubMed] [Google Scholar]
- Hurt JA, Robertson AD, Burge CB (2013) Global analyses of UPF1 binding and function reveal expanded scope of nonsense‐mediated mRNA decay. Genome Res 23: 1636–1650 [DOI] [PMC free article] [PubMed] [Google Scholar]
- Iacono M, Mignone F, Pesole G (2005) uAUG and uORFs in human and rodent 5′ untranslated mRNAs. Gene 349: 97–105 [DOI] [PubMed] [Google Scholar]
- Ingolia NT, Ghaemmaghami S, Newman JRS, Weissman JS (2009) Genome‐wide analysis in vivo of translation with nucleotide resolution using ribosome profiling. Science 324: 218–223 [DOI] [PMC free article] [PubMed] [Google Scholar]
- Ingolia NT, Lareau LF, Weissman JS (2011) Ribosome profiling of mouse embryonic stem cells reveals the complexity and dynamics of mammalian proteomes. Cell 147: 789–802 [DOI] [PMC free article] [PubMed] [Google Scholar]
- Ingolia NT, Brar GA, Stern‐Ginossar N, Harris MS, Talhouarne GJS, Jackson SE, Wills MR, Weissman JS (2014) Ribosome profiling reveals pervasive translation outside of annotated protein‐coding genes. Cell Rep 8: 1365–1379 [DOI] [PMC free article] [PubMed] [Google Scholar]
- Ivshina M, Lasko P, Richter JD (2014) Cytoplasmic polyadenylation element binding proteins in development, health, and disease. Annu Rev Cell Dev Biol 30: 393–415 [DOI] [PubMed] [Google Scholar]
- Jackson RJ, Hellen CUT, Pestova TV (2010) The mechanism of eukaryotic translation initiation and principles of its regulation. Nat Rev Mol Cell Biol 11: 113–127 [DOI] [PMC free article] [PubMed] [Google Scholar]
- Janich P, Arpat AB, Castelo‐Szekely V, Lopes M, Gatfield D (2015) Ribosome profiling reveals the rhythmic liver translatome and circadian clock regulation by upstream open reading frames. Genome Res 25: 1848–1859 [DOI] [PMC free article] [PubMed] [Google Scholar]
- Kochetov AV, Ahmad S, Ivanisenko V, Volkova OA, Kolchanov NA, Sarai A (2008) uORFs, reinitiation and alternative translation start sites in human mRNAs. FEBS Lett 582: 1293–1297 [DOI] [PubMed] [Google Scholar]
- Kondo T, Plaza S, Zanet J (2010) Small peptides switch the transcriptional activity of Shavenbaby during Drosophila embryogenesis. Science 329: 336–339 [DOI] [PubMed] [Google Scholar]
- Kozak M (1987a) An analysis of 5′‐noncoding sequences from 699 vertebrate messenger RNAs. Nucleic Acids Res 15: 8125–8148 [DOI] [PMC free article] [PubMed] [Google Scholar]
- Kozak M (1987b) Effects of intercistronic length on the efficiency of reinitiation by eucaryotic ribosomes. Mol Cell Biol 7: 3438–3445 [DOI] [PMC free article] [PubMed] [Google Scholar]
- Kozak M (2001) Constraints on reinitiation of translation in mammals. Nucleic Acids Res 29: 5226–5232 [DOI] [PMC free article] [PubMed] [Google Scholar]
- Lawless C, Pearson RD, Selley JN, Smirnova JB, Grant CM, Ashe MP, Pavitt GD, Hubbard SJ (2009) Upstream sequence elements direct post‐transcriptional regulation of gene expression under stress conditions in yeast. BMC Genom 10: 7 [DOI] [PMC free article] [PubMed] [Google Scholar]
- Lee S, Liu B, Lee S, Huang S‐X, Shen B, Qian S‐B (2012) Global mapping of translation initiation sites in mammalian cells at single‐nucleotide resolution. Proc Natl Acad Sci USA 109: E2424–E2432 [DOI] [PMC free article] [PubMed] [Google Scholar]
- Lin MF, Jungreis I, Kellis M (2011) PhyloCSF: a comparative genomics method to distinguish protein coding and non‐coding regions. Bioinformatics 27: i275–i282 [DOI] [PMC free article] [PubMed] [Google Scholar]
- Loughran G, Sachs MS, Atkins JF, Ivanov IP (2012) Stringency of start codon selection modulates autoregulation of translation initiation factor eIF5. Nucleic Acids Res 40: 2898–2906 [DOI] [PMC free article] [PubMed] [Google Scholar]
- Lu P, Vogel C, Wang R, Yao X, Marcotte EM (2007) Absolute protein expression profiling estimates the relative contributions of transcriptional and translational regulation. Nat Biotechnol 25: 117–124 [DOI] [PubMed] [Google Scholar]
- Luukkonen BG, Tan W, Schwartz S (1995) Efficiency of reinitiation of translation on human immunodeficiency virus type 1 mRNAs is determined by the length of the upstream open reading frame and by intercistronic distance. J Virol 69: 4086–4094 [DOI] [PMC free article] [PubMed] [Google Scholar]
- Maduzia LL, Moreau A, Poullet N, Chaffre S, Zhang Y (2010) The role of eIF1 in translation initiation codon selection in Caenorhabditis elegans . Genetics 186: 1187–1196 [DOI] [PMC free article] [PubMed] [Google Scholar]
- Magny EG, Pueyo JI, Pearl FMG, Cespedes MA, Niven JE, Bishop SA, Couso JP (2013) Conserved regulation of cardiac calcium uptake by peptides encoded in small open reading frames. Science 341: 1116–1120 [DOI] [PubMed] [Google Scholar]
- Mendell JT, Sharifi NA, Meyers JL, Martinez‐Murillo F, Dietz HC (2004) Nonsense surveillance regulates expression of diverse classes of mammalian transcripts and mutes genomic noise. Nat Genet 36: 1073–1078 [DOI] [PubMed] [Google Scholar]
- Mendez R, Richter JD (2001) Translational control by CPEB: a means to the end. Nat Rev Mol Cell Biol 2: 521–529 [DOI] [PubMed] [Google Scholar]
- Muckenthaler MU, Galy B, Hentze MW (2008) Systemic iron homeostasis and the iron‐responsive element/iron‐regulatory protein (IRE/IRP) regulatory network. Annu Rev Nutr 28: 197–213 [DOI] [PubMed] [Google Scholar]
- Mueller PP, Hinnebusch AG (1986) Multiple upstream AUG codons mediate translational control of GCN4. Cell 45: 201–207 [DOI] [PubMed] [Google Scholar]
- Noderer WL, Flockhart RJ, Bhaduri A, Diaz de Arce AJ, Zhang J, Khavari PA, Wang CL (2014) Quantitative analysis of mammalian translation initiation sites by FACS‐seq. Mol Syst Biol 10: 748 [DOI] [PMC free article] [PubMed] [Google Scholar]
- Oyama M, Itagaki C, Hata H, Suzuki Y, Izumi T, Natsume T, Isobe T, Sugano S (2004) Analysis of small human proteins reveals the translation of upstream open reading frames of mRNAs. 2048–2052 [DOI] [PMC free article] [PubMed]
- Paek KY, Park SM, Hong KY, Jang SK (2012) Cap‐dependent translation without base‐by‐base scanning of an messenger ribonucleic acid. Nucleic Acids Res 40: 7541–7551 [DOI] [PMC free article] [PubMed] [Google Scholar]
- Palam LR, Baird TD, Wek RC (2011) Phosphorylation of eIF2 facilitates ribosomal bypass of an inhibitory upstream ORF to enhance CHOP translation. J Biol Chem 286: 10939–10949 [DOI] [PMC free article] [PubMed] [Google Scholar]
- Pauli A, Valen E, Lin MF, Garber M, Vastenhouw NL, Levin JZ, Fan L, Sandelin A, Rinn JL, Regev A, Schier AF (2012) Systematic identification of long noncoding RNAs expressed during zebrafish embryogenesis. Genome Res 22: 577–591 [DOI] [PMC free article] [PubMed] [Google Scholar]
- Pauli A, Norris ML, Valen E, Chew G‐L, Gagnon JA, Zimmerman S, Mitchell A, Ma J, Dubrulle J, Reyon D, Tsai SQ, Joung JK, Saghatelian A, Schier AF (2014) Toddler: an embryonic signal that promotes cell movement via apelin receptors. Science 343: 1248636 [DOI] [PMC free article] [PubMed] [Google Scholar]
- Pöyry TAA, Kaminski A, Jackson RJ (2004) What determines whether mammalian ribosomes resume scanning after translation of a short upstream open reading frame? Genes Dev 18: 62–75 [DOI] [PMC free article] [PubMed] [Google Scholar]
- Presnyak V, Alhusaini N, Chen Y‐H, Martin S, Morris N, Kline N, Olson S, Weinberg D, Baker KE, Graveley BR, Coller J (2015) Codon optimality is a major determinant of mRNA stability. Cell 160: 1111–1124 [DOI] [PMC free article] [PubMed] [Google Scholar]
- Radford HE, Meijer HA, de Moor CH (2008) Translational control by cytoplasmic polyadenylation in Xenopus oocytes. Biochim Biophys Acta ‐ Gene Regul Mech 1779: 217–229 [DOI] [PMC free article] [PubMed] [Google Scholar]
- Rahmani F, Hummel M, Schuurmans J, Wiese‐Klinkenberg A, Smeekens S, Hanson J (2009) Sucrose control of translation mediated by an upstream open reading frame‐encoded peptide. Plant Physiol 150: 1356–1367 [DOI] [PMC free article] [PubMed] [Google Scholar]
- Reid DW, Chen Q, Tay ASL, Shenolikar S, Nicchitta CV (2014) The unfolded protein response triggers selective mRNA release from the endoplasmic reticulum. Cell 158: 1362–1374 [DOI] [PMC free article] [PubMed] [Google Scholar]
- Roy B, Vaughn JN, Kim B‐H, Zhou F, Gilchrist MA, Von Arnim AG (2010) The h subunit of eIF3 promotes reinitiation competence during translation of mRNAs harboring upstream open reading frames. RNA 16: 748–761 [DOI] [PMC free article] [PubMed] [Google Scholar]
- Rutkowski AJ, Erhard F, L'Hernault A, Bonfert T, Schilhabel M, Crump C, Rosenstiel P, Efstathiou S, Zimmer R, Friedel CC, Dölken L (2015) Widespread disruption of host transcription termination in HSV‐1 infection. Nat Commun 6: 7126 [DOI] [PMC free article] [PubMed] [Google Scholar]
- Schleich S, Strassburger K, Janiesch PC, Koledachkina T, Miller KK, Haneke K, Cheng Y‐S, Küchler K, Stoecklin G, Duncan KE, Teleman AA (2014) DENR‐MCT‐1 promotes translation re‐initiation downstream of uORFs to control tissue growth. Nature 512: 208–212 [DOI] [PMC free article] [PubMed] [Google Scholar]
- Skabkin MA, Skabkina OV, Dhote V, Komar AA, Hellen CUT, Pestova TV (2010) Activities of ligatin and MCT‐1/DENR in eukaryotic translation initiation and ribosomal recycling. Genes Dev 24: 1787–1801 [DOI] [PMC free article] [PubMed] [Google Scholar]
- Slavoff SA, Mitchell AJ, Schwaid AG, Cabili MN, Ma J, Levin JZ, Karger AD, Budnik BA, Rinn JL, Saghatelian A (2013) Peptidomic discovery of short open reading frame‐encoded peptides in human cells. Nat Chem Biol 9: 59–64 [DOI] [PMC free article] [PubMed] [Google Scholar]
- Slavoff SA, Heo J, Budnik BA, Hanakahi LA, Saghatelian A (2014) A human short open reading frame (sORF)‐Encoded polypeptide that stimulates DNA end joining. J Biol Chem 289: 10950–10957 [DOI] [PMC free article] [PubMed] [Google Scholar]
- Steitz JA (1969) Nucleotide sequences of the ribosomal binding sites of bacteriophage R17 RNA. Cold Spring Harb Symp Quant Biol 34: 621–630 [DOI] [PubMed] [Google Scholar]
- Subtelny AO, Eichhorn SW, Chen GR, Sive H, Bartel DP (2014) Poly(A)‐tail profiling reveals an embryonic switch in translational control. Nature 508: 66–71 [DOI] [PMC free article] [PubMed] [Google Scholar]
- Thoreen CC, Chantranupong L, Keys HR, Wang T, Gray NS, Sabatini DM (2012) A unifying model for mTORC1‐mediated regulation of mRNA translation. Nature 485: 109–113 [DOI] [PMC free article] [PubMed] [Google Scholar]
- Tian Q, Stepaniants SB, Mao M, Weng L, Feetham MC, Doyle MJ, Yi EC, Dai H, Thorsson V, Eng J, Goodlett D, Berger JP, Gunter B, Linseley PS, Stoughton RB, Aebersold R, Collins SJ, Hanlon WA, Hood LE (2004) Integrated genomic and proteomic analyses of gene expression in Mammalian cells. Mol Cell Proteomics 3: 960–969 [DOI] [PubMed] [Google Scholar]
- Ulitsky I, Shkumatava A, Jan CH, Subtelny AO, Koppstein D, Bell GW, Sive H, Bartel DP (2012) Extensive alternative polyadenylation during zebrafish development. Genome Res 22: 2054–2066 [DOI] [PMC free article] [PubMed] [Google Scholar]
- Vattem KM, Wek RC (2004) Reinitiation involving upstream ORFs regulates ATF4 mRNA translation in mammalian cells. Proc Natl Acad Sci USA 101: 11269–11274 [DOI] [PMC free article] [PubMed] [Google Scholar]
- Wan Y, Kertesz M, Spitale RC, Segal E, Chang HY (2011) Understanding the transcriptome through RNA structure. Nat Rev Genet 12: 641–655 [DOI] [PMC free article] [PubMed] [Google Scholar]
- Wethmar K (2014) The regulatory potential of upstream open reading frames in eukaryotic gene expression. Wiley Interdiscip Rev RNA 5: 765–778 [DOI] [PubMed] [Google Scholar]
- Wethmar K, Barbosa‐Silva A, Andrade‐Navarro MA, Leutz A (2014) uORFdb–a comprehensive literature database on eukaryotic uORF biology. Nucleic Acids Res 42: D60–D67 [DOI] [PMC free article] [PubMed] [Google Scholar]
- Wethmar K, Schulz J, Muro EM, Talyan S, Andrade‐Navarro MA, Leutz A (2015) Comprehensive translational control of tyrosine kinase expression by upstream open reading frames. Oncogene doi:10.1038/onc.2015.233 [DOI] [PMC free article] [PubMed] [Google Scholar]
- Wolin SL, Walter P (1988) Ribosome pausing and stacking during translation of a eukaryotic mRNA. EMBO J 7: 3559–3569 [DOI] [PMC free article] [PubMed] [Google Scholar]
- Xue S, Tian S, Fujii K, Kladwang W, Das R, Barna M (2014) RNA regulons in Hox 5′ UTRs confer ribosome specificity to gene regulation. Nature 517: 33–38 [DOI] [PMC free article] [PubMed] [Google Scholar]
- Yartseva V, Giraldez AJ (2015) The maternal‐to‐zygotic transition during vertebrate development: a model for reprogramming. Curr Top Dev Biol 113: 191–232 [DOI] [PMC free article] [PubMed] [Google Scholar]
- Ye Y, Liang Y, Yu Q, Hu L, Li H, Zhang Z, Xu X (2015) Analysis of human upstream open reading frames and impact on gene expression. Hum Genet 134: 605–612 [DOI] [PubMed] [Google Scholar]
- Zhang G, Guo G, Hu X, Zhang Y, Li Q, Li R, Zhuang R, Lu Z, He Z, Fang X, Chen L, Tian W, Tao Y, Kristiansen K, Zhang X, Li S, Yang H, Wang J, Wang J (2010) Deep RNA sequencing at single base‐pair resolution reveals high complexity of the rice transcriptome. Genome Res 20: 646–654 [DOI] [PMC free article] [PubMed] [Google Scholar]
- Zhou F, Roy B, von Arnim AG (2010) Translation reinitiation and development are compromised in similar ways by mutations in translation initiation factor eIF3h and the ribosomal protein RPL24. BMC Plant Biol 10: 193 [DOI] [PMC free article] [PubMed] [Google Scholar]
Associated Data
This section collects any data citations, data availability statements, or supplementary materials included in this article.
Supplementary Materials
Appendix
Expanded View Figures PDF
Table EV1
Table EV2
Table EV3
Dataset EV1
Dataset EV2
Dataset EV3
Review Process File