

Abstract
A152T‐variant human tau (hTau‐A152T) increases risk for tauopathies, including Alzheimer's disease. Comparing mice with regulatable expression of hTau‐A152T or wild‐type hTau (hTau‐WT), we find age‐dependent neuronal loss, cognitive impairments, and spontaneous nonconvulsive epileptiform activity primarily in hTau‐A152T mice. However, overexpression of either hTau species enhances neuronal responses to electrical stimulation of synaptic inputs and to an epileptogenic chemical. hTau‐A152T mice have higher hTau protein/mRNA ratios in brain, suggesting that A152T increases production or decreases clearance of hTau protein. Despite their functional abnormalities, aging hTau‐A152T mice show no evidence for accumulation of insoluble tau aggregates, suggesting that their dysfunctions are caused by soluble tau. In human amyloid precursor protein (hAPP) transgenic mice, co‐expression of hTau‐A152T enhances risk of early death and epileptic activity, suggesting copathogenic interactions between hTau‐A152T and amyloid‐β peptides or other hAPP metabolites. Thus, the A152T substitution may augment risk for neurodegenerative diseases by increasing hTau protein levels, promoting network hyperexcitability, and synergizing with the adverse effects of other pathogenic factors.
Keywords: A152T, Alzheimer's disease, frontotemporal dementia, hyperexcitability, tau
Subject Categories: Molecular Biology of Disease, Neuroscience
Introduction
The microtubule‐associated protein tau accumulates in the brains of patients with neurodegenerative disorders collectively known as tauopathies 1, 2, 3, 4. Abnormal increases in neurofibrillary tangles, composed primarily of filamentous tau aggregates 5, 6, 7, 8, 9, 10, are a pathological hallmark of Alzheimer's disease (AD) 11 and correlate with cognitive decline in patients with AD 12, 13. Increased levels of phosphorylated tau (p‐tau) in cerebrospinal fluid 14 and radiological evidence of abnormal tau accumulation in the brain 15, 16, 17 are becoming important biomarkers for diagnosing AD and related diseases. However, disease‐linked mutations in the gene that encodes tau in humans, MAPT, cause frontotemporal dementia (FTD) with parkinsonism linked to chromosome 17 (FTDP‐17), but not AD 18, 19. Indeed, no MAPT mutations have been identified in patients with autosomal dominantly inherited AD 20, which is caused by mutations in APP, PS1, or PS2 that alter the proteolytic cleavage of the human amyloid precursor protein (hAPP) 21. In addition, tau aggregates appear to differ in AD and other tauopathies 22. Consequently, it is unclear to what extent the tau dysfunction in transgenic mice overexpressing human tau (hTau) with FTDP‐17 mutations resembles that in AD patients.
An unusual MAPT variant encoding an A152T substitution was reported to augment the risk not only for FTD spectrum (FTD‐s) disorders, but also for AD 23, 24, 25. Investigating the in vivo effects of this variant could shed light on the role of tau in these distinct conditions and help identify pathogenic commonalities that may be amenable to therapeutic intervention.
We therefore generated transgenic mice with neuronal expression of A152T‐variant hTau (hTau‐A152T). To distinguish the effects of the variant from those of hTau overexpression per se, we generated transgenic mice expressing wild‐type hTau (hTau‐WT) protein at comparable levels. In this study, we compared these new models using biochemical, histopathological, electrophysiological, and behavioral approaches, as well as challenge with an epileptogenic drug and crosses with hAPP mice.
Results
Generation of transgenic mice with regulatable neuronal expression of hTau‐A152T or hTau‐WT
We constructed a transgene encoding the 1N4R isoform of hTau‐A152T, the main isoform that accumulates in the brains of patients with the A152T variant 26. This transgene was placed under the control of a second‐generation minimal promoter that harbors tetracycline response elements (pTRE‐Tight; henceforth called TRE); transgene expression requires co‐expression of the tetracycline transactivator protein (tTA) 27. In this “tet‐off” system, binding of tTA to TRE, and consequently transgene expression, can be prevented by feeding mice chow containing doxycycline (DOX). Unless stated otherwise, the mice were not treated with DOX.
After pronuclear microinjection of the TRE‐hTau‐A152T transgene, we obtained three transgenic founders, two of which gave rise to transgenic lines (L1 and L3) in which TRE‐hTau‐A152T expression could be transactivated by tTA. Heterozygous transgenic mice from these lines were crossed with heterozygous transgenic mice in which tTA expression is directed to excitatory forebrain neurons by the calcium/calmodulin‐dependent protein kinase II α promoter (CaMKII‐tTA) 28. This cross resulted in the following groups of littermates: nontransgenic (NTG) mice, singly transgenic TRE‐hTau‐A152T or CaMKII‐tTA mice, and doubly transgenic CaMKII‐tTA/TRE‐hTau‐A152T mice (henceforth called hTau‐A152T mice).
To determine whether the phenotype of hTau‐A152T mice is caused specifically by the A152T variant or by neuronal overexpression of hTau, we also generated a TRE‐hTau transgene encoding 1N4R hTau‐WT. Pronuclear microinjection of the TRE‐hTau‐WT construct yielded seven transgenic founders, all of which were crossed with the CaMKII‐tTA line. In a pilot experiment, cortical and hippocampal hTau protein levels in doubly transgenic CaMKII‐tTA/TRE‐hTau‐WT mice (henceforth called hTau‐WT mice) from L12 and L32 were closest to the levels in hTau‐A152T L1 and L3. We therefore selected these hTau‐WT lines for further analysis.
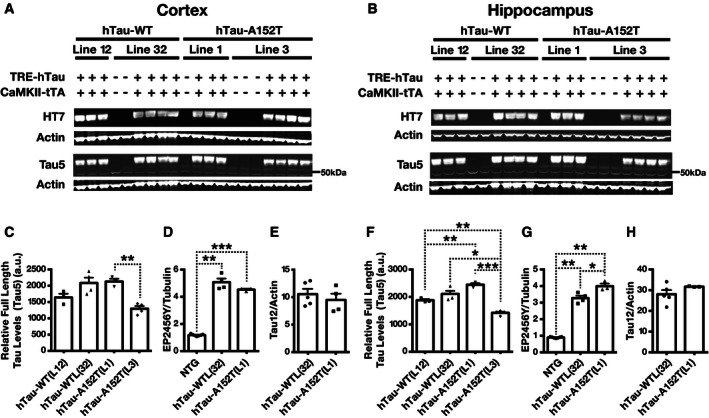
To compare tau expression levels in cortical and hippocampal homogenates in 4‐ to 10‐month‐old hTau‐WT (L12), hTau‐WT (L32), hTau‐A152T (L1), and hTau‐A152T (L3) mice, we used Western blot analysis with hTau‐specific antibodies (HT7 and Tau12) and mouse tau (mTau)/hTau cross‐reactive antibodies (Tau5 and EP2456Y) (Fig 1A–H). Cortical (Fig 1A and C) and hippocampal (Fig 1B and F) hTau and total (m+hTau) tau levels determined with HT7 and Tau5, respectively, were the highest and best matched in hTau‐WT (L32) and hTau‐A152T (L1) mice. The similarity of hTau expression levels in these lines was confirmed by measuring hTau and total tau levels in another cohort of mice with HT7 and two other antibodies (Tau12 and EP2456Y) (Figs 1D, E, G, and H, and EV1A and B). Compared with endogenous tau levels in NTG controls, total tau levels in hTau‐WT (L32) and hTau‐A152T (L1) mice were increased 4‐ to 5‐fold in the cortex (Fig 1D) and 3‐ to 4‐fold in the hippocampus (Fig 1G), as determined by Western blot analysis with EP2456Y.
Figure 1. Tau protein levels in brain tissues of hTau‐WT and hTau‐A152T mice and controls.
-
A–HTau levels in the cortex (A, C–E) and hippocampus (B, F–H) of 4‐ to 10‐month‐old mice were determined by Western blot analysis. (A, B) Representative Western blots of cortical (A) and hippocampal (B) homogenates from mice of the indicated genotypes show the levels of hTau (HT7) and total tau (Tau5). Actin served as a loading control. (C–H) Quantitation of Western blot signals for full‐length tau detected with the mTau/hTau cross‐reactive antibodies Tau5 (C, F) or EP2456Y (D, G) or the hTau‐specific antibody Tau12 (E, H). n = 3–8 mice per group. *P < 0.05, **P < 0.01, ***P < 0.001 by two‐tailed unpaired t‐test (E, H) or two‐tailed Welch's t‐test (C, D, F, G). P‐values were Holm‐adjusted for multiple comparisons. Values are means ± SEM. a.u., arbitrary units.
Figure EV1. Tau levels in brain tissues of hTau‐WT and hTau‐A152T mice determined by Western blotting or ELISA .
-
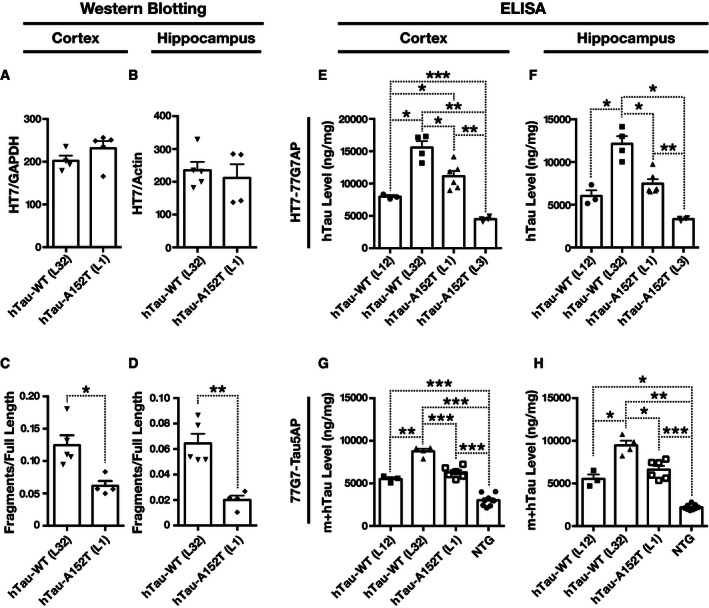
A–HTau levels in the cortex (A, C, E, G) and hippocampus (B, D, F, H) of mice were determined at 4–10 months of age by Western blotting (A–D) or ELISA (E–H). (A–D) Comparable levels of full‐length tau (A, B) and higher levels of hTau fragments (C, D) in hTau‐WT than hTau‐A152T mice were confirmed with the HT7 antibody in a cohort independent from the cohort described in Fig 1. (E–H) hTau levels determined by hTau‐specific ELISA (HT7 for capture and 77G7 conjugated with alkaline phosphatase for detection) (E, F) or pan‐tau ELISA (77G7 for capture and Tau5 conjugated with alkaline phosphatase for detection) (G, H). n = 3–4 mice per group. *P < 0.05, **P < 0.01, ***P < 0.001 by two‐tailed unpaired t‐test (A, B), two‐tailed Welch's t‐test (C, D), or Welch's t‐tests and Holm adjustment (E–H). Values are means ± SEM.
The A152T variant increases the hTau protein/mRNA ratio and decreases the formation of hTau fragments
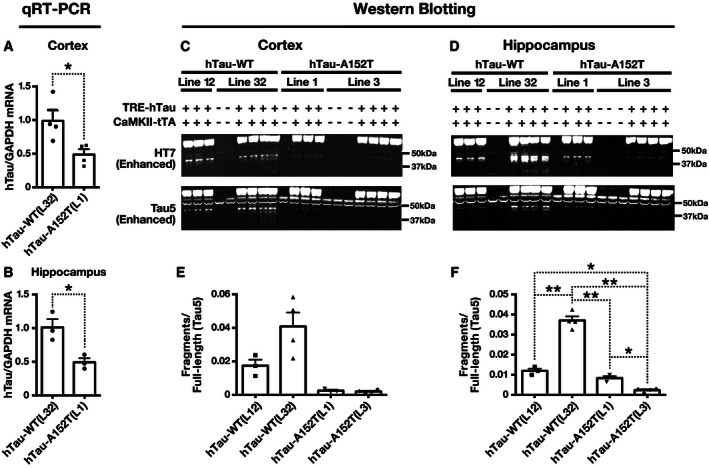
Despite their comparable hTau protein levels, hTau‐A152T (L1) mice had 50% lower hTau mRNA levels than hTau‐WT (L32) mice (Fig 2A and B), suggesting that the GCC (Ala) to ACC (Thr) replacement augments the production or reduces the turnover of hTau protein. Consistent with the latter possibility, cortical and hippocampal levels of hTau fragments were lower in hTau‐A152T (L1 and L3) than in hTau‐WT (L12 and L32) mice (Figs 2C–F and EV1C and D). These differences in hTau fragmentation/cleavage may also account for differences between results obtained by Western blotting and enzyme‐linked immunosorbent assay (ELISA). The ELISA detected higher levels of hTau in hTau‐WT (L32) than hTau‐A152T (L1) mice (Fig EV1E–H), possibly because of the additional signals from hTau fragments in the hTau‐WT (L32) line (Figs 2C–F and EV1C and D). Alternatively, the antibodies used may have had different degrees of access to their epitopes in these assays due to differences in tau conformation (on membrane after denaturation versus in solution without denaturation).
Figure 2. Levels of tau mRNA and tau fragments in brain tissues of hTau‐WT and hTau‐A152T mice and controls.
-
A–FTau expression in the cortex (A, C, E) and hippocampus (B, D, F) of 4‐ to 10‐month‐old mice was determined by quantitative RT‐PCR (A, B) and Western blot analysis (C–F). (A, B) hTau mRNA levels in tissue homogenates were determined by quantitative RT‐PCR. (C, D) Western blots from Fig 1A and B were enhanced to better reveal tau fragments of ˜40 kDa. (E, F) Quantitation of Western blot signals for tau fragments of ˜40 kDa detected with Tau5 in tissue homogenates. n = 3–4 mice per group. *P < 0.05, **P < 0.01 by two‐tailed unpaired t‐test (A, B) or two‐tailed Welch's t‐test (E, F). P‐values were Holm‐adjusted. Values are means ± SEM.
Survival, general health, and early neuropathology
Our phenotype assessment focused on doubly transgenic mice from hTau‐WT (L32) and hTau‐A152T (L1) because they had comparable cortical and hippocampal levels of full‐length hTau. These mice were also compared with their NTG littermates. Corresponding singly transgenic TRE‐hTau‐WT or TRE‐hTau‐A152T mice and/or singly transgenic CaMKII‐tTA mice from the respective lines served as additional controls. Compared with the control mice, hTau‐WT (L32) and hTau‐A152T (L1) mice survived normally into old age (Fig EV2A and B). However, adult hTau‐WT (L32) and hTau‐A152T (L1) mice weighed slightly less than NTG controls (Fig EV2C–F).
Figure EV2. Normal survival curves and subtle weight reduction in hTau‐WT and hTau‐A152T mice.

-
A, BSurvival curves of hTau‐A152T (L1) (A) and hTau‐WT (L32) (B) mice were compared with those of NTG littermates. No significant differences were detected by log‐rank test.
-
C–FBody weights of male (C, E) and female (D, F) mice from hTau‐A152T(L1) and hTau‐WT (L32) were compared with those of NTG and singly transgenic littermates at 4–7 (C, D) or 10–14 (E, F) months of age.
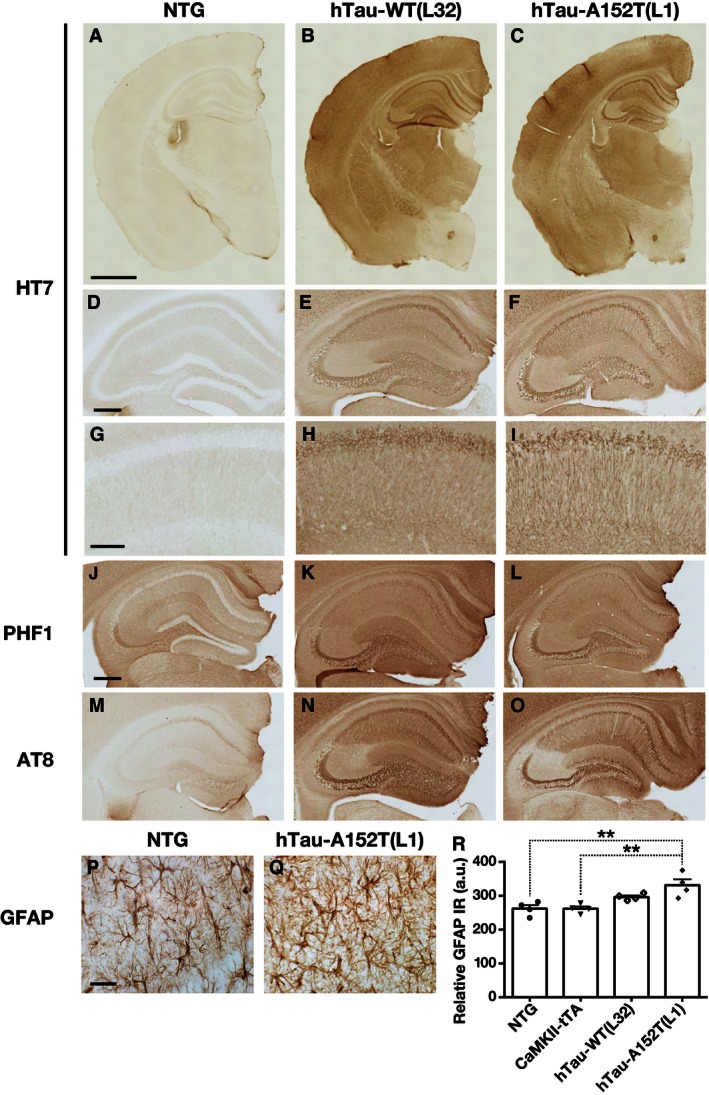
Immunostaining of brain sections with the HT7 antibody revealed widespread neuronal expression of hTau in the cortex, hippocampus, amygdala, and striatum of hTau‐WT (L32) mice and hTau‐A152T (L1) mice but not in NTG mice (Fig 3A–I).
Figure 3. hTau distribution and phosphorylation patterns, and astrogliosis in hTau‐WT and hTau‐A152T mice.
-
A–ISections of hemibrain (A–C), whole hippocampus (D–F), and CA1 region (G–I) immunostained for hTau (HT7).
-
J–OHippocampal sections immunostained with phosphorylation‐dependent tau antibodies: PHF1 (p396, 404) (J–L), AT8 (pSer 199, 202, and pThr 205) (M–O).
-
P–RRepresentative photomicrographs of GFAP immunostaining of the CA1 region (P, Q) and quantitation of GFAP immunoreactivity (R).
Significant leakiness of expression in the absence of tTA has been detected in a widely used singly transgenic TRE‐hTau‐P301L line established with an earlier generation of the tetO promoter 29, 30, 31. In contrast, immunostaining of brain sections with the HT7 antibody revealed no hTau expression in singly transgenic TRE‐hTau‐WT (L32) or TRE‐hTau‐A152T (L1) mice (Fig EV3A–C), whose transgenes contain a newer version of the tetO promoter 27, 32.
Figure EV3. Additional immunohistochemical and biochemical characterization of hTau transgenic mice.

-
A–CCoronal brain sections from 4‐month‐old mice were immunostained with the hTau‐specific antibody HT7. NTG (A), TRE‐hTau‐WT (L32) (B), and TRE‐hTau‐A152T (L1) (C) sections showed similar levels of faint background staining, confirming the lack of hTau expression in both TRE‐hTau singly transgenic lines.
-
D–MPhotomicrographs of HT7‐stained coronal CA1 sections from 3‐ to 4‐month‐old mice highlight differences in the accumulation of hTau in the stratum radiatum in hTau‐A152T (L1) mice (more string‐like) versus hTau‐WT(L32) mice (more dispersed). Figures EV3E and J are magnified images of Figure 3I and H, respectively.
-
N, Op‐Tau/total tau ratios in cortical (N) and hippocampal (O) homogenates were determined by Western blot analysis with the PHF1 (p396, 404) antibody and the EP2456Y pan‐tau antibody. n = 3–4 mice per group. ***P < 0.001 by Welch's t‐test with Holm adjustment.
-
PCoronal brain sections from 4‐ to 8‐month‐old NTG and hTau‐A152T (L1) mice were immunostained for the microglial marker Iba1. The quantitation of Iba1‐positive cells in the hippocampus revealed no significant difference between the groups (two‐tailed unpaired t‐test). n = 5–8 mice per group.
-
Q–SCoronal brain sections from 2‐ to 4‐month‐old mice were immunostained with the conformation‐dependent tau antibody MC1.
Consistent with the Western blot analysis, the intensity of neuronal hTau immunoreactivity was similar in brain sections from hTau‐WT (L32) and hTau‐A152T (L1) mice (Fig 3A–C). However, in the CA1 region, hTau‐A152T (L1) mice had a string‐like pattern of HT7 immunostaining that was not seen in hTau‐WT (L32) mice (Figs 3D–I and EV3D–M), possibly indicating a difference in the subcellular localization of hTau‐A152T versus hTau‐WT in CA1 pyramidal cells, which are particularly vulnerable to AD 33.
We also immunostained mouse brain sections with two antibodies that are widely used to detect abnormal tau accumulations in brains of humans with tauopathies: PHF1 (pSer 396, 404) and AT8 (pSer 199, 202, and pThr 205) 34, 35. In 2‐ to 4‐month‐old mice, PHF1 labeled granule cells in the dentate gyrus of hTau‐WT (L32) and hTau‐A152T (L1) mice but not NTG mice and stained mossy fibers more strongly in hTau‐WT (L32) and hTau‐A152T (L1) mice than in NTG controls (Fig 3J–L). AT8 yielded a similar staining pattern, although the more extensive string‐like staining in hTau‐A152T (L1) than hTau‐WT (L32) mice was clearer with AT8 than PHF1 (Fig 3M–O). PHF1 did not immunostain brain sections from Mapt −/− mice, whereas AT8 gave low levels of background staining that could be readily distinguished from the signal in hTau transgenic mice.
Western blot analysis of cortical or hippocampal homogenates with PHF1 and EP2456Y revealed comparable ratios of p‐tau to total tau in hTau‐WT (L32) and hTau‐A152T (L1) mice that were higher than those in NTG controls (Fig EV3N and O), suggesting that hTau (or overexpressed tau) has a greater propensity to phosphorylation than endogenous mTau and that the A152T substitution does not alter the susceptibility of tau to phosphorylation.
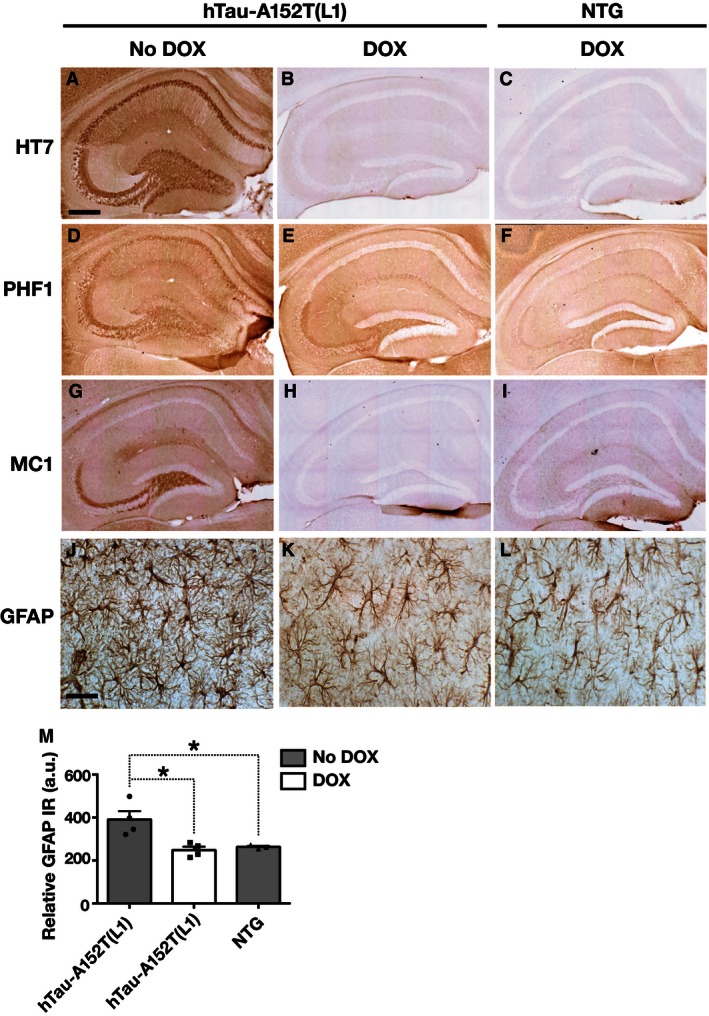
Immunostaining of brain sections for glial fibrillary acidic protein (GFAP) revealed astrocytosis in hTau‐A152T (L1) mice by 4 months of age, whereas age‐matched hTau‐WT (L32) mice showed only a trend in this direction (Fig 3P–R). Immunostaining for the microglial marker ionized calcium binding adaptor molecule 1 (Iba1) revealed no obvious differences between hTau‐A152T (L1) mice and NTG mice at 4–8 months of age (Fig EV3P).
Accumulation of misfolded, nonfilamentous tau in neurons of hTau‐A152T mice is reversible
To determine whether the early neuropathology in hTau‐A152T (L1) mice is reversible, we suppressed hTau expression in hTau‐A152T (L1) mice with DOX for 2 months, starting at 6 months of age, and analyzed them at 8 months of age. Immunostaining of brain sections with the HT7 antibody confirmed complete suppression of hTau expression in DOX‐treated mice (Fig 4A–C). DOX also fully reversed the abnormal immunostaining with PHF1 (Fig 4D–F). This finding suggests that the increased PHF1 and HT7 immunoreactivities in hTau‐A152T (L1) mice reflect the accumulation of soluble tau species rather than insoluble tau aggregates, as insoluble tau aggregates persisted even after the suppression of human tau expression in other hTau transgenic models 31, 36.
Figure 4. Reversibility of abnormal tau accumulation and astrogliosis in hTau‐A152T mice.
-
A–IUntreated hTau‐A152T (L1) mice had increased neuronal labeling with the hTau antibody HT7 (A), the phosphorylation‐dependent tau antibody PHF1 (D), and the conformation‐dependent tau antibody MC1 (G). HT7 (A) and PHF1 (D) staining patterns were similar. MC1 (G) specifically stained hippocampal mossy fibers. In hTau‐A152T (L1) mice, DOX reduced hippocampal staining with HT7, PHF1, and MC1 (B, E, H) to the levels in DOX‐treated NTG controls (C, F, I).
-
J–MDOX also normalized CA1 levels of GFAP immunoreactivity (IR) in hTau‐A152T (L1) mice, as shown by representative photomicrographs (J–L) and quantitation of GFAP immunoreactivity (M).
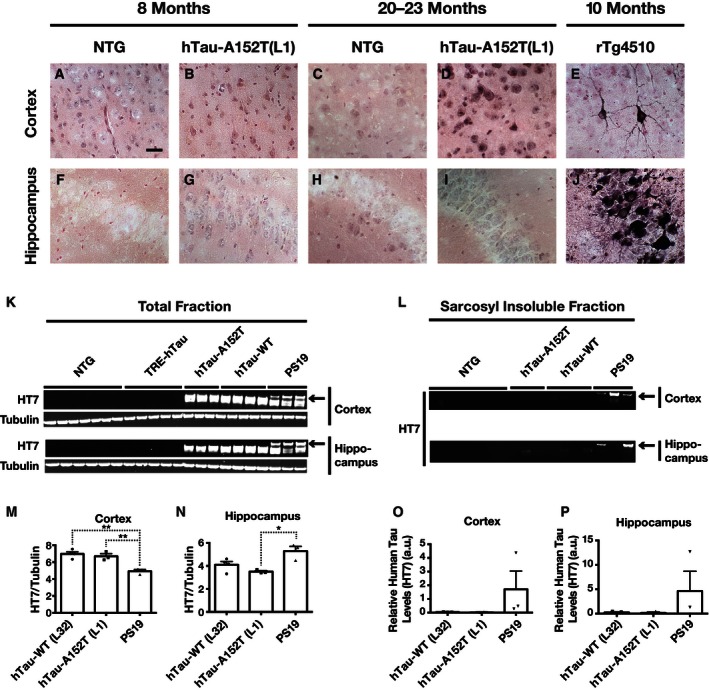
To further characterize the accumulating tau species in hTau‐A152T (L1) mice, we stained brain sections with the MC1 antibody, which detects abnormal conformations of tau in oligomeric or filamentous tau assemblies 37, 38. In 8‐month‐old hTau‐A152T (L1) mice, HT7 and PHF1 labeled pyramidal cells in CA1–3, granule cells in the dentate gyrus, and mossy fibers, whereas MC1 labeled only mossy fibers emanating from granule cells in the dentate gyrus (Fig 4A, D and G). MC1 also stained mossy fibers but not CA1–3 pyramidal cells in hTau‐WT (L12) and hTau‐WT (L32) mice (Fig EV3Q–S). The abnormal MC1 staining in hTau‐A152T (L1) mice was fully reversed by DOX treatment (Fig 4H and I), providing additional evidence that it likely represents soluble and possibly oligomeric tau rather than insoluble, filamentous tau. In further support of this notion, Gallyas silver staining revealed dense neuronal tau inclusions in the cortex and hippocampus of 10‐month‐old rTg4510 mice, which express P301L‐mutant hTau 31, but not in 8‐ or 20‐ to 23‐month‐old hTau‐A152T (L1) mice (Fig EV4A–J). However, cortical neurons of old hTau‐A152T (L1) mice were faintly and diffusely labeled by silver staining (Fig EV4D).
Figure EV4. Absence of dense Gallyas silver‐positive tau inclusions and insoluble 64‐kDa tau aggregates in hTau‐A152T mice.
-
A–JCoronal brain sections from mice of the indicated genotypes and ages were silver‐stained by the Gallyas method. Representative images of the cortex (A–E) and the hippocampal CA2/3 regions (F–J) from one mouse per genotype and age are shown. Note the dense labeling of cortical and hippocampal neurons in the rTg4510 mouse (a positive control for this type of tau pathology), the absence of such labeling in hTau‐A152T (L1) mice at both ages, and the faint and diffuse labeling of cortical but not hippocampal neurons in old hTau‐A152T (L1) mice. Scale bar: 20 μm.
-
K–PCortical or hippocampal tissues from 20‐ to 23‐month‐old mice of the indicated genotypes were lysed in RIPA buffer and saved as total fractions (K, M, N). Sarkosyl‐insoluble fractions (L, O, P) were extracted from the total fractions. hTau levels were determined by Western blot analysis with the HT7 antibody. P19 mice (age: 11–12 months expressing aggregation‐prone P301S‐mutant hTau served as a positive control for the detection of insoluble tau. Representative Western blots are shown in (K, L) and quantitations of Western blot signals in (M–P). n = 3–7 mice per genotype. *P < 0.05, **P < 0.01 by one‐way ANOVA and Tukey test. Values are means ± SEM.
Doxycycline also effectively reversed the astrocytosis in hTau‐A152T (L1) mice (Fig 4J–M), demonstrating that it was caused by hTau‐A152T expression and not by a nonspecific confound such as a line‐specific insertional mutation.
To further examine tau aggregation in hTau‐WT and hTau‐A152T mice, we used fractionation of brain tissue homogenates and Western blot analysis to compare the amount of insoluble tau in their cortex and hippocampus at 20–23 months of age with that in PS19 mice at 10–12 months of age (Fig EV4K–P); PS19 mice express the 1N4R isoform of hTau bearing the P301S mutation, which strongly promotes hTau aggregation. Roughly comparable levels of hTau expression were detected across these hTau transgenic lines, but only PS19 mice had ~64‐kDa tau (Fig EV4K, M and N), which was recovered in sarkosyl‐insoluble fractions (Fig EV4L, O and P). These data support our conclusion that soluble and possibly oligomeric tau rather than insoluble, filamentous tau accumulates in brains of hTau‐WT (L32) and hTau‐A152T (L1) mice.
Age‐dependent behavioral deficits in hTau‐A152T mice
Nest building, an important innate behavior of diverse mammalian species, depends on proper functioning of hippocampus and cortex 39, 40, 41. At 10–14 months of age, hTau‐A152T (L1) but not hTau‐WT (L32) mice showed clear impairments in nest building behavior, as compared with NTG and CaMKII‐tTA controls (Fig 5). Old hTau‐A152T (L1) mice showed a trend in the same direction (Fig EV5A), which was not statistically significant, possibly due to an age‐related decline in nest building capability in the control groups.
Figure 5. Impaired nesting behavior of hTau‐A152T mice.
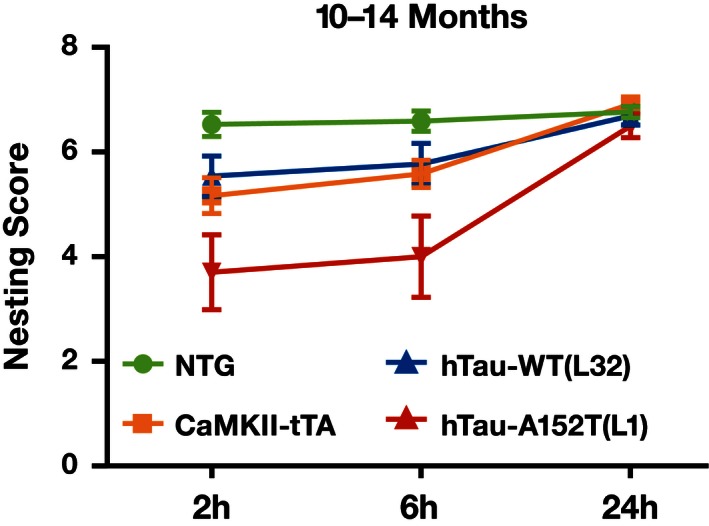
Nesting behavior of mice at 10–14 months of age was scored 0–7 by an investigator blinded to genotype. n = 17 NTG, 12 CaMKII‐tTA, 13 hTau‐WT (L32), and 10 hTau‐A152T (L1). Nest building was significantly impaired only in hTau‐A152T (L1) mice (P < 0.01 at 2 and 6 h) and CaMKII‐tTA mice (P < 0.05 at 2 h, P < 0.01 at 6 h) by nonparametric Wilcoxon rank‐sum test with gatekeeping approach and Holm adjustment. Values are means ± SEM.
Figure EV5. Nesting behavior of old hTau‐A152T mice and MWM deficits in hTau‐A152T mice from cohort 2.

-
ANesting behaviors of hTau‐A152T (L1) mice and NTG littermates at 19–23 months of age were scored 0–7 by an investigator blinded to genotype. hTau‐A152T (L1) mice showed a trend toward a deficit. Unadjusted P = 0.01981 and Holm‐adjusted P = 0.059 by nonparametric Wilcoxon rank‐sum test.
-
B–GNTG, CaMKII‐tTA, and hTau‐A152T (L1) mice from the same cohort were tested in the MWM at the indicated ages. (B, C) Learning curves during hidden platform training at 11–17 (B) or 18–23 months. Data at day 0 are from the first trial on day 1. For each age range, we used Cox proportional hazards model analysis with mixed effects and Holm adjustment to compare NTG with CaMKII‐tTA mice and NTG with hTau‐A152T (L1) mice. Only hTau‐A152T (L1) mice had significant learning impairments at 18–23 months of age (P < 0.001). (D–G) During probe trials (platform removed) 24 h after the last training trial, we recorded latency to cross the original platform location (D, E) and the number of times mice crossed the original platform location in the target quadrant (black bars) versus the average of crossings of the corresponding locations in the three other quadrants (white bars) (F, G).
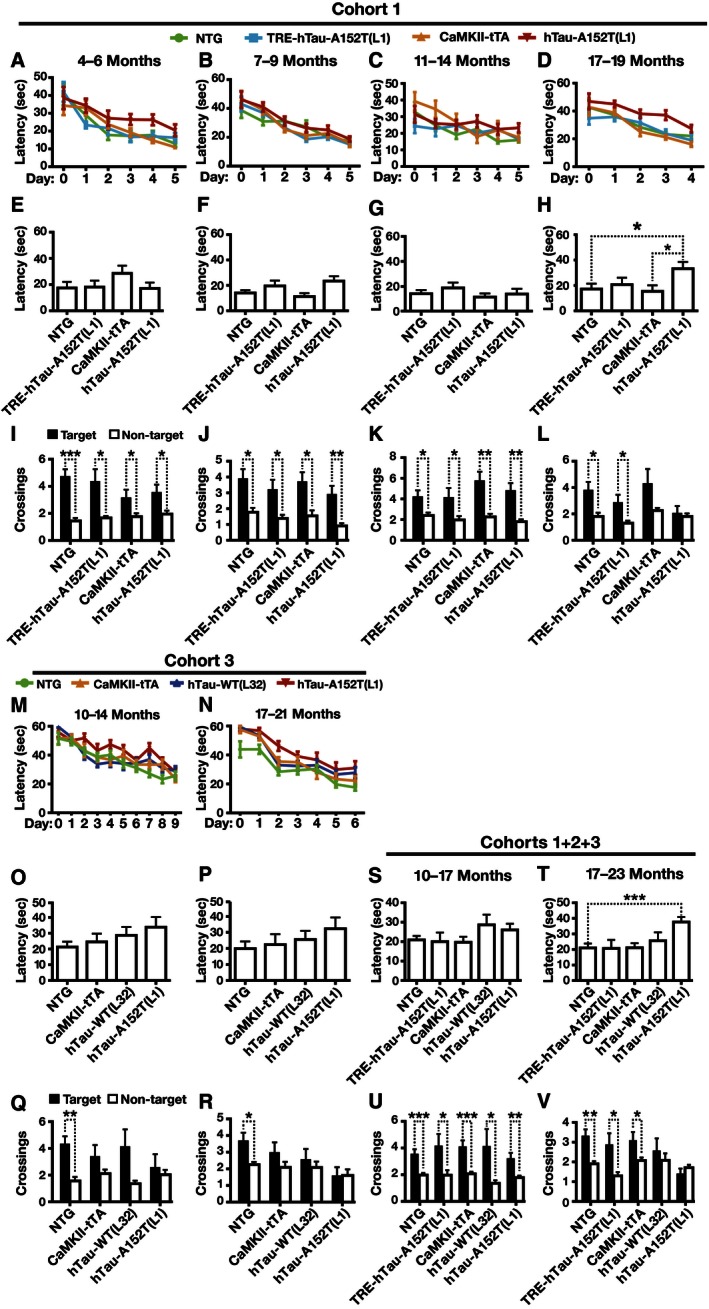
To assess spatial learning and memory, we tested mice of all four genotypes from hTau‐A152T (L1) (cohort 1) in the Morris water maze (MWM) at 4–6, 7–9, 11–14, and 17–19 months of age. Compared with NTG mice, hTau‐A152T (L1) mice showed age‐dependent impairments in learning and memory (Fig 6A–L). At 4–6 months of age, hTau‐A152T (L1) mice learned the task more poorly than NTG controls (Fig 6A) but showed no significant memory retention deficits in a probe trial 24 h after the last training trial (Fig 6E and I). At 7–9 and 11–14 months of age, hTau‐A152T (L1) mice did not differ from NTG mice in task acquisition and memory retention tests (Fig 6B, C, F, G, J and K). At 17–19 months, hTau‐A152T (L1) mice, but not TRE‐hTau‐A152T (L1) mice and CaMKII‐tTA singly transgenic mice, showed impaired learning relative to NTG controls. In the probe trial, 17‐ to 19‐month‐old hTau‐A152T (L1) mice took longer to reach the original platform location than age‐matched NTG and CaMKII‐tTA mice and, unlike NTG and TRE mice, did not cross the target location more often than equivalent locations in nontarget quadrants (Fig 6H and L). Similar results were obtained in another cohort (cohort 2) of 11‐ to 17‐month‐old and 18‐ to 23‐month‐old hTau‐A152T (L1) mice (Fig EV5B–G).
Figure 6. Age‐dependent impairment of learning and memory of hTau‐A152T mice in the MWM.
-
A–DLearning curves of mice in cohort 1. Data at day 0 are from the first trial on day 1. Compared with NTG controls, only hTau‐A152T (L1) mice showed significant learning impairments at 4–6 and 17–19 (P < 0.001) months of age by Cox proportional hazards model analysis with mixed effects and Holm adjustment for the following comparisons for each age range: NTG versus CaMKII‐tTA, NTG versus TRE‐hTau‐A152T (L1), and NTG versus hTau‐A152T (L1).
-
E–LPerformance of mice from cohort 1 (E–L) in a probe trial (platform removed) 24 h after the last training trial. (E–H) Latency to reach original platform location. (I–L) Number of times mice crossed the original platform location (black bars) or the average of their crossings of corresponding locations in the three other quadrants (white bars).
-
M, NLearning curves of mice in cohort 3. Compared with NTG controls, only hTau‐A152T (L1) mice showed significant learning impairments at 17–21 (P < 0.01) months of age by Cox proportional hazards model analysis with mixed effects and Holm adjustment for the following comparisons for each age range: NTG versus CaMKII‐tTA, NTG versus hTau‐WT (L32), NTG versus hTau‐A152T (L1), and hTau‐WT (L32) versus hTau‐A152T (L1).
-
O–VPerformance of mice from cohort 3 (O–R) and cohorts 1–3 combined (S–V) in a probe trial (platform removed) 24 h after the last training trial. (O, P, S, T) Latency to reach original platform location. (Q, R, U, V) Number of times mice crossed the original platform location (black bars) or the average of their crossings of corresponding locations in the three other quadrants (white bars).
To assess whether these behavioral deficits depend on the A152T substitution, we tested a third cohort of 10‐ to 14‐month‐old and 17‐ to 21‐month‐old hTau‐WT (L32) and hTau‐A152T (L1) mice and NTG and CaMKII‐tTA controls from both of these lines. At 17–21 but not 10–14 months, hTau‐A152T (L1) mice took longer to reach the target platform during training than NTG mice, whereas hTau‐WT (L32) mice performed at control levels (Fig 6M and N). In the probe trials, hTau‐A152T (L1) mice tended to take the longest to reach the original platform location and to show the least preference for crossing the target location, although these trends did not reach statistical significance (Fig 6O–R). To increase the power of our analysis, we combined all probe trial data from cohorts 1–3 at 10–17 and 17–23 months of age (Fig 6S–V). The results of this extended analysis support the conclusion that at ≥ 17 months of age hTau‐A152T (L1) mice are more impaired than hTau‐WT (L32) mice (P = 0.0335 for latency to target location and P = 0.0198 for target crossings, hTau‐A152T (L1) versus hTau‐WT (L32) mice by unpaired one‐tailed t‐tests, unadjusted), most likely as a result of the A152T substitution.
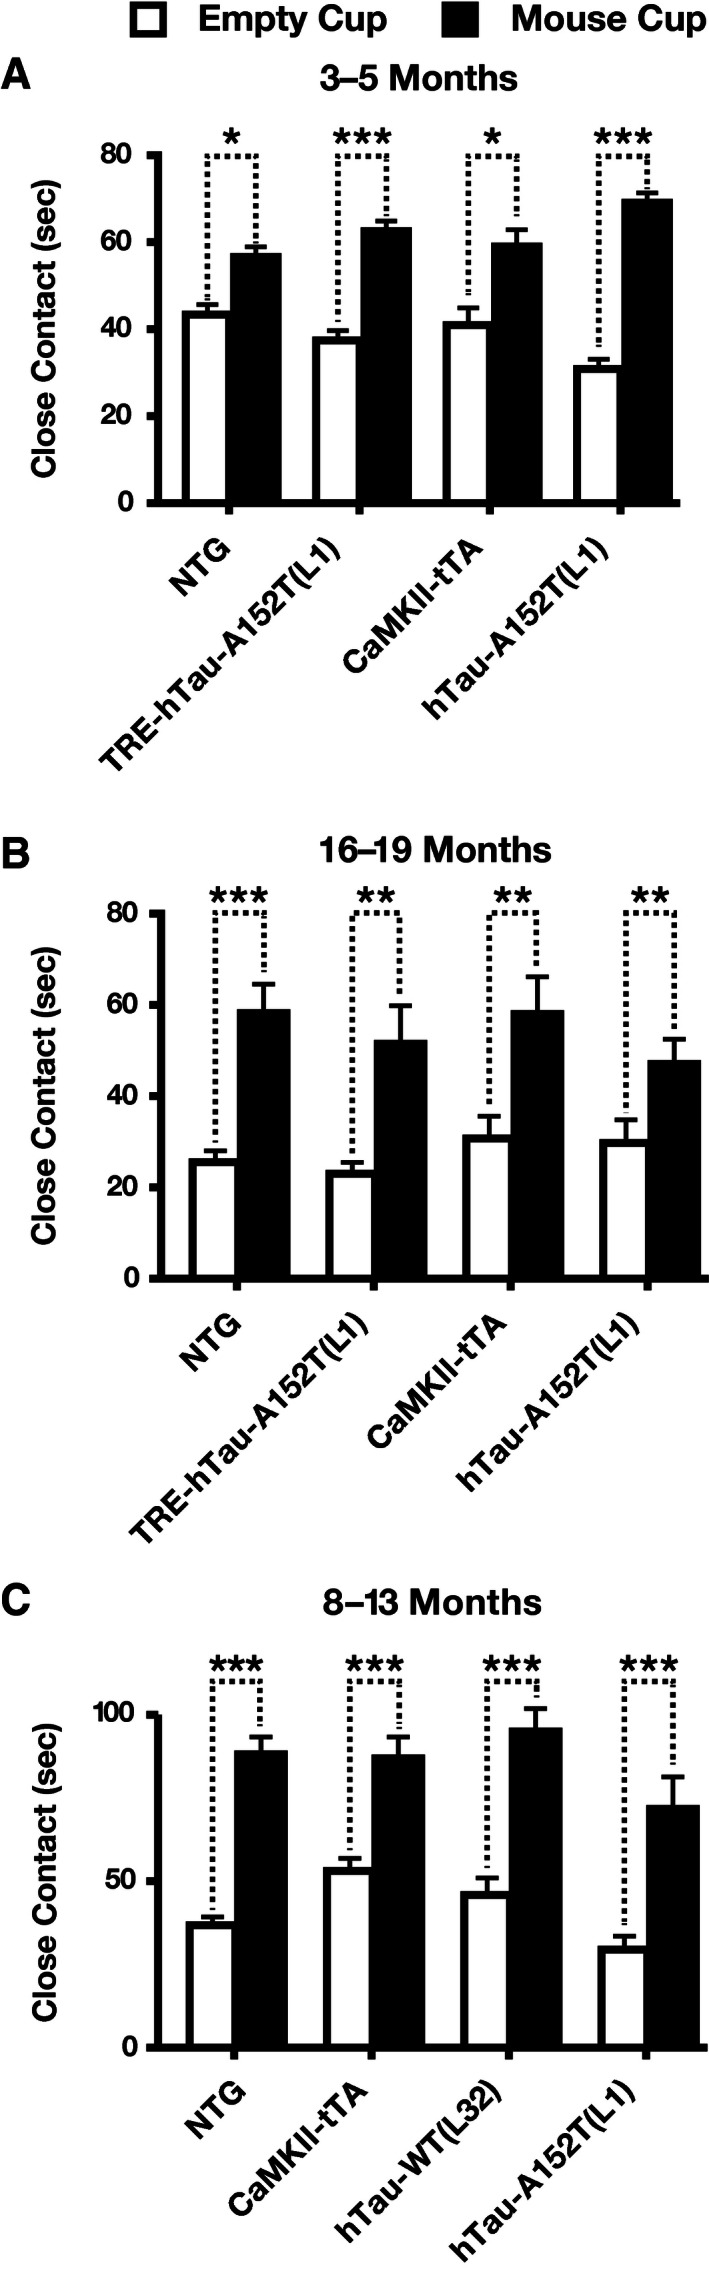
To assess social behavior, we analyzed a cohort of hTau‐A152T (L1) mice (Fig 7A and B) and another cohort of hTau‐A152T (L1) and hTau‐WT (L32) mice (Fig 7C) with the social approach test at young, middle, or old age. At all ages, all genotypes showed normal social interaction, spending more time with an inverted wire cup containing a live mouse than with an empty cup (Fig 7A–C).
Figure 7. Normal sociability of hTau‐A152T‐WT (L32) and hTau‐A152T (L1) mice.
-
A–COne cohort of mice was assessed with the social approach test at young (A) and old (B) age and another cohort of mice at middle age (C). Mice were placed individually into the empty center chamber of a three‐chamber apparatus. One side chamber contained an empty cup, and the other an identical cup with an unfamiliar live mouse in it. Close contact with each cup was monitored for 10 min. n = 12 (A, B) or 17 (C) NTG; 13 (A) or 10 (B) TRE‐hTau‐A152T (L1); 12 (A), 9 (B), or 12 (C) CamKII‐tTA; 13 (C) hTau‐WT (L32); and 14 (A), 12 (B), or 10 (C) hTau‐A152T (L1) mice. *P < 0.05, **P < 0.01, ***P < 0.001 by one‐tailed paired t‐test with Holm adjustment. Values are means ± SEM.
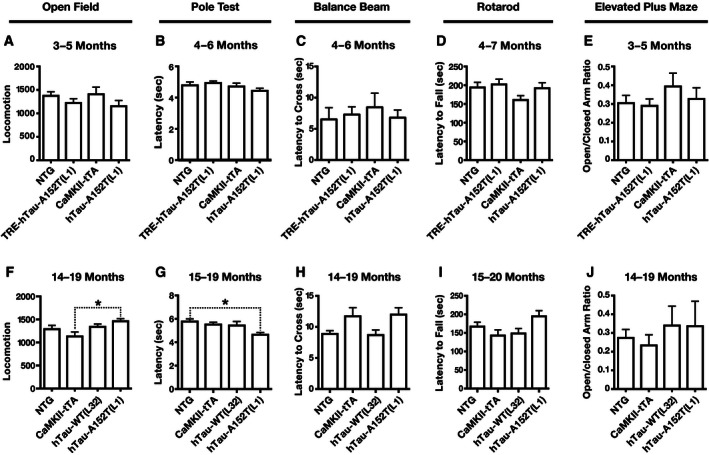
Anxiety and exploratory behavior were assessed with the elevated plus maze and the open field test, and motor functions were assessed with the pole test, balance beam, and rotarod. It should be noted in this context that transgene expression directed by the CaMKIIα promoter is much more prominent in the forebrain than the hindbrain 28. At young ages, no significant differences were detected among the genotypes in any of these tests (Fig EV6A–E). Similar findings were obtained at old ages (Fig EV6F–J), except that CaMKII‐tTA mice showed less locomotor activity than hTau‐A152T (L1) mice, which did not differ from NTG mice (Fig EV6F), and that hTau‐A152T (L1) mice performed slightly better in the pole test than NTG controls (Fig EV6G).
Figure EV6. hTau transgenic mice did not have robust alterations in locomotor activity or anxiety.
-
A–JMice of the indicated genotypes and ages were tested in the open field (A, F), pole test (B, G), balance beam (C, H), rotarod (D, I), and elevated plus maze (E, J) at young (A–E) and old (F–J) ages. (A, F) Total number of beam breaks during 15 min of exploration. (B, G) Latency to climb down from the top of the pole. (C, H) Average latency to cross the beam on day 3. (D, I) Average latency to fall from the rotarod on day 3. (E, J) Ratio of time spent in open arm versus closed arm of the elevated plus maze. n = 12 (A–E) or 17 (F–J) NTG; 13 (A–E) TRE‐hTau‐A152T (L1); 12 (A, E), 11 (B–D), 13 (F, J), or 12 (G–I) CaMKII‐tTA; 13 (F, J) or 12 (G–I) hTau‐WT (L32); and 13 (A, E), 14 (B–D), or 10 (F–J) hTau‐A152T (L1) mice. *P < 0.05 by one‐way ANOVA and Tukey test. Otherwise, no significant differences between genotypes were detected by one‐way ANOVA with post hoc Tukey test (A–D, F–I) or by two‐tailed Welch's t‐test with Holm adjustment (E, J).
Age‐dependent neuronal loss in hTau‐A152T mice
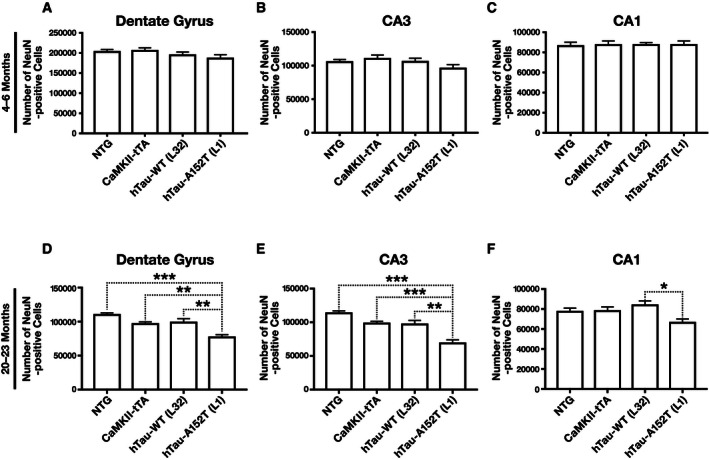
To assess whether hTau‐A152T may contribute to neuronal loss, we stained coronal brain sections from 4‐ to 6‐month‐old and 20‐ to 23‐month‐old NTG, hTau‐WT (L32), and hTau‐A152T (L1) mice for the neuronal marker NeuN and counted NeuN‐positive cells with neuronal morphology in sections of the dentate gyrus and hippocampal CA1 and CA3 regions. At 4–6 months of age, none of the transgenic mice showed neuronal loss (Fig 8A–C). At 20–23 months, hTau‐A152T, but not hTau‐WT, mice had neuronal loss in dentate gyrus and CA3 but not in CA1 (Fig 8D–F). These findings suggest that the neuronal loss in hTau‐A152T mice is causally linked to the A152T substitution and is not simply caused by overexpression of hTau per se. These findings are consistent with the age‐ and A152T‐dependent cognitive impairments we observed in transgenic mice tested in the MWM (Figs 6 and EV5B–G).
Figure 8. Age‐dependent neuronal loss in hTau‐A152T (L1) mice.
-
A–FCoronal brain sections obtained from mice at 4–6 (A–C) or 20–23 (D–F) months of age were immunostained for NeuN. The number of NeuN‐positive cells with neuronal morphology was determined in dentate gyrus (A, D), CA3 (B, E), and CA1 (C, F). n = 11 (A–C) or 18 (D–F) NTG; 11 (A–C) or 5 (D–F) CamKII‐tTA; 7 (A–C) or 9 (D–F) hTau‐WT (L32); and 14 (A–C) or 10 (D–F) hTau‐A152T (L1) mice. *P < 0.05, **P < 0.01, ***P < 0.001 by one‐way ANOVA and Tukey test. Values are means ± SEM.
We also looked for neuronal loss in CaMKII‐tTA mice because CaMKII‐tTA expression has been reported to reduce neuronal counts in mice of other genetic backgrounds, although toxicity on a congenic C57BL/6J background was minimal 42. We found no neuronal loss in young CaMKII‐tTA mice (Fig 8A–C). However, there was a trend toward neuronal loss in older CaMKII‐tTA mice (Fig 8D and E) as compared to NTG controls (P = 0.088 in dentate gyrus and P = 0.095 in CA3).
hTau accumulation increases synaptic transmission strength and reduces paired‐pulse facilitation
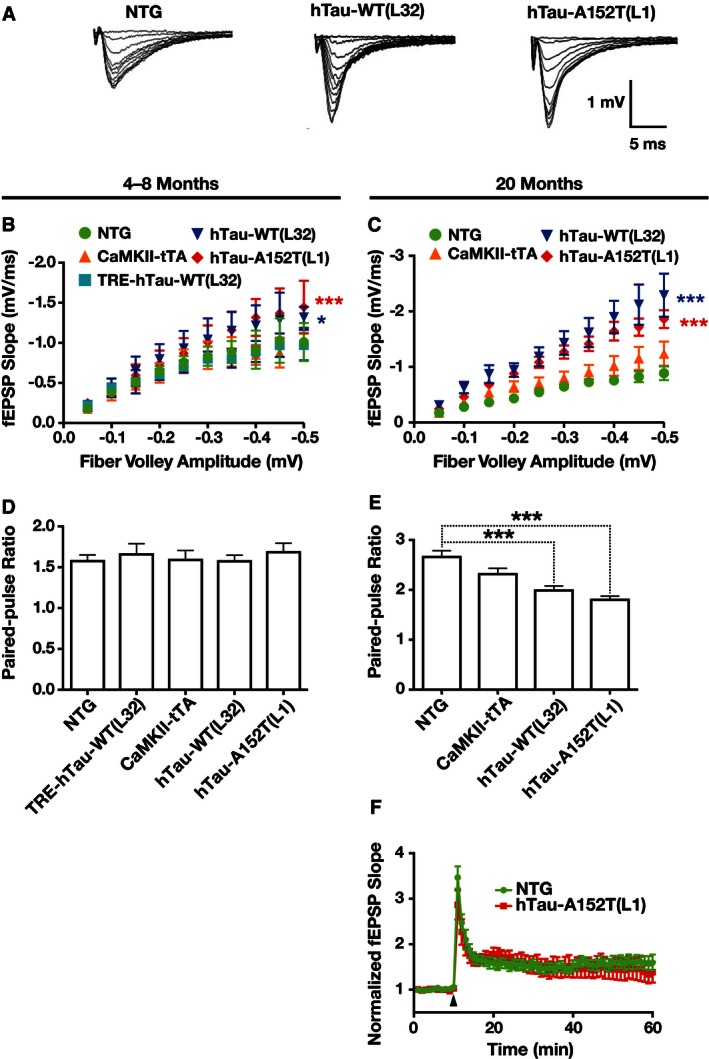
To examine synaptic functions before (4–8 months) and after (20 months) cognitive impairments and neuronal loss arise in hTau‐A152T mice, we focused on the mossy fiber synapse between dentate granule cells and CA3 pyramidal neurons, because mossy fibers showed the most obvious accumulation of MC1‐positive tau in hTau‐A152T (L1) and hTau‐WT (L32) mice (Figs 4G and EV3S). To examine transmission strength and plasticity at this synapse, we stimulated mossy fibers and recorded field excitatory postsynaptic potentials (fEPSPs) in CA3 stratum lucidum (Fig 9). Input/output curves were analyzed by plotting the slope of the fEPSP as a function of fiber volley amplitude (Fig 9A–C). Even at 4–8 months of age, the slope of the input/output curve in hTau‐A152T (L1) mice and hTau‐WT (L32) mice was steeper than in NTG controls (Fig 9B), suggesting increased synaptic transmission strength in both hTau transgenic lines. Singly transgenic CaMKII‐tTA and TRE‐hTau‐WT (L32) mice did not differ from NTG mice. At 20 months, synaptic transmission strength was further increased in both hTau‐A152T (L1) and hTau‐WT (L32) mice (Fig 9C). These results suggest that overexpression of hTau increases synaptic transmission strength in an age‐dependent manner and independently of the A152T substitution, possibly as the result of hTau accumulation in mossy fibers.
Figure 9. Increased synaptic transmission in hTau‐WT and hTau‐A152T mice.
-
ARepresentative fEPSP traces from slices of 4‐ to 8‐month‐old mice.
-
B, CInput/output curves reflecting the change in the fEPSP slope as a function of the fiber volley amplitude from slices obtained at 4–8 (B) or 20 (C) months of age.
-
D, EShort‐term plasticity assessed by measuring the PPR (second pulse/first pulse) with 50‐ms interpulse interval at 4–8 (D) or 20 (E) months of age.
-
FMossy fiber LTP at 20 months of age. Arrowhead, stimulation 2× 125 pulses at 25 Hz.
To determine whether the increased synaptic transmission strength reflects presynaptic changes in the mossy fiber terminals, we assessed paired‐pulse facilitation 43, 44. The paired‐pulse ratio (PPR) did not differ among genotypes at 4–8 months (Fig 9D) but was lower in hTau‐WT (L32) and hTau‐A152T (L1) than in NTG mice at 20 months (Fig 9E). Thus, with aging, hTau expression increases the probability of presynaptic vesicle release, which could contribute to the age‐dependent strengthening of synaptic transmission. In contrast, mossy fiber long‐term potentiation (LTP) was unchanged in hTau‐A152T (L1) mice even at old age (Fig 9F).
The A152T variant enhances hTau‐induced network hyperexcitability
Patients with AD and related mouse models have an abnormal proclivity to develop epileptiform network activity 45, 46, 47, 48. To screen for such activity, we recorded electroencephalograms (EEGs) in awake, behaving 4‐ to 9‐month‐old mice. At baseline, epileptiform spikes were more abundant in hTau‐A152T (L1) mice and less abundant in hTau‐WT (L32) and CaMKII‐tTA mice than in NTG controls (Fig 10A, top, and B), suggesting a pro‐epileptogenic effect of the A152T variant.
Figure 10. hTau‐A152T enhances network hypersynchrony.
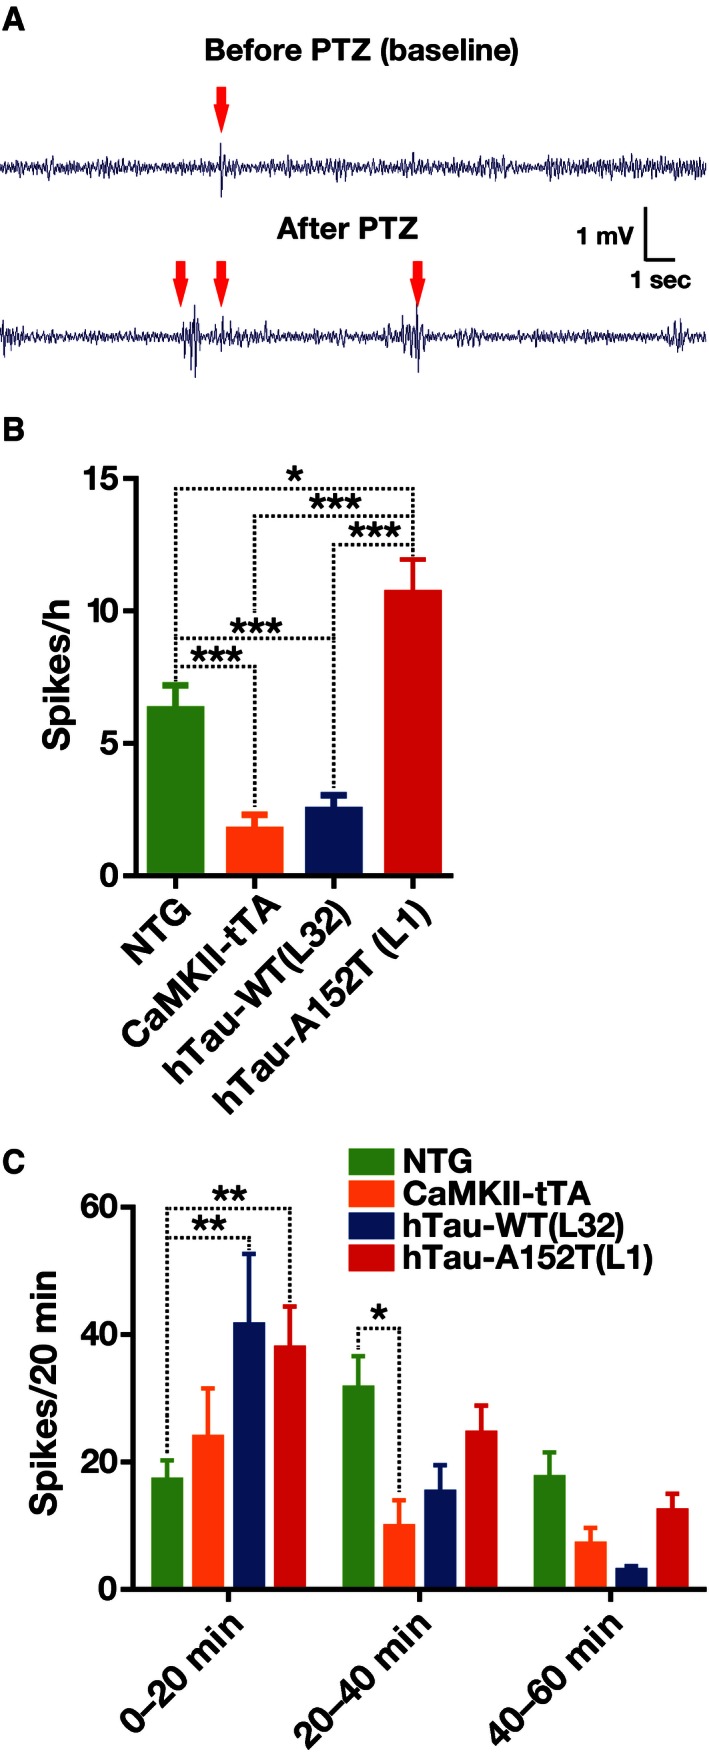
-
A–CSubdural EEG recordings from freely behaving mice at 4–9 months of age before (A top trace, B) and after (A bottom trace, C) injection of PTZ at a dose (30 mg/kg) that did not produce convulsions. (A) Representative EEG traces from an hTau‐A152T (L1) mouse. Arrows indicate epileptic spikes. (B, C) Quantitation of spikes per hour at baseline (B) and of spikes per 20‐min intervals after PTZ injection (C). n = 31 (B) or 23 (C) NTG; 13 (B) or 11 (C) CaMKII‐tTA; 12 (B) or 10 (C) hTau‐WT (L32); and 22 (B) or 21 (C) hTau‐A152T (L1) mice. *P < 0.05, **P < 0.01, ***P < 0.001 by two‐tailed Welch's t‐test with Holm adjustment (B) or by two‐way repeated‐measures ANOVA and Tukey test (C). Values are means ± SEM.
In response to a subconvulsive dose of the GABAA receptor antagonist pentylenetetrazol (PTZ, 30 mg/kg by intraperitoneal injection), spike counts increased faster and reached higher levels in hTau‐A152T (L1) and hTau‐WT (L32) mice than in NTG controls (Fig 10A, bottom, and C). The number of spikes peaked during the first 20 min after the injection in hTau‐A152T (L1) and hTau‐WT (L32) mice but not until 20–40 min after injection in NTG controls. These findings suggest that overexpression of hTau lowers the threshold for chemically induced seizures. Curiously, CaMKII‐tTA mice had fewer epileptiform spikes than NTG mice 20–40 min after injection (Fig 10C), consistent with the differences in their baseline spike counts (Fig 10B).
Neuronal expression of hTau‐A152T enhances risk of early death and epileptic activity in hAPP mice
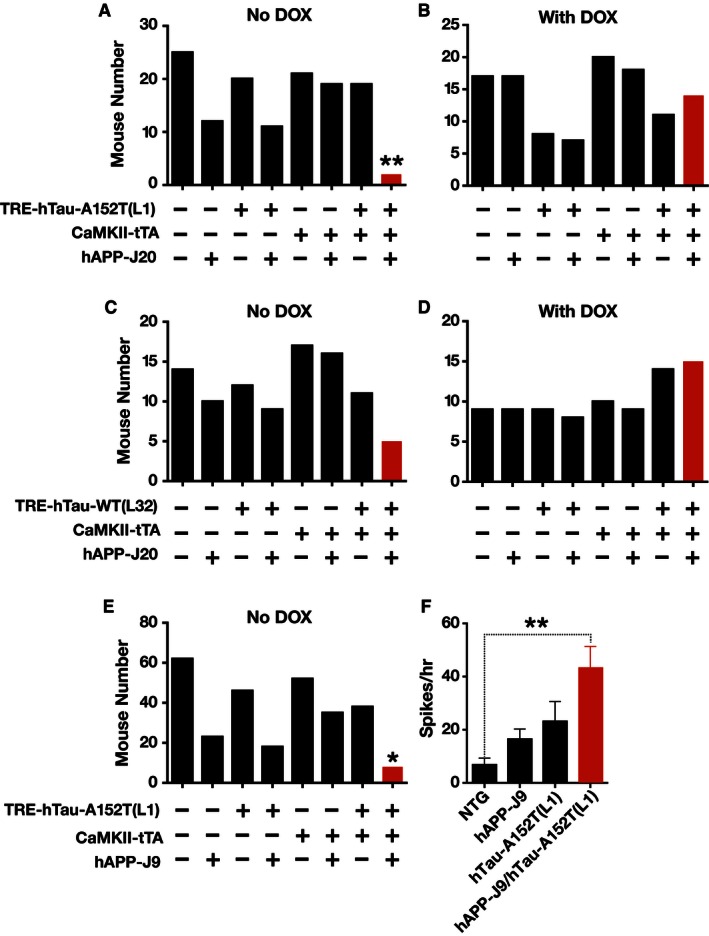
Since the A152T variant is associated with increased risk of AD 23, we explored whether hTau‐A152T sensitizes neurons to Aβ‐induced dysfunction. We therefore crossed hTau‐A152T (L1) mice and hTau‐WT (L32) mice with hAPP transgenic mice from line J20 (hAPP‐J20) (Fig 11A–D). hAPP‐J20 mice have pathologically elevated levels of human Aβ in the brain, increased risk of early death (most likely from epileptic activity), and AD‐like features, including memory problems, behavioral alterations, synaptic impairments, amyloid plaques, neuritic dystrophy, astrocytosis, and microgliosis 49, 50, 51, 52, 53.
Figure 11. Poor survival of mice coexpressing hAPP/Aβ and hTau‐A152T.
-
A–DNumbers of offspring from crosses of hAPP‐J20 mice with hTau‐A152T (L1) (A, B) or hTau‐WT (L32) (C, D) mice that were not (A, C) or were (B, D) treated with DOX and that were alive 4–6 weeks after birth.
-
ENumbers of offspring from crosses of lower expresser hAPP‐J9 mice with hTau‐A152T (L1) mice that were not treated with DOX and that were alive 4–6 weeks after birth.
-
FSubdural EEG recordings from untreated 3‐ to 10‐month‐old mice were analyzed to compare their number of spikes at baseline. n = 8 NTG, 6 hAPP‐J9, 6 hTau‐A152T (L1), and 8 hAPP‐J9/hTau‐A152T (L1). Values are mean ± SEM.
Among 141 offspring from crosses of hTau‐A152T (L1) and hAPP‐J20 mice, only two were triply transgenic (TRE‐hTau‐A152T (L1) + CaMKII‐tTA + hAPP‐J20), and both died shortly after weaning (Fig 11A). This inheritance pattern differs from Mendelian principles (P = 0.0008 by chi‐square test), and logistic regression confirmed a significant interaction between the three transgenes (P = 0.0046) (Fig 11A).
Among 94 offspring from crosses of hTau‐WT(L32) and hAPP‐J20 mice, only five were triply transgenic (Fig 11C), which suggests only a trend toward deviation from Mendelian inheritance (P = 0.110 by chi‐square test). In addition, only two of the five triply transgenic mice from the hTau‐WT (L32) × hAPP‐J20 cross died at 2 months of age, suggesting that coexpression of hAPP/Aβ with hTau‐A152T may be more detrimental than coexpression with hTau‐WT.
Notably, suppression of transgene expression by treating mothers and offspring with DOX increased the number of triply transgenic mice to around the average of other genotypes (Fig 11B and D). Thus, the pathogenic effects of hTau‐A152T, and possibly also hTau‐WT, on the phenotype of hAPP mice were not caused by genomic effects but by expression of the transgene products.
To increase the survival of mice coexpressing hAPP/Aβ and hTau‐A152T, we crossed hTau‐A152T (L1) mice with mice from hAPP line J9 (hAPP‐J9), which express hAPP/Aβ at lower levels than hAPP‐J20 mice 50, 54, 55, 56. Among 282 offspring from crosses of hTau‐A152T (L1) and hAPP‐J9 mice, only eight were triply transgenic (Fig 11E). The inheritance pattern of this cross also did not follow Mendelian principles (P < 0.0001 by chi‐square test) and, once again, logistic regression analysis revealed a significant interaction between the three transgenes (P = 0.036). However, none of the triply transgenic mice died before adulthood. One died at 7 months and another at 10 months of age; the remaining six mice were still alive at 11–17 months of age.
The survival of some hAPP‐J9/hTau‐A152T (L1) mice allowed us to examine the combined effects of hAPP/Aβ and hTau‐A152T on neural network activity in 3‐ to 10‐month‐old mice (Fig 11F). In EEG recordings, hTau‐A152T (L1) mice and singly transgenic hAPP‐J9 mice had more epileptic spikes than NTG mice, but these trends were not statistically significant (P = 0.0773 for hTau‐A152T (L1) and P = 0.0556 for hAPP‐J9 versus NTG by unpaired two‐tailed Welch's t‐test without Holm adjustment). In contrast, epileptic spikes were more abundant in hAPP‐J9/hTau‐A152T (L1) mice than in NTG controls (Fig 11F). These results suggest that neuronal expression of hTau‐A152T increases susceptibility to hAPP/Aβ‐dependent epileptiform activity, which may explain the copathogenic interaction of these proteins reflected in the poor survival of hAPP/hTau‐A152T (L1) mice.
Discussion
Our side‐by‐side comparison of hTau‐A152T and hTau‐WT mice suggests that the A152T substitution increases the hTau protein/mRNA ratio in vivo, which could promote tau accumulation in the brains of A152T carriers. This effect may explain, at least in part, the increased susceptibility of hTau‐A152T carriers to diverse tauopathies 23, 57. Higher levels of tau may also be responsible for the increased AD risk associated with a more common single nucleotide polymorphism in MAPT 58. Increased tau levels also predict the development of epilepsy, which is more frequent in patients with mild cognitive impairment (MCI) or AD than in control populations and may be associated with an earlier cognitive decline in AD 45, 48, 59.
While additional studies are needed to determine whether the A152T substitution increases the production or decreases the turnover of hTau protein, its effect on the hTau protein/mRNA ratio is unlikely to have confounded our comparison of hTau‐A152T and hTau‐WT mice, as the lines we analyzed were selected to have comparable protein levels of full‐length hTau‐A152T versus hTau‐WT. Our comparison of these lines suggests that the A152T variant augments the detrimental effects of neuronal hTau accumulation on neuronal survival, neural network activity, behavior, and cognitive functions. In addition, the co‐expression of hAPP/Aβ impaired survival more severely in hTau‐A152T than hTau‐WT mice. Thus, the A152T variant may promote the development of tauopathies through multiple mechanisms, including increased tau protein levels, network hyperexcitability and synergistic interactions with copathogens.
In transgenic lines with matched expression of full‐length hTau, cortical and hippocampal tau fragment levels were lower in hTau‐A152T than hTau‐WT mice. Because the ratios of full‐length hTau protein to hTau mRNA were higher in hTau‐A152T than hTau‐WT mice, we suspect that the A152T substitution interferes with the proteolytic cleavage of hTau—a hypothesis that merits testing. Our findings differ from those obtained in human neurons derived from induced pluripotent stem cells, in which the A152T variant increased tau fragmentation 60. This discrepancy may reflect differences in neuronal maturation, the complexity of the experimental models, or the species analyzed.
hTau fragments can cause or promote tau aggregation, mitochondrial and lysosomal dysfunction, axonal transport deficits, and increases in NMDA receptor levels 61, 62, 63, 64, 65. Thus, it is interesting that hTau‐A152T (L1) mice, despite their lower levels of tau fragments, had more neuronal dysfunction than hTau‐WT (L32) mice. These findings raise three nonexclusive possibilities: (i) The accumulation of full‐length tau may be more detrimental than the accumulation of tau fragments, at least in vivo and in the presence of the A152T substitution, (ii) fragments of hTau‐A152T may be more toxic than those of hTau‐WT, and (iii) the tau fragments we detected in hTau‐WT mice may differ from the toxic tau fragments analyzed in previous studies.
Two caveats apply to many, if not most, tau transgenic models, including the ones presented here: (i) They were generated by random insertion of transgenes into the genome, and (ii) they overexpress tau to ensure and accelerate the development of tauopathy within the short lifetime of laboratory animals. We addressed these caveats in two ways. First, we used a regulatable promoter system in which transgene expression can be suppressed with DOX. By showing the dependence of phenotypes on protein expression, this system makes it possible to exclude nonspecific effects such as insertional mutagenesis or genomic destabilization as confounding causes of the phenotypes observed. Second, we generated transgenic lines that express hTau‐A152T or hTau‐WT at comparable levels, which controls for the effects of hTau overexpression per se.
Using this well‐controlled experimental design, we identified several abnormalities in our transgenic lines that were likely caused by neuronal overexpression of hTau per se, as they were observed to a similar extent in hTau‐A152T and hTau‐WT mice. One was the accumulation of phosphorylated (PHF1‐ and AT8‐positive) and putatively misfolded (MC1‐positive) but nonfilamentous (Gallyas‐negative) tau in both transgenic models. Unlike filamentous tau inclusions in other hTau models 31, 36, 66, this form of tau vanished after suppression of transgene expression with DOX for 2 months. The elimination of detectable hTau protein after DOX treatment for 2 months is consistent with the prominent reduction in endogenous tau levels in brains of NTG mice within 4 weeks after intracerebroventricular infusion of antisense oligonucleotides against tau 67. Our findings indicate that nonaggregated tau or tau oligomers can be eliminated by suppressing tau expression.
The observation that overexpression of hTau‐WT can lead to the intraneuronal accumulation of p‐tau is consistent with previous studies 68, 69, 70, 71, 72, 73. It is also consistent with the fact that WT rather than mutant hTau accumulates in the majority of patients with tauopathy.
Surprisingly, hTau‐A152T mice did not have filamentous neuronal tau inclusions even at 20 months of age, despite their early astrocytosis and age‐dependent development of neuronal, behavioral, and cognitive dysfunctions. These findings suggest that their neuronal impairments were caused by soluble tau species such as tau monomers or oligomers with pathogenic conformations. Neuronal dysfunction was observed before tau aggregation also in an independent hTau‐A152T mouse model generated by Decker et al 74.
Besides increasing the levels of soluble tau species, the A152T substitution might also increase their toxicity or sensitize neurons to their effects. Indeed, we observed hTau‐A152T‐dependent neuronal loss in the hippocampus, consistent with findings obtained by Decker and colleagues 74. Mechanisms to explore in future studies include potential effects of the A152T substitution on (1) hTau/Fyn interactions 75, which could contribute to NMDA receptor‐mediated neurotoxicity 74, (2) network hyperexcitability 50, 76, and (3) tau's Gly155–Gln244 region, which is exposed on the surface of tau oligomers 77 and might mediate interactions between these assemblies and cellular targets.
Although mossy fibers of hTau‐A152T mice contained misfolded p‐tau, we did not detect impairment of mossy fiber LTP in these mice. However, both hTau‐A152T and hTau‐WT mice had age‐dependent increases in synaptic transmission strength and decreases in paired‐pulse facilitation at the mossy fiber/CA3 pyramidal cell synapse. In contrast, synaptic transmission and facilitation were unaltered or reduced at this synapse in hTau mice bearing FTDP‐17 mutations (P301L and ∆K280) that strongly promote tau aggregation 36, 78, 79, 80, 81. Whether and how these phenotypic differences relate to specific conformations and assemblies of tau 82 remains to be determined.
Our findings suggest that overexpression of hTau‐WT or hTau‐A152T directly or indirectly increases the strength of synaptic transmission at the mossy fiber/CA3 synapse, at least in part by increasing presynaptic neurotransmitter release, in agreement with findings obtained by Decker et al 74. Possibly related to this effect—and consistent with the observation that reduction of endogenous tau blocks network hyperexcitability and epilepsy of diverse causes 50, 67, 83, 84, 85—both hTau‐WT mice and hTau‐A152T mice were more susceptible to chemically induced epileptiform activity. Similar findings were obtained in hippocampal slice cultures from an independent hTau‐A152T mouse model 74 and in hTau mice carrying the FTDP‐17 mutations G272V, P301L, and R406W 86.
Because reduction in body weight is a potential risk factor for AD 87, it is interesting that hTau‐WT and hTau‐A152T mice weighed less than NTG controls. In combination with our previous observation that tau ablation increases body weight in aging mice 88, these findings raise the intriguing possibility that tau also contributes to AD‐related phenotypes through signaling pathways that regulate body weight.
Abnormalities we found in both hTau‐A152T and hTau‐WT mice were likely caused by overexpression of hTau. Notably, even these abnormalities could be of particular relevance to A152T‐associated pathogenesis, as this variant increased the hTau protein/mRNA ratio and thus might raise neuronal hTau protein levels in human carriers. However, because we also identified clear phenotypic differences between hTau‐A152T and hTau‐WT mice, it is likely that the A152T variant promotes the development of neurological deficits through additional mechanisms. These differences included nest building impairments in middle‐aged hTau‐A152T mice as well as neuronal loss and deficits in spatial learning and memory in old hTau‐A152T mice, none of which were seen in age‐matched hTau‐WT mice. hTau‐A152T and hTau‐WT mice also differed strikingly in the level of spontaneous epileptic spike activity at baseline, which was higher in hTau‐A152T mice, but lower in hTau‐WT mice, than in NTG controls. Thus, overexpression of hTau‐A152T or hTau‐WT lowered the threshold for chemically induced epileptic activity, but at comparable levels of expression, only hTau‐A152T caused network hypersynchrony at baseline. Of note, periodic sharp wave complexes have been reported in a human A152T carrier 26.
Curiously, spike counts in singly transgenic CaMKII‐tTA mice were lower than in NTG controls, both at baseline and 20–60 min after PTZ injection. Conceivably, tTA increases the expression of endogenous genes whose products have anti‐epileptic effects. Alternatively, insertion of the CaMKII‐tTA transgene into the genome may have inactivated a gene whose product promotes or enables epileptic activity. These possibilities are not mutually exclusive and deserve to be explored in future studies. The anti‐epileptogenic CaMKII‐tTA effect could explain, at least in part, why crosses of hAPP and hTau mice yielded more hAPP/CaMKII‐tTA doubly transgenic mice than hAPP singly transgenic mice and suggests that the epileptogenic effects of the A152T variant may exceed those we were able to detect in mice co‐expressing hTau‐A152T and CaMKII‐tTA.
Consistent with the effects of hTau‐A152T and hTau‐WT on evoked and spontaneous epileptic activity, expression of either hTau species enhanced the increased risk of early death in hAPP mice, which have epileptiform activity even in the absence of hTau overexpression 46, 49. hTau‐A152T was more detrimental in this regard than hTau‐WT. This functional synergism with hAPP/Aβ may be a special, if not unique, feature of the A152T substitution, as it was not observed in mice co‐expressing hAPP/Aβ with hTau bearing FTDP‐17 mutations 89, 90, 91, 92, 93. Thus, besides increasing hTau levels, the A152T substitution appears to enhance tau's ability to support network hyperexcitability, a mechanism through which it could promote excitotoxicity and neurodegeneration.
Materials and Methods
Transgene construction
To generate 1N4R hTau cDNA, we amplified the hTau‐WT sequence from the pCI‐neo hTau plasmid (a gift from Dr. Akihiko Takashima) by polymerase chain reaction (PCR). For consistency with other studies, the amino acid and base pair residues are listed with reference to the 2N4R isoform of hTau. To enhance hTau expression, an intervening sequence and a Kozak sequence (ACC) were ligated to the 5′ end, and the bovine growth hormone polyA sequence was ligated to the 3′ end. The hTau sequence was then subcloned into the pTRE‐Tight vector (Clontech Laboratories) at the EcoRI and NotI sites. Thus, hTau‐encoding transgenes consisted (5′ to 3′) of a TRE‐Tight promoter (TRE), a synthetic intron amplified from the pIRES‐neo vector (Clontech), a Kozak (ACC) sequence, cDNA encoding A152T‐variant or WT hTau (1N4R), and a bovine growth hormone polyA signal sequence (bGHpA). To introduce the A152T variant into the hTau construct, the GCC (Ala) at positions 454–456 was converted to ACC (Thr) by PCR mutagenesis. The fragment of hTau‐WT or hTau‐A152T generated by NotI and XhoI digestion was used for pronuclear microinjections.
Mice, DOX treatment, and tissue preparation
TRE‐hTau‐A152T lines 1 and 3 and TRE‐hTau‐WT lines 12 and 32 were generated as described above. CaMKII‐tTA singly transgenic mice on the C57BL/6J background were from The Jackson Laboratory (stock number 007004) 28. hAPP mice from line J20 were generated in‐house 54. All of these mouse lines were maintained on a C57BL/6J background. rTg4510 mice on an FVB/N × CBA F1 background 31 were obtained from Dr. Jada Lewis (Mayo Clinic Jacksonville). Brain tissues of PS19 mice 94 on a C57BL/6J × C3H F1 background were obtained from Dr. Li Gan (Gladstone Institute of Neurological Disease, San Francisco). Newborn mice were weaned 4–6 weeks after birth. Mice were maintained on a 12‐h light/12‐h dark cycle and had free access to food and water. Unless indicated otherwise, they were group housed with up to five mice per cage. Mice were maintained on a regular chow (PicoLab Rodent Diet 5053, TestDiet) or chow containing DOX (200 mg/kg) (S3888, Bioserv, Fig 4; or 5TS4, Modified PicoLab Rodent Green, TestDiet, Fig 11).
For tissue analyses, mice were deeply anesthetized with avertin (2,2,2‐tribromoethanol, 250 mg/kg) by intraperitoneal injection and perfused transcardially with 0.9% NaCl. For Western blot analyses, hemibrains were snap frozen and stored at −80°C. For histological analyses, hemibrains were drop fixed in a glass vial with 10 ml of 4% paraformaldehyde, which was replaced after 48 h with phosphate‐buffered saline containing 30% sucrose. After the brains settled to the bottom of the vial, they were cut with a microtome (SM200R, Leica) and stored at −20°C.
Western blot analysis
Brain tissue samples were homogenized with a polypropylene pestle homogenizer in modified radioimmunoprecipitation (RIPA) assay buffer (50 mM Tris‐HCl, pH 7.4, 150 mM NaCl, 1% NP‐40, 0.25% (wt/vol) sodium deoxycholate, and 1 mM EDTA) containing Halt Protease and Phosphatase Inhibitor Cocktail (Thermo Scientific). Samples were sonicated (Episonic 1000, Epigentek) at amplitude 40 for 5 min and centrifuged at 20,000 relative centrifuge force (rcf) for 20 min. Protein concentration in supernatants was determined with a Bio‐Rad protein assay (Bio‐Rad). Equal amounts of protein were loaded onto NuPAGE 4–12% Bis‐Tris gels (Life Technologies) and transferred to nitrocellulose membranes with iBlot (Life Technologies). Nonspecific binding was blocked with Odyssey blocking buffer (927‐50000, LI‐COR), and the membranes were labeled with anti‐actin antibody (A2066, Sigma; 1:2,000) and the following anti‐tau antibodies (1:2,000): HT7 (MN1000, Thermo Scientific), Tau5 (MAB361, Millipore), Tau12 (MAB2241, Millipore), EP2456Y (MAB10417, Millipore), or PHF1 34 (a gift from Dr. Peter Davies, Albert Einstein College of Medicine, New York) for 12–15 h at 4°C. The membranes were co‐incubated with secondary antibodies: 680LT donkey anti‐rabbit (P/N 926‐68023, LI‐COR; 1:20,000) and 800CW donkey anti‐mouse (P/N 926‐32212, LI‐COR; 1:20,000) for 1 h at room temperature. Signals were quantified with an Odyssey CLx infrared imaging system and ImageStudio (LI‐COR).
Insoluble tau extraction
Brain tissue samples were homogenized in RIPA buffer, sonicated, and centrifuged at 13,000 rcf for 10 min. The supernatant was saved as total fraction, and the protein concentration was determined. The total fraction (100 μl, 1 mg/ml protein concentration) was centrifuged at 150,000 rcf for 15 min in a TLA100 rotor (Beckman Coulter). The pellets were dissolved in 2% sarkosyl for 2 h followed by centrifugation at 150,000 rcf for 15 min in a TLA100 rotor. After two repetitions of this step, the pellets were added to sample loading buffer and loaded on SDS‐PAGE at equal volumes.
Quantitative RT‐PCR
Total RNA was isolated from dissected frozen mouse brain tissue with the RNeasy Mini kit (Qiagen) and reverse transcribed with random hexamers and oligo(dT) primers. The TaqMan gene expression assay and ABI Prism 7900HT sequence detector (Applied Biosystems) were used to determine the levels of hTau, and GAPDH mRNA according to the manufacturer's instructions. ABI probes were used to detect hTau (Hs00902194_m1) and mouse GAPDH mRNA (Mm99999914_g1‐VIC). For quantification, hTau/GAPDH ratios were normalized to the average value in hTau‐WT (L32) mice.
Immunohistochemistry
Coronal brain sections 30 μm thick were prepared and immunostained as described 29. The primary antibodies were the anti‐tau antibodies MC1 (1:1,000) 37, 38, PHF1 (1:1,000), HT7 (1:1,000), and AT8 (1:250, MN1020, Thermo Scientific); anti‐GFAP (1:1,000, MAB3402, Millipore); anti‐Iba1 (1:5,000, ab15690, Abcam); and anti‐NeuN (1:1,000, MAB377, Millipore). Binding of these antibodies was detected with biotinylated donkey anti‐mouse antibodies (Jackson Immunoresearch; 1:1,000), avidin–biotin complexes (Vector Laboratories), and 3,3′‐diaminobenzidine (Sigma).
Sections labeled with anti‐tau antibodies were imaged on a digital microscope (BZ‐9000, Keyence America). Sections immunostained with an antibody against GFAP were analyzed with an Olympus bright field digital microscope (BX41, Olympus America Inc.). For each mouse, a total of three sections (four digital images per section at 400× magnification) were obtained from the hippocampus and analyzed with the ImageJ program (NIH) to estimate the average optical density of immunoreactivities and correct for differences in background staining. Sections labeled with an antibody against Iba1 were analyzed with the same microscope system using the Image‐Pro Plus program (Media Cybernetics). For each mouse, a total of three sections (10 digital images per section at 400× magnification) were analyzed to estimate the average number of immunolabeled cells per unit area (0.1 mm2).
Sections immunostained for NeuN were used to estimate neuronal counts by unbiased stereology 95. For each mouse, three coronal hemibrain sections containing the neocortex and hippocampus were outlined using an Olympus BX51 microscope running StereoInvestigator 8.21.1 software (Micro‐BrightField). Grid sizes for the granular layer of the DG and for the pyramidal layers of CA3 and CA1 were 150 × 150 μm and the counting frames were 30 × 30 μm. A systematic sampling of the regions of interest was made from a random starting point. Full penetration of the section by the antibody was confirmed by focusing throughout the entire Z‐axis. Sections were analyzed using a 100× 1.4 PlanApo oil‐immersion objective. The average mounted tissue thickness was 8.0 μm, and a 4.0‐μm high dissector allowed for 2‐μm top and bottom guard zones. Results were expressed as estimated total number of NeuN‐positive cells per brain region.
Gallyas silver staining
Brain sections were silver‐stained according to the method of Gallyas 96 with several modifications. Brain tissues fixed in 4% paraformaldehyde were sectioned at 40 μm with a vibratome and mounted on Superfrost Plus slides. Sections were rinsed in distilled water and placed in 5% periodic acid for 5 min. After two washes in distilled water, they were placed in alkaline silver iodine solution (4% sodium hydroxide, 10% potassium iodide, and 1% silver nitrate in distilled water) for 1 min and washed in 0.5% acetic acid for 10 min. They were then placed for 8 min in developer solution, which was freshly prepared as described 96 with the following exceptions: 2.0 g of ammonium nitrate was used to prepare solutions B and C, and 2.5 ml of 37% formaldehyde was used to prepare solution C. Subsequently, sections were washed in 0.5% acetic acid for 3 min and in distilled water for 5 min. They were then placed in 0.1% gold chloride for 5 min, rinsed in distilled water, placed in 1% sodium thiosulfate solution, washed with tap water, counterstained with 0.1% nuclear fast red for 1 min, washed with tap water, and dehydrated and mounted in Entellan mounting medium.
Behavioral testing
Mice were tested in different behavioral paradigms in the sequence summarized in Appendix Table S1. The order in which mice were tested in any given behavioral paradigm was randomized and investigators were blinded to the genotype of mice.
Morris water maze
After 2–3 days of single housing, mice were spatially trained to locate a hidden platform for 4–9 days, probed for spatial memory retention 24 h after the last hidden training trial, and then trained to find a cued platform, as described 88. Briefly, training with the hidden platform was continued until the mean latency of NTG mice reached ~20 s. Twenty‐four hours after the last training session, the mice were tested in a 60‐s probe trial followed by training to locate a visibly cued platform to exclude general performance deficits. To minimize carryover effects between repeated MWM assessments in the same mice, different rooms with different spatial configurations were used; however, because of scheduling and space constraints, 4‐ to 6‐month‐old and 11‐ to 14‐month‐old mice from cohort 1 were tested in the same room, but the configuration of the extramaze cues was explicitly altered from the previous testing configurations.
Exceptions to this standard testing protocol were made for 11‐ to 14‐month‐old mice from cohort 1 and 11‐ to 17‐month‐old mice from cohort 2. Notably, within these groups, all conditions were consistently applied to all mice regardless of genotype. Because the same groups of mice were tested repeatedly in the MWM at different ages, which can improve performance with increasing levels of experience, we decreased the training for 11‐ to 14‐month‐old mice from cohort 1 by giving them just two trials per day on days 1–4. Because NTG mice from this group rapidly achieved mean escape latencies < 20 s, we conducted interim probe trials on all mice of this group before the training trials on days 2–4 to assess spatial memory. Despite their short escape latency during training trials, the NTG mice did not show clear spatial memory in the interim probe trials. To further improve spatial learning and memory, we increased the number of training trials on day 5 to four.
The other exception to the standard protocol involved 11‐ to 17‐month‐old mice from cohort 2, which were group housed and trained to locate first a cued platform (six trials) using a latency cutoff of 60 s and then a hidden platform using just two trials per day and a latency cutoff of 90 s. Twenty‐four hours after the last training trial, these mice were tested in a probe trial for 90 s. To combine these probe trial results with those from the standard training protocol, we analyzed only the first 60 s of the probe trials (Fig 6S–V). Data reflecting the full 90‐s probe trial are shown in Fig EV5D–G.
Swim paths were recorded and analyzed with an Ethovision XT video tracking system (Noldus Information Technology). Performance measures included the latency and distance to locate the platform and swim speed in the hidden and cued learning trials, and the latency to cross the original platform location and platform crossings in the probe trials.
Elevated plus maze
The elevated plus maze (Kinder Scientific) consists of two open arms (without walls) that intersect at 90° with two enclosed arms (with walls) 63 cm above the ground. Before testing, mice were allowed to habituate to the testing room under dim light for 1 h. During testing, mice were placed at the intersection of the open and closed arms and allowed to explore for 10 min. Their movements were recorded by breaks in infrared beams positioned along the length of the open and closed arms. The maze was cleaned with 70% ethanol between mice.
Open field
Open field activity was assessed in a clear plastic chamber (41 × 41 × 30 cm) with two 16 × 16 photobeam arrays that automatically detect horizontal and vertical movements (Flex‐Field/Open Field Photobeam Activity System, San Diego Instruments). Before testing, mice were allowed to habituate to the testing room under normal light for 1 h. During testing, mice were placed in one of four identical clear plastic chambers for 15 min. The chambers were cleaned with 70% alcohol between mice.
Nesting
To assess innate nesting behavior, mice were single‐housed with one nestlet per cage. The ability of each mouse to build a new nest was assessed at 2, 6, and 24 h after the introduction of the new nestlet. Composite nest building scores were assigned at each time point based on the following criteria: 0, nestlet untouched; 1, < 10% of the nestlet was shredded; 2, 10–50% of the nestlet was shredded but there was no shape to the nest; 3, 10–50% of the nestlet was shredded and there was shape to the nest; 4, 50–90% of the nestlet was shredded but there was no shape to the nest; 5, 50–90% of the nestlet was shredded and there was shape to the nest; 6, > 90% of the nestlet was shredded but the nest was flat; and 7, > 90% of the nestlet was shredded and the nest had walls that were at least as tall as the mouse on > 50% of its sides.
Pole test
Mice were placed face down atop a vertical pole (50 cm high and 1 cm in diameter). The latency to climb down the pole was recorded during three trials per day for three consecutive days with a latency cutoff of 60 s per trial. No mouse fell from the pole. The mean latency on day 3 was analyzed by genotype.
Balance beam
The balance beam apparatus consisted of an acrylic beam (0.5 inch in diameter), an elevated stage, and an elevated dark box. The stage was placed at one end of the beam and the dark box at the other; the dark box had an opening at the end of the beam to allow entry. Mice were placed on the stage and trained to traverse the beam toward the dark box. On day 1, two guided and three unguided trials were carried out. Mice were guided to the dark box if they did not reach it by 120 s. On day 2, mice were trained in three unguided trials (120‐s latency cutoff). On day 3, the beam was replaced with a thinner, more challenging beam (0.25 inch in diameter). Three trials without guidance were recorded, and the mean latency from the three trials was analyzed by genotype.
Rotarod
On day 1 of training, mice were placed on the rotarod apparatus (Med Associates) with the rod rotating at a constant speed of 16 rpm. A trial ended when the mouse fell off the rod or after 5 min had elapsed. The mice were tested at the constant speed in three trials 15–20 min apart. On day 2 of training, after mice were placed on the rotarod, the rotation speed was increased by 4 rpm every 30 s, from 4 to 40 rpm. A trial ended when the mouse fell off the rod or after 5 min had passed. If a mouse wrapped itself around the rotarod and spun for two or more rotations, the trial was stopped, and the latency was recorded. There were six trials on day 2 and the mean latency to fall was analyzed by genotype.
Social approach test
Social approach and preference were assessed with a three‐chamber apparatus by comparing the amount of time mice spent in close contact (nose within 2 cm and directly pointed at the cup) with an inverted wire cup containing a stranger mouse or an identical empty cup. The apparatus consisted of a polycarbonate box (24 × 16 × 8.75 inches) partitioned into three 8 × 16 inch chambers. The test was performed under dim light over 2 days. On day 1, test mice were individually placed in the empty box and allowed to habituate for 25 min; in separate sessions, stranger mice were habituated to the wire cups in the box for at least 20 min (10‐min session, 10‐min break, 10‐min session). On day 2, test mice were habituated to the empty box for 5 min. After habituation, an empty cup was placed in one chamber, and a cup containing a stranger mouse of the same sex was placed in the opposite chamber. The test mouse was then placed in the center chamber and allowed to explore the box for 10 min. Movements were recorded with video cameras, and the amount of close contact time was analyzed (Topscan, CleverSys).
EEG and PTZ challenge
For video‐EEG, electrodes were implanted between the skull and the surface of the left frontal cortex (reference) and both parietal cortices as described 46. All EEG recordings were done at least 3 weeks after electrode implantation on freely behaving mice. For Fig 10, digital EEG activity and video were recorded with Harmonie software (version 5.0b, Stellate Systems; Natus). Epileptic spikes were detected automatically with threshold Amp8. Artifactual spikes associated with movements of the recording wire were excluded from analysis. Spike frequency at rest was measured for 6 h during the light cycle and 6 h during the dark cycle and expressed as number of spikes per hour. Mice were then injected with PTZ (30 mg/kg) during the light cycle. The PTZ stock solution (5 mg/ml in phosphate‐buffered saline) was prepared from powder on the same day.
For Fig 11F, digital EEG activity and video were recorded with a PowerLab data acquisition system 16/35 and analyzed with LabChart 7 Pro software (AD Instruments) 85. Spike frequency at rest was measured for 4 h during the light cycle and 3.2–4 h during the dark cycle and expressed as number of spikes per h.
Acute slice electrophysiology
Hippocampal slice preparation
Acute sagittal brain slices (400 μm) from 4‐ to 20‐month‐old mice were prepared with a modified neuroprotective slicing and recovery method as described 97 to improve the health of slices from aged animals. Briefly, mice were deeply anesthetized with isoflurane and transcardially perfused with 30 ml of chilled oxygenated (95% O2, 5% CO2) slicing artificial cerebrospinal fluid (ACSF; 92 mM N‐methyl‐D‐glucamine, 2.5 mM KCl, 1.2 mM NaH2PO4, 30 mM NaHCO3, 20 mM HEPES, 25 mM glucose, 2 mM thiourea, 5 mM sodium ascorbate, 3 mM sodium pyruvate, 12 mM N‐acetyl‐L‐cysteine, 0.5 mM CaCl2, 10 mM MgSO4). Brains were quickly removed and sliced with a vibrating microtome (HM650V, Thermo Scientific). Slices were first incubated in slicing ACSF for 10 min at 35°C and then in recovery ACSF (92 mM NaCl, 2.5 mM KCl, 1.2 mM NaH2PO4, 30 mM NaHCO3, 20 mM HEPES, 25 mM glucose, 2 mM thiourea, 5 mM sodium ascorbate, 3 mM sodium pyruvate, 12 mM N‐acetyl‐L‐cysteine, 2 mM CaCl2, 2 mM MgSO4) for 1 h at room temperature. Slices were then transferred to a holding chamber containing room temperature oxygenated recording ACSF (126 mM NaCl, 2.5 mM KCl, 1.25 mM NaH2PO4, 26 mM NaHCO3, 12.5 mM glucose, 2.5 mM CaCl2, 1.3 mM MgSO4) and allowed to equilibrate for at least 1 h before recording. For recording, slices were placed in a recording chamber mounted on an Olympus BX51WI microscope equipped with infrared DIC optics (900 nm) and perfused with warmed (30–33°C) oxygenated recording ACSF at a flow rate of 2 ml/min.
Field potential measurements
A bipolar concentric electrode was placed on mossy fibers at the hilar/CA3 border to evoke fEPSPs. fEPSPs were recorded 250 μm away in the stratum lucidum of CA3 region with glass micropipettes (3–4 MΩ) filled with recording ACSF. Data were acquired with a MultiClamp 700B amplifier (Molecular Devices) and WinLTP software (University of Bristol). The stimulation rate was 0.05 Hz throughout the experiment unless otherwise noted. Three responses were averaged for each data point. Mossy fiber fEPSPs were identified with the following criteria 98, 99: (i) negative waveform restricted to the stratum lucidum, (ii) short latency (< 5 ms), (iii) fast time course (< 10 ms), and (iv) selective reduction by the group II metabotropic glutamate receptor agonist (2S,2′R,3′R)‐2‐(2,3‐dicarboxycyclopropyl)glycine (DCG‐IV, 2 μM; Tocris Bioscience). Stimulation strength that elicited 30% of the maximum response was used to assess paired‐pulse facilitation and LTP. Paired‐pulse facilitation was induced with two stimulation pulses 50 ms apart, and the PPR was calculated by dividing the response elicited with the second pulse by the response elicited with the first pulse. LTP was induced with 125 stimulation pulses at 25 Hz, repeated twice 20 s apart. Data were analyzed offline with Clampfit software (Molecular Devices). Slices in which baseline fEPSP responses fluctuated > 20% were excluded from the analysis.
Statistical analysis
The statistical tests used for each dataset are specified in the figure legends. Statistical analyses were done with Prism 6 (GraphPad Software) or the statistical programming language R (http://www.R-project.org/). Normality was assessed with the Shapiro–Wilk test for datasets with sample size < 10 per group. For larger groups, parametric tests were used without assessing normality. Variances were assessed with the F‐test (two groups) or Bartlett's test (more than two groups). A two‐tailed t‐test was used for most comparisons of two groups with Gaussian distribution and equal variances. However, crossings of the target location in MWM probe trials were analyzed by one‐tailed t‐test because we expected to see more crossings of target than nontarget locations. For individual pairs in a dataset, P‐values were adjusted with the Holm correction for multiple comparisons. The two‐tailed Welch's t‐test was used to compare two groups with unequal variances. For comparisons of nesting scores, the nonparametric Wilcoxon rank‐sum test was used because the nesting scores were discrete. For multiple group comparisons with Gaussian distribution and equal variance, we used one‐way ANOVA with post hoc Tukey or Dunnett's test. For multiple group comparisons with non‐Gaussian distribution and equal variance, Kruskal–Wallis test with post hoc Dunn's test was used. For multiple group comparisons with Gaussian distribution and unequal variance, two‐tailed Welch's t‐test was used. Input/output curves were assessed by linear regression analysis. Learning curves in the MWM were analyzed with a Cox proportional hazards model with mixed effects. To assess deviations from the Mendelian inheritance of transgenes, we used chi‐square goodness‐of‐fit tests. Interactions among the three transgenes were evaluated by logistic regression. Values reported are means ± SEM. Differences were considered significant at P < 0.05.
Author contributions
SM, BD, RP, TMG, and LM designed experiments. BD and PT obtained and analyzed electrophysiological data. SM, IL, AD, and RC performed the behavioral tests. DK performed qRT‐PCR. WG, XW, and G‐QY managed mouse lines and genotyped mice. SM and EM performed immunohistochemistry. SM, LM, BD, TMG, and PT wrote the manuscript. LM supervised the study.
Conflict of interest
L.M. receives research support from Bristol‐Myers Squibb and serves as a scientific advisory board member for Acumen Pharmaceuticals, Alkahest, E‐scape Bio, and Neuropore Therapies.
Supporting information
Appendix
Expanded View Figures PDF
Review Process File
Acknowledgements
We thank Peter Davies for the PHF1 and MC1 antibodies, Jada Lewis for rTg4510 mice, Li Gan for brain tissues from PS19 mice, Pascal Sanchez for advice on EEG analysis, Sethu Sankaranarayanan for advice on the tau ELISA, Junli Zhang for pronuclear microinjections, Sharon Lee, Jing Kang for mouse colony maintenance, Jordan Harbin and Bozhong Hu for technical assistance, Mariel Finucane, Clifford Anderson‐Bergman, and Grisell Diaz‐Ramirez for statistical analysis, Monica Dela Cruz, Courtney Dickerson, and Amy Cheung for administrative assistance, and Stephen Ordway, Gary Howard, Celeste Brennecka, and Crystal Herron for editorial review. This work was supported by NIH grant NS041787 and gifts from the Tau Consortium (to L.M.). The animal care facility was partly supported by an NIH Extramural Research Facilities Improvement Program Project (C06 RR018928). Behavioral data were obtained with the help of the Gladstone Institutes' Behavioral Core (supported by NIH grant P30NS065780).
EMBO Reports (2016) 17: 530–551
See also: JM Decker et al
References
- 1. Morris M, Maeda S, Vossel K, Mucke L (2011) The many faces of tau. Neuron 70: 410–426 [DOI] [PMC free article] [PubMed] [Google Scholar]
- 2. Huang Y, Mucke L (2012) Alzheimer mechanisms and therapeutic strategies. Cell 148: 1204–1222 [DOI] [PMC free article] [PubMed] [Google Scholar]
- 3. Irwin DJ, Cairns NJ, Grossman M, McMillan CT, Lee EB, Van Deerlin VM, Lee VM, Trojanowski JQ (2015) Frontotemporal lobar degeneration: defining phenotypic diversity through personalized medicine. Acta Neuropathol 129: 469–491 [DOI] [PMC free article] [PubMed] [Google Scholar]
- 4. Lee VM, Goedert M, Trojanowski JQ (2001) Neurodegenerative tauopathies. Annu Rev Neurosci 24: 1121–1159 [DOI] [PubMed] [Google Scholar]
- 5. Grundke‐Iqbal I, Iqbal K, Quinlan M, Tung YC, Zaidi MS, Wisniewski HM (1986) Microtubule‐associated protein tau. A component of Alzheimer paired helical filaments. J Biol Chem 261: 6084–6089 [PubMed] [Google Scholar]
- 6. Kosik KS, Joachim CL, Selkoe DJ (1986) Microtubule‐associated protein tau (t) is a major antigenic component of paired helical filaments in Alzheimer disease. Proc Natl Acad Sci USA 83: 4044–4048 [DOI] [PMC free article] [PubMed] [Google Scholar]
- 7. Kondo J, Honda T, Mori H, Hamada Y, Miura R, Ogawara M, Ihara Y (1988) The carboxyl third of tau is tightly bound to paired helical filaments. Neuron 1: 827–834 [DOI] [PubMed] [Google Scholar]
- 8. Nukina N, Ihara Y (1986) One of the antigenic determinants of paired helical filaments is related to tau protein. J Biochem 99: 1541–1544 [DOI] [PubMed] [Google Scholar]
- 9. Wood JG, Mirra SS, Pollock NJ, Binder LI (1986) Neurofibrillary tangles of Alzheimer disease share antigenic determinants with the axonal microtubule‐associated protein tau (t). Proc Natl Acad Sci USA 83: 4040–4043 [DOI] [PMC free article] [PubMed] [Google Scholar]
- 10. Lee VM, Balin BJ, Otvos L Jr, Trojanowski JQ (1991) A68: a major subunit of paired helical filaments and derivatized forms of normal Tau. Science 251: 675–678 [DOI] [PubMed] [Google Scholar]
- 11. Braak H, Braak E (1991) Neuropathological stageing of Alzheimer‐related changes. Acta Neuropathol 82: 239–259 [DOI] [PubMed] [Google Scholar]
- 12. Giannakopoulos P, Herrmann FR, Bussiere T, Bouras C, Kovari E, Perl DP, Morrison JH, Gold G, Hof PR (2003) Tangle and neuron numbers, but not amyloid load, predict cognitive status in Alzheimer's disease. Neurology 60: 1495–1500 [DOI] [PubMed] [Google Scholar]
- 13. Hyman BT, Phelps CH, Beach TG, Bigio EH, Cairns NJ, Carrillo MC, Dickson DW, Duyckaerts C, Frosch MP, Masliah E et al (2012) National Institute on Aging‐Alzheimer's Association guidelines for the neuropathologic assessment of Alzheimer's disease. Alzheimers Dement 8: 1–13 [DOI] [PMC free article] [PubMed] [Google Scholar]
- 14. Wagshal D, Sankaranarayanan S, Guss V, Hall T, Berisha F, Lobach I, Karydas A, Voltarelli L, Scherling C, Heuer H et al (2015) Divergent CSF tau alterations in two common tauopathies: Alzheimer's disease and progressive supranuclear palsy. J Neurol Neurosurg Psychiatry 86: 244–250 [DOI] [PMC free article] [PubMed] [Google Scholar]
- 15. Maruyama M, Shimada H, Suhara T, Shinotoh H, Ji B, Maeda J, Zhang MR, Trojanowski JQ, Lee VM, Ono M et al (2013) Imaging of tau pathology in a tauopathy mouse model and in Alzheimer patients compared to normal controls. Neuron 79: 1094–1108 [DOI] [PMC free article] [PubMed] [Google Scholar]
- 16. Chien DT, Bahri S, Szardenings AK, Walsh JC, Mu F, Su MY, Shankle WR, Elizarov A, Kolb HC (2013) Early clinical PET imaging results with the novel PHF‐tau radioligand [F‐18]‐T807. J Alzheimers Dis 34: 457–468 [DOI] [PubMed] [Google Scholar]
- 17. Okamura N, Furumoto S, Fodero‐Tavoletti MT, Mulligan RS, Harada R, Yates P, Pejoska S, Kudo Y, Masters CL, Yanai K et al (2014) Non‐invasive assessment of Alzheimer's disease neurofibrillary pathology using 18F‐THK5105 PET. Brain 137: 1762–1771 [DOI] [PubMed] [Google Scholar]
- 18. Reed LA, Wszolek ZK, Hutton M (2001) Phenotypic correlations in FTDP‐17. Neurobiol Aging 22: 89–107 [DOI] [PubMed] [Google Scholar]
- 19. Boeve BF, Hutton M (2008) Refining frontotemporal dementia with parkinsonism linked to chromosome 17: introducing FTDP‐17 (MAPT) and FTDP‐17 (PGRN). Arch Neurol 65: 460–464 [DOI] [PMC free article] [PubMed] [Google Scholar]
- 20. Goedert M, Ghetti B, Spillantini MG (2012) Frontotemporal dementia: implications for understanding Alzheimer disease. Cold Spring Harb Perspect Med 2: a006254 [DOI] [PMC free article] [PubMed] [Google Scholar]
- 21. Ryman DC, Acosta‐Baena N, Aisen PS, Bird T, Danek A, Fox NC, Goate A, Frommelt P, Ghetti B, Langbaum JB et al (2014) Symptom onset in autosomal dominant Alzheimer disease: a systematic review and meta‐analysis. Neurology 83: 253–260 [DOI] [PMC free article] [PubMed] [Google Scholar]
- 22. Sanders DW, Kaufman SK, DeVos SL, Sharma AM, Mirbaha H, Li A, Barker SJ, Foley AC, Thorpe JR, Serpell LC et al (2014) Distinct tau prion strains propagate in cells and mice and define different tauopathies. Neuron 82: 1271–1288 [DOI] [PMC free article] [PubMed] [Google Scholar]
- 23. Coppola G, Chinnathambi S, Lee JJ, Dombroski BA, Baker MC, Soto‐Ortolaza AI, Lee SE, Klein E, Huang AY, Sears R et al (2012) Evidence for a role of the rare p. A152T variant in MAPT in increasing the risk for FTD‐spectrum and Alzheimer's diseases. Hum Mol Genet 21: 3500–3512 [DOI] [PMC free article] [PubMed] [Google Scholar]
- 24. Kara E, Ling H, Pittman AM, Shaw K, de Silva R, Simone R, Holton JL, Warren JD, Rohrer JD, Xiromerisiou G et al (2012) The MAPT p.A152T variant is a risk factor associated with tauopathies with atypical clinical and neuropathological features. Neurobiol Aging 33: 2231 e7–2231 e14. [DOI] [PMC free article] [PubMed] [Google Scholar]
- 25. Lee SE, Tartaglia MC, Yener G, Genc S, Seeley WW, Sanchez‐Juan P, Moreno F, Mendez MF, Klein E, Rademakers R et al (2013) Neurodegenerative disease phenotypes in carriers of MAPT p. A152T, a risk factor for frontotemporal dementia spectrum disorders and Alzheimer disease. Alzheimer Dis Assoc Disord 27: 302–309 [DOI] [PMC free article] [PubMed] [Google Scholar]
- 26. Kovacs GG, Wohrer A, Strobel T, Botond G, Attems J, Budka H (2011) Unclassifiable tauopathy associated with an A152T variation in MAPT exon 7. Clin Neuropathol 30: 3–10 [DOI] [PubMed] [Google Scholar]
- 27. Klopotowska D, Strzadala L, Matuszyk J (2008) Inducibility of doxycycline‐regulated gene in neural and neuroendocrine cells strongly depends on the appropriate choice of a tetracycline‐responsive promoter. Neurochem Int 52: 221–229 [DOI] [PubMed] [Google Scholar]
- 28. Mayford M, Bach ME, Huang YY, Wang L, Hawkins RD, Kandel ER (1996) Control of memory formation through regulated expression of a CaMKII transgene. Science 274: 1678–1683 [DOI] [PubMed] [Google Scholar]
- 29. Harris JA, Koyama A, Maeda S, Ho K, Devidze N, Dubal DB, Yu G‐Q, Masliah E, Mucke L (2012) Human P301L‐mutant tau expression in mouse entorhinal‐hippocampal network causes tau aggregation and presynaptic pathology but no cognitive deficits. PLoS One 7: e45881 [DOI] [PMC free article] [PubMed] [Google Scholar]
- 30. Barten DM, Cadelina GW, Hoque N, DeCarr LB, Guss VL, Yang L, Sankaranarayanan S, Wes PD, Flynn ME, Meredith JE et al (2011) Tau transgenic mice as models for cerebrospinal fluid tau biomarkers. J Alzheimers Dis 24(Suppl 2): 127–141 [DOI] [PubMed] [Google Scholar]
- 31. SantaCruz K, Lewis J, Spires T, Paulson J, Kotilinek L, Ingelsson M, Guimaraes A, DeTure M, Ramsden M, McGowan E et al (2005) Tau suppression in a neurodegenerative mouse model improves memory function. Science 309: 476–481 [DOI] [PMC free article] [PubMed] [Google Scholar]
- 32. Delerue F, White M, Ittner LM (2014) Inducible, tightly regulated and non‐leaky neuronal gene expression in mice. Transgenic Res 23: 225–233 [DOI] [PubMed] [Google Scholar]
- 33. West MJ, Coleman PD, Flood DG, Troncoso JC (1994) Differences in the pattern of hippocampal neuronal loss in normal ageing and Alzheimer's disease. Lancet 344: 769–772 [DOI] [PubMed] [Google Scholar]
- 34. Otvos L Jr, Feiner L, Lang E, Szendrei GI, Goedert M, Lee VM (1994) Monoclonal antibody PHF‐1 recognizes tau protein phosphorylated at serine residues 396 and 404. J Neurosci Res 39: 669–673 [DOI] [PubMed] [Google Scholar]
- 35. Porzig R, Singer D, Hoffmann R (2007) Epitope mapping of mAbs AT8 and Tau5 directed against hyperphosphorylated regions of the human tau protein. Biochem Biophys Res Commun 358: 644–649 [DOI] [PubMed] [Google Scholar]
- 36. Sydow A, Van der Jeugd A, Zheng F, Ahmed T, Balschun D, Petrova O, Drexler D, Zhou L, Rune G, Mandelkow E et al (2011) Tau‐induced defects in synaptic plasticity, learning, and memory are reversible in transgenic mice after switching off the toxic Tau mutant. J Neurosci 31: 2511–2525 [DOI] [PMC free article] [PubMed] [Google Scholar]
- 37. Maeda S, Sahara N, Saito Y, Murayama M, Yoshiike Y, Kim H, Miyasaka T, Murayama S, Ikai A, Takashima A (2007) Granular tau oligomers as intermediates of tau filaments. Biochemistry 46: 3856–3861 [DOI] [PubMed] [Google Scholar]
- 38. Weaver CL, Espinoza M, Kress Y, Davies P (2000) Conformational change as one of the earliest alterations of tau in Alzheimer's disease. Neurobiol Aging 21: 719–727 [DOI] [PubMed] [Google Scholar]
- 39. Cunningham C, Deacon R, Wells H, Boche D, Waters S, Diniz CP, Scott H, Rawlins JN, Perry VH (2003) Synaptic changes characterize early behavioural signs in the ME7 model of murine prion disease. Eur J Neurosci 17: 2147–2155 [DOI] [PubMed] [Google Scholar]
- 40. Lin L, Chen G, Kuang H, Wang D, Tsien JZ (2007) Neural encoding of the concept of nest in the mouse brain. Proc Natl Acad Sci USA 104: 6066–6071 [DOI] [PMC free article] [PubMed] [Google Scholar]
- 41. Heller HC, Salehi A, Chuluun B, Das D, Lin B, Moghadam S, Garner CC, Colas D (2014) Nest building is impaired in the Ts65Dn mouse model of Down syndrome and rescued by blocking 5HT2a receptors. Neurobiol Learn Mem 116: 162–171 [DOI] [PubMed] [Google Scholar]
- 42. Han HJ, Allen CC, Buchovecky CM, Yetman MJ, Born HA, Marin MA, Rodgers SP, Song BJ, Lu HC, Justice MJ et al (2012) Strain background influences neurotoxicity and behavioral abnormalities in mice expressing the tetracycline transactivator. J Neurosci 32: 10574‐10586 [DOI] [PMC free article] [PubMed] [Google Scholar]
- 43. Abbott LF, Regehr WG (2004) Synaptic computation. Nature 431: 796–803 [DOI] [PubMed] [Google Scholar]
- 44. Zucker RS, Regehr WG (2002) Short‐term synaptic plasticity. Annu Rev Physiol 64: 355–405 [DOI] [PubMed] [Google Scholar]
- 45. Vossel KA, Beagle AJ, Rabinovici GD, Shu H, Lee SE, Naasan G, Hegde M, Cornes SB, Henry ML, Nelson AB et al (2013) Seizures and epileptiform activity in the early stages of Alzheimer disease. JAMA Neurol 70: 1158–1166 [DOI] [PMC free article] [PubMed] [Google Scholar]
- 46. Sanchez PE, Zhu L, Verret L, Vossel KA, Orr AG, Cirrito JR, Devidze N, Ho K, Yu G‐Q, Palop JJ et al (2012) Levetiracetam suppresses neuronal network dysfunction and reverses synaptic and cognitive deficits in an Alzheimer's disease model. Proc Natl Acad Sci USA 109: E2895–E2903 [DOI] [PMC free article] [PubMed] [Google Scholar]
- 47. Palop JJ, Mucke L (2010) Amyloid‐beta‐induced neuronal dysfunction in Alzheimer's disease: from synapses toward neural networks. Nat Neurosci 13: 812–818 [DOI] [PMC free article] [PubMed] [Google Scholar]
- 48. Palop JJ, Mucke L (2009) Epilepsy and cognitive impairments in Alzheimer disease. Arch Neurol 66: 435–440 [DOI] [PMC free article] [PubMed] [Google Scholar]
- 49. Palop JJ, Chin J, Roberson ED, Wang J, Thwin MT, Bien‐Ly N, Yoo J, Ho KO, Yu G‐Q, Kreitzer A et al (2007) Aberrant excitatory neuronal activity and compensatory remodeling of inhibitory hippocampal circuits in mouse models of Alzheimer's disease. Neuron 55: 697–711 [DOI] [PMC free article] [PubMed] [Google Scholar]
- 50. Roberson ED, Halabisky B, Yoo JW, Yao J, Chin J, Yan F, Wu T, Hamto P, Devidze N, Yu G‐Q et al (2011) Amyloid‐β/Fyn‐induced synaptic, network, and cognitive impairments depend on tau levels in multiple mouse models of Alzheimer's disease. J Neurosci 31: 700–711 [DOI] [PMC free article] [PubMed] [Google Scholar]
- 51. Verret L, Mann EO, Hang GB, Barth AM, Cobos I, Ho K, Devidze N, Masliah E, Kreitzer AC, Mody I et al (2012) Inhibitory interneuron deficit links altered network activity and cognitive dysfunction in Alzheimer model. Cell 149: 708–721 [DOI] [PMC free article] [PubMed] [Google Scholar]
- 52. Suberbielle E, Sanchez PE, Kravitz AV, Wang X, Ho K, Eilertson K, Devidze N, Kreitzer AC, Mucke L (2013) Physiologic brain activity causes DNA double‐strand breaks in neurons, with exacerbation by amyloid‐β. Nat Neurosci 16: 613–621 [DOI] [PMC free article] [PubMed] [Google Scholar]
- 53. Orr AG, Hsiao EC, Wang MM, Ho K, Kim DH, Wang X, Guo W, Kang J, Yu GQ, Adame A et al (2015) Astrocytic adenosine receptor A2A and Gs‐coupled signaling regulate memory. Nat Neurosci 18: 423–434 [DOI] [PMC free article] [PubMed] [Google Scholar]
- 54. Mucke L, Masliah E, Yu G‐Q, Mallory M, Rockenstein E, Tatsuno G, Hu K, Kholodenko D, Johnson‐Wood K, McConlogue L (2000) High‐level neuronal expression of Aβ1‐42 in wild‐type human amyloid protein precursor transgenic mice: synaptotoxicity without plaque formation. J Neurosci 20: 4050–4058 [DOI] [PMC free article] [PubMed] [Google Scholar]
- 55. Chin J, Palop JJ, Puoliväli J, Massaro C, Bien‐Ly N, Gerstein H, Scearce‐Levie K, Masliah E, Mucke L (2005) Fyn kinase induces synaptic and cognitive impairments in a transgenic mouse model of Alzheimer's disease. J Neurosci 25: 9694–9703 [DOI] [PMC free article] [PubMed] [Google Scholar]
- 56. Chin J, Palop JJ, Yu G‐Q, Kojima N, Masliah E, Mucke L (2004) Fyn kinase modulates synaptotoxicity, but not aberrant sprouting, in human amyloid precursor protein transgenic mice. J Neurosci 24: 4692–4697 [DOI] [PMC free article] [PubMed] [Google Scholar]
- 57. Labbe C, Ogaki K, Lorenzo‐Betancor O, Soto‐Ortolaza AI, Walton RL, Rayaprolu S, Fujioka S, Murray ME, Heckman MG, McCarthy A et al (2015) Role for the microtubule‐associated protein tau variant p.A152T in risk of alpha‐synucleinopathies. Neurology 85: 1680–1686 [DOI] [PMC free article] [PubMed] [Google Scholar]
- 58. Desikan RS, Schork AJ, Wang Y, Witoelar A, Sharma M, McEvoy LK, Holland D, Brewer JB, Chen CH, Thompson WK et al (2015) Genetic overlap between Alzheimer's disease and Parkinson's disease at the MAPT locus. Mol Psychiatry 20: 1588–1595 [DOI] [PMC free article] [PubMed] [Google Scholar]
- 59. Monti G, Meletti S (2015) Emotion recognition in temporal lobe epilepsy: a systematic review. Neurosci Biobehav Rev 55: 280–293 [DOI] [PubMed] [Google Scholar]
- 60. Fong H, Wang C, Knoferle J, Walker D, Balestra ME, Tong LM, Leung L, Ring KL, Seeley WW, Karydas A et al (2013) Genetic correction of tauopathy phenotypes in neurons derived from human induced pluripotent stem cells. Stem Cell Rep 1: 226–234 [DOI] [PMC free article] [PubMed] [Google Scholar]
- 61. Wang Y, Martinez‐Vicente M, Kruger U, Kaushik S, Wong E, Mandelkow EM, Cuervo AM, Mandelkow E (2009) Tau fragmentation, aggregation and clearance: the dual role of lysosomal processing. Hum Mol Genet 18: 4153–4170 [DOI] [PMC free article] [PubMed] [Google Scholar]
- 62. de Calignon A, Fox LM, Pitstick R, Carlson GA, Bacskai BJ, Spires‐Jones TL, Hyman BT (2010) Caspase activation precedes and leads to tangles. Nature 464: 1201–1204 [DOI] [PMC free article] [PubMed] [Google Scholar]
- 63. LaPointe NE, Morfini G, Pigino G, Gaisina IN, Kozikowski AP, Binder LI, Brady ST (2009) The amino terminus of tau inhibits kinesin‐dependent axonal transport: implications for filament toxicity. J Neurosci Res 87: 440–451 [DOI] [PMC free article] [PubMed] [Google Scholar]
- 64. Quintanilla RA, Matthews‐Roberson TA, Dolan PJ, Johnson GV (2009) Caspase‐cleaved tau expression induces mitochondrial dysfunction in immortalized cortical neurons: implications for the pathogenesis of Alzheimer disease. J Biol Chem 284: 18754–18766 [DOI] [PMC free article] [PubMed] [Google Scholar]
- 65. Lang AE, Riherd Methner DN, Ferreira A (2014) Neuronal degeneration, synaptic defects, and behavioral abnormalities in tau45‐230 transgenic mice. Neuroscience 275: 322–339 [DOI] [PMC free article] [PubMed] [Google Scholar]
- 66. Hochgrafe K, Sydow A, Mandelkow EM (2013) Regulatable transgenic mouse models of Alzheimer disease: onset, reversibility and spreading of Tau pathology. FEBS J 280: 4371–4381 [DOI] [PubMed] [Google Scholar]
- 67. Devos SL, Goncharoff DK, Chen G, Kebodeaux CS, Yamada K, Stewart FR, Schuler DR, Maloney SE, Wozniak DF, Rigo F et al (2013) Antisense reduction of tau in adult mice protects against seizures. J Neurosci 33: 12887–12897 [DOI] [PMC free article] [PubMed] [Google Scholar]
- 68. Spittaels K, Van den Haute C, Van Dorpe J, Bruynseels K, Vandezande K, Laenen I, Geerts H, Mercken M, Sciot R, Van Lommel A et al (1999) Prominent axonopathy in the brain and spinal cord of transgenic mice overexpressing four‐repeat human tau protein. Am J Pathol 155: 2153–2165 [DOI] [PMC free article] [PubMed] [Google Scholar]
- 69. Probst A, Götz J, Wiederhold KH, Tolnay M, Mistl C, Jaton AL, Hong M, Ishihara T, Lee VMY, Trojanowski JQ et al (2000) Axonopathy and amyotrophy in mice transgenic for human four‐repeat tau protein. Acta Neuropathol (Berl) 99: 469–481 [DOI] [PubMed] [Google Scholar]
- 70. Zhang B, Higuchi M, Yoshiyama Y, Ishihara T, Forman MS, Martinez D, Joyce S, Trojanowski JQ, Lee VM (2004) Retarded axonal transport of R406W mutant tau in transgenic mice with a neurodegenerative tauopathy. J Neurosci 24: 4657–4667 [DOI] [PMC free article] [PubMed] [Google Scholar]
- 71. Kimura T, Yamashita S, Fukuda T, Park JM, Murayama M, Mizoroki T, Yoshiike Y, Sahara N, Takashima A (2007) Hyperphosphorylated tau in parahippocampal cortex impairs place learning in aged mice expressing wild‐type human tau. EMBO J 26: 5143–5152 [DOI] [PMC free article] [PubMed] [Google Scholar]
- 72. Götz J, Probst A, Spillantini MG, Schäfer T, Jakes R, Bürki K, Goedert M (1995) Somatodendritic localization and hyperphosphorylation of tau protein in transgenic mice expressing the longest human brain tau isoform. EMBO J 14: 1304–1313 [DOI] [PMC free article] [PubMed] [Google Scholar]
- 73. Duff K, Knight H, Refolo LM, Sanders S, Yu X, Picciano M, Malester B, Hutton M, Adamson J, Goedert M et al (2000) Characterization of pathology in transgenic mice over‐expressing human genomic and cDNA tau transgenes. Neurobiol Dis 7: 87–98 [DOI] [PubMed] [Google Scholar]
- 74. Decker JM, Kruger L, Sydow A, Dennissen F, Siskova Z, Mandelkow E, Mandelkow EM (2016) The Tau/A152T mutation, a risk factor for frontotemporal spectrum disorders, leads to NR2B receptor‐mediated excitotoxicity. EMBO Rep 17: 552–569 [DOI] [PMC free article] [PubMed] [Google Scholar]
- 75. Lee G, Newman ST, Gard DL, Band H, Panchamoorthy G (1998) Tau interacts with src‐family non‐receptor tyrosine kinases. J Cell Sci 111(Pt 21): 3167–3177 [DOI] [PubMed] [Google Scholar]
- 76. Ittner LM, Ke YD, Delerue F, Bi M, Gladbach A, van Eersel J, Wolfing H, Chieng BC, Christie MJ, Napier IA et al (2010) Dendritic function of tau mediates amyloid‐beta toxicity in Alzheimer's disease mouse models. Cell 142: 387–397 [DOI] [PubMed] [Google Scholar]
- 77. Patterson KR, Remmers C, Fu Y, Brooker S, Kanaan NM, Vana L, Ward S, Reyes JF, Philibert K, Glucksman MJ et al (2011) Characterization of prefibrillar Tau oligomers in vitro and in Alzheimer disease. J Biol Chem 286: 23063–23076 [DOI] [PMC free article] [PubMed] [Google Scholar]
- 78. Van der Jeugd A, Hochgrafe K, Ahmed T, Decker JM, Sydow A, Hofmann A, Wu D, Messing L, Balschun D, D'Hooge R et al (2012) Cognitive defects are reversible in inducible mice expressing pro‐aggregant full‐length human Tau. Acta Neuropathol 123: 787–805 [DOI] [PMC free article] [PubMed] [Google Scholar]
- 79. Chong SA, Benilova I, Shaban H, De Strooper B, Devijver H, Moechars D, Eberle W, Bartic C, Van Leuven F, Callewaert G (2011) Synaptic dysfunction in hippocampus of transgenic mouse models of Alzheimer's disease: a multi‐electrode array study. Neurobiol Dis 44: 284–291 [DOI] [PubMed] [Google Scholar]
- 80. Levenga J, Krishnamurthy P, Rajamohamedsait H, Wong H, Franke TF, Cain P, Sigurdsson EM, Hoeffer CA (2013) Tau pathology induces loss of GABAergic interneurons leading to altered synaptic plasticity and behavioral impairments. Acta Neuropathol Commun 1: 34 [DOI] [PMC free article] [PubMed] [Google Scholar]
- 81. Decker JM, Kruger L, Sydow A, Zhao S, Frotscher M, Mandelkow E, Mandelkow EM (2015) Pro‐aggregant Tau impairs mossy fiber plasticity due to structural changes and Ca(++) dysregulation. Acta Neuropathol Commun 3: 23 [DOI] [PMC free article] [PubMed] [Google Scholar]
- 82. Kumar S, Tepper K, Kaniyappan S, Biernat J, Wegmann S, Mandelkow EM, Muller DJ, Mandelkow E (2014) Stages and conformations of the Tau repeat domain during aggregation and its effect on neuronal toxicity. J Biol Chem 289: 20318–20332 [DOI] [PMC free article] [PubMed] [Google Scholar]
- 83. Roberson ED, Scearce‐Levie K, Palop JJ, Yan F, Cheng IH, Wu T, Gerstein H, Yu G‐Q, Mucke L (2007) Reducing endogenous tau ameliorates amyloid β‐induced deficits in an Alzheimer's disease mouse model. Science 316: 750–754 [DOI] [PubMed] [Google Scholar]
- 84. Holth JK, Bomben VC, Reed JG, Inoue T, Younkin L, Younkin SG, Pautler RG, Botas J, Noebels JL (2013) Tau loss attenuates neuronal network hyperexcitability in mouse and Drosophila genetic models of epilepsy. J Neurosci 33: 1651–1659 [DOI] [PMC free article] [PubMed] [Google Scholar]
- 85. Gheyara AL, Ponnusamy R, Djukic B, Craft RJ, Ho K, Guo W, Finucane MM, Sanchez PE, Mucke L (2014) Tau reduction prevents disease in a mouse model of Dravet syndrome. Ann Neurol 76: 443–456 [DOI] [PMC free article] [PubMed] [Google Scholar]
- 86. Garcia‐Cabrero AM, Guerrero‐Lopez R, Giraldez BG, Llorens‐Martin M, Avila J, Serratosa JM, Sanchez MP (2013) Hyperexcitability and epileptic seizures in a model of frontotemporal dementia. Neurobiol Dis 58: 200–208 [DOI] [PubMed] [Google Scholar]
- 87. Qizilbash N, Gregson J, Johnson ME, Pearce N, Douglas I, Wing K, Evans SJ, Pocock SJ (2015) BMI and risk of dementia in two million people over two decades: a retrospective cohort study. Lancet Diabetes Endocrinol 3: 431–436 [DOI] [PubMed] [Google Scholar]
- 88. Morris M, Hamto P, Adame A, Devidze N, Masliah E, Mucke L (2013) Age‐appropriate cognition and subtle dopamine‐independent motor deficits in aged tau knockout mice. Neurobiol Aging 34: 1523–1529 [DOI] [PMC free article] [PubMed] [Google Scholar]
- 89. Lewis J, Dickson DW, Lin WL, Chisholm L, Corral A, Jones G, Yen SH, Sahara N, Skipper L, Yager D et al (2001) Enhanced neurofibrillary degeneration in transgenic mice expressing mutant tau and APP. Science 293: 1487–1491 [DOI] [PubMed] [Google Scholar]
- 90. Oddo S, Caccamo A, Shepherd JD, Murphy MP, Golde TE, Kayed R, Metherate R, Mattson MP, Akbari Y, LaFerla FM (2003) Triple‐transgenic model of Alzheimer's disease with plaques and tangles: intracellular Ab and synaptic dysfunction. Neuron 39: 409–421 [DOI] [PubMed] [Google Scholar]
- 91. Grueninger F, Bohrmann B, Czech C, Ballard TM, Frey JR, Weidensteiner C, von Kienlin M, Ozmen L (2010) Phosphorylation of Tau at S422 is enhanced by Abeta in TauPS2APP triple transgenic mice. Neurobiol Dis 37: 294–306 [DOI] [PubMed] [Google Scholar]
- 92. Platt B, Drever B, Koss D, Stoppelkamp S, Jyoti A, Plano A, Utan A, Merrick G, Ryan D, Melis V et al (2011) Abnormal cognition, sleep, EEG and brain metabolism in a novel knock‐in Alzheimer mouse, PLB1. PLoS One 6: e27068 [DOI] [PMC free article] [PubMed] [Google Scholar]
- 93. Seino Y, Kawarabayashi T, Wakasaya Y, Watanabe M, Takamura A, Yamamoto‐Watanabe Y, Kurata T, Abe K, Ikeda M, Westaway D et al (2010) Amyloid beta accelerates phosphorylation of tau and neurofibrillary tangle formation in an amyloid precursor protein and tau double‐transgenic mouse model. J Neurosci Res 88: 3547–3554 [DOI] [PubMed] [Google Scholar]
- 94. Yoshiyama Y, Higuchi M, Zhang B, Huang SM, Iwata N, Saido TC, Maeda J, Suhara T, Trojanowski JQ, Lee VM (2007) Synapse loss and microglial activation precede tangles in a P301S tauopathy mouse model. Neuron 53: 337–351 [DOI] [PubMed] [Google Scholar]
- 95. Overk CR, Cartier A, Shaked G, Rockenstein E, Ubhi K, Spencer B, Price DL, Patrick C, Desplats P, Masliah E (2014) Hippocampal neuronal cells that accumulate alpha‐synuclein fragments are more vulnerable to Abeta oligomer toxicity via mGluR5–implications for dementia with Lewy bodies. Mol Neurodegener 9: 18 [DOI] [PMC free article] [PubMed] [Google Scholar] [Retracted]
- 96. Gallyas F (1971) Silver staining of Alzheimer's neurofibrillary changes by means of physical development. Acta Morphol Acad Sci Hung 19: 1–8 [PubMed] [Google Scholar]
- 97. Ting JT, Daigle TL, Chen Q, Feng G (2014) Acute brain slice methods for adult and aging animals: application of targeted patch clamp analysis and optogenetics. Methods Mol Biol 1183: 221–242 [DOI] [PMC free article] [PubMed] [Google Scholar]
- 98. Castillo PE, Weisskopf MG, Nicoll RA (1994) The role of Ca2 + channels in hippocampal mossy fiber synaptic transmission and long‐term potentiation. Neuron 12: 261–269 [DOI] [PubMed] [Google Scholar]
- 99. Calixto E, Thiels E, Klann E, Barrionuevo G (2003) Early maintenance of hippocampal mossy fiber–long‐term potentiation depends on protein and RNA synthesis and presynaptic granule cell integrity. J Neurosci 23: 4842–4849 [DOI] [PMC free article] [PubMed] [Google Scholar]
Associated Data
This section collects any data citations, data availability statements, or supplementary materials included in this article.
Supplementary Materials
Appendix
Expanded View Figures PDF
Review Process File