

Abstract
We report on a novel transgenic mouse model expressing human full‐length Tau with the Tau mutation A152T (hTauAT), a risk factor for FTD‐spectrum disorders including PSP and CBD. Brain neurons reveal pathological Tau conformation, hyperphosphorylation, mis‐sorting, aggregation, neuronal degeneration, and progressive loss, most prominently in area CA3 of the hippocampus. The mossy fiber pathway shows enhanced basal synaptic transmission without changes in short‐ or long‐term plasticity. In organotypic hippocampal slices, extracellular glutamate increases early above control levels, followed by a rise in neurotoxicity. These changes are normalized by inhibiting neurotransmitter release or by blocking voltage‐gated sodium channels. CA3 neurons show elevated intracellular calcium during rest and after activity induction which is sensitive to NR2B antagonizing drugs, demonstrating a pivotal role of extrasynaptic NMDA receptors. Slices show pronounced epileptiform activity and axonal sprouting of mossy fibers. Excitotoxic neuronal death is ameliorated by ceftriaxone, which stimulates astrocytic glutamate uptake via the transporter EAAT2/GLT1. In summary, hTauAT causes excitotoxicity mediated by NR2B‐containing NMDA receptors due to enhanced extracellular glutamate.
Keywords: CA3, excitotoxicity, frontotemporal‐spectrum disorders, NR2B, Tau
Subject Categories: Molecular Biology of Disease, Neuroscience
Introduction
Familial tauopathies including FTDP‐17 are often caused by mutations in the Tau gene (MAPT), which particularly occur in Tau's microtubule‐binding repeat region 1. MAPT mutations can lead to a partial loss of function due to a reduction in Tau's microtubule‐binding capability or to a gain of toxic function by increasing the tendency of Tau to aggregate into filaments 2, 3. By contrast, the rare Tau p.A152T substitution is located outside the microtubule‐binding domain in the N‐terminal half of Tau. It has emerged as a risk factor for both frontotemporal dementias (FTDs) and Alzheimer's disease (AD), including progressive supranuclear palsy (PSP) and corticobasal degeneration (CBD) 4, 5, 6, 7. The mutation decreases Tau's binding to microtubules and increases the formation of Tau oligomers in vitro 7. However, the consequences for neuronal function and the exact course of pathogenesis still remain elusive. We therefore generated a transgenic mouse line expressing the Tau‐A152T mutation and characterized its pathology.
In healthy conditions, Tau is localized mainly in axons, stabilizes microtubules, and supports axonal transport processes 8, 9. Phosphorylation and detachment of Tau from microtubules following subsequent mis‐sorting into cell bodies and dendrites may provoke axonal transport alterations 10, 11, which in turn may disturb physiological conditions at postsynapses 12, 13. Presynaptic physiological disturbances in Tau models have been reported as well 14, 15. Phosphorylated Tau within dendritic spines has been proposed to impair synaptic transmission by decreasing the densities of postsynaptic α‐amino‐3‐hydroxy‐5‐methyl‐4‐isoxazolepropionic acid (AMPA) and N‐methyl‐D‐aspartate (NMDA) receptors 12 and causes calcium dysregulation 16. Furthermore, dendritic Tau is thought to mediate Aβ‐induced excitotoxicity and memory deficits in APP transgenic mice 13, 17. Tau plays a role in neuronal excitability and is required for Aβ and other excitotoxins to execute their degenerative effect, such as aberrant network activity and cognitive decline 13, 18. In primary neurons prepared from mice expressing mutant human APP tau allows Aβ oligomers to inhibit axonal transport through activation of GSK3β 19. Genetic ablation of Tau decreases spontaneous seizures in APP transgenic mice and even in a non‐AD epilepsy model 20, 21.
Tauopathies are characterized by pathological aggregation of Tau and massive cell loss in particular brain regions. In the case of PSP, this occurs in the basal ganglia and brain stem 22 but also in the hippocampus, which may be one factor contributing to cognitive decline. The molecular mechanisms of Tau‐mediated neurotoxicity are not well understood and may be diverse. One suggested mechanism in AD is glutamate‐mediated excitotoxicity which may lead to the stimulation of extrasynaptic NMDARs (containing NR2B‐subunits) and promote Tau‐dependent cell death 23. Recently, impairments in glutamate metabolism were also reported in the hippocampus of transgenic mice overexpressing Tau‐P301L 24, 25.
When characterizing the new Tau A152T substitution (hTauAT) mouse model by biochemistry and immunohistochemistry, we noticed that the most prominent Tau pathology occurred in the mossy fiber pathway of the CA3 region. We therefore analyzed this region in acute and organotypic slices for structural and functional abnormalities. This revealed a distinct, excitotoxic phenotype which caused an increase in extracellular glutamate, a rise in intracellular calcium, combined with epileptiform activity and mossy fiber sprouting in the hippocampus. This was reminiscent of the situation in PSP patients, where increased seizure susceptibility was reported 26. The effects were consistent with an overactivation of extrasynaptic NMDA receptors and could be prevented by pharmacological treatments stimulating the uptake of glutamate by astrocytic glutamate transporters (EAAT2/GLT1). These results agree well with observations from another mouse model based on the same mutation 27, which shows age‐dependent neuronal loss, cognitive impairments, and spontaneous nonconvulsive epileptiform activity.
Results
Generation and phenotypic characterization of hTauAT mice
We generated a novel transgenic mouse model (hTauAT) expressing human full‐length Tau (hTau40, 2N4R) with the PSP‐related point mutation p.A152T (Fig 1A). The transgene is located in the ROSA26 locus 28 and its expression is controlled by the neuron‐specific Thy1.2 promoter. This results in moderate overexpression levels in the hippocampus of heterozygous (+/−) and homozygous (+/+) hTauAT mice at an age of 14 months (Fig 1B). The molecular ratios of mutant hTauAT to endogenous mouse Tau protein in the hippocampus are ~1:1 (heterozygous) and 1.8:1 (homozygous mice) (Fig 1C). The hTauAT mRNA levels in transgenic heterozygous (1.00 ± 0.35 A.U.) and homozygous (2.19 ± 0.27 A.U.) mice (16 month) were in good agreement with the hTau/mTau protein expression ratios in hippocampi from transgenic animals (compare Fig 1C to D). Immunohistological analysis with the human Tau‐specific antibody HT7 confirmed the higher hTauAT expression in the homozygous hTauAT mice (Fig 1E). Both types of mice show intense staining of the CA3‐mossy fibers (Fig 1E, asterisks) and mis‐sorting of the human TauAT into the somato‐dendritic compartment, a typical early feature of AD (Fig 1E, arrowheads). The hTauAT‐expressing mice show hyperphosphorylated Tau (by antibodies pT217, AT180 (pSer235, pSer202), PHF1 (pSer396/pSer404), and AT8 (pSer202/pThr205); Fig 1F–I, respectively) and a pathological Tau conformation (antibody Alz‐50, Fig 2A). Transgenic Tau is prominent in the axonal mossy fibers of the CA3 region (Fig 1E and H, asterisks) and is mis‐sorted into the cell bodies of hippocampal pyramidal neurons (Fig 1E–I, arrowheads). Using two complementary techniques, Gallyas silver staining (Fig 2B) and sarcosyl extraction (Fig 2C). we could identify aggregated Tau species in 14‐month‐old mice. Interestingly, both hTauAT and mouse Tau was found in the sarcosyl‐insoluble fraction indicating strong co‐aggregation (Fig 2C). The ratio of mutant hTauAT to endogenous Tau within the sarcosyl‐insoluble fraction is 0.7:1 (+/−) and 1.4:1 (+/+), demonstrating that endogenous mouse Tau is incorporated into Tau aggregates (Fig 2D).
Figure 1. Expression of hTauAT causes Tau phosphorylation and mis‐sorting in aged mouse hippocampi.
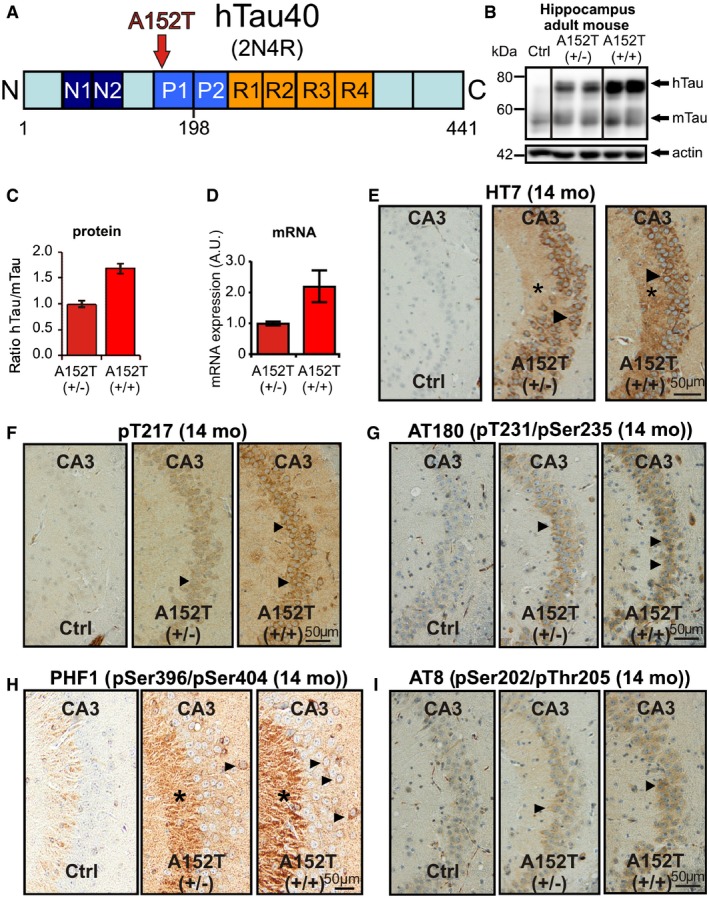
- The diagram shows the domain structure of wild‐type human Tau and the location of the substitution A152T (hTauAT). Tau domains are broadly divided into the N‐terminal “projection domain” (amino acids M1‐Y197) and the C‐terminal “assembly domain” (amino acids S198‐L441). The C‐terminal assembly domain includes three or four pseudo‐repeats (˜31 residues each, R1–R4), which together with their proline‐rich flanking regions (P1 and P2) constitute the microtubule‐binding region. Repeat R2 (exon10) and the two near‐N‐terminal inserts (N1 and N2, exons 2 and 3) may be absent due to alternative splicing.
- Blots showing expression of hTauAT (hTau, Mr ˜67 kDa) and/or endogenous mouse Tau (mTau, Mr ˜45–55 kDa) in the hippocampus of 10‐month‐old heterozygous (+/−) and homozygous (+/+) hTauAT mice in comparison to age‐matched control (Ctrl) detected by pan‐Tau antibody K9JA. Actin at 42 kDa serves as a loading control.
- Quantification of (B). Ratio of hTau/mTau indicating a higher hTauAT expression in homozygous mice (˜1.8) compared to heterozygous mice (˜1.0). Each bar represents an average of n = 4 animals, error bars represent SEM.
- Quantification of mRNA levels in hippocampi of heterozygous and homozygous hTauAT 16‐month‐old mice (n = 4 animals per group). Error bars indicate mean ± SEM.
- Distribution of hTauAT visualized by the human Tau‐specific antibody HT7 in the hippocampal CA3‐region of hetero‐ and homozygous hTauAT mice at the age of 14 months. Notice the mis‐sorted hTauAT in cell bodies and dendrites (arrowheads) of pyramidal neurons of the CA3 region and immunreactivity of the axons (mossy fibers, asterisks). By contrast, the control shows no immunoreactivity.
- Elevated hTauAT expression causes Tau pathology inside area CA3 of the hippocampus. Note the increase in Tau phosphorylation probed with the antibody against pT217, a site upstream of the repeat domain. Arrowheads point to areas with phosphorylated and mislocalized Tau in cell somata of pyramidal neurons in area CA3.
- Tauopathy detected by antibody AT180 specific for phosphorylation sites pT231 + pSer235 (arrowheads denote somato‐dendritic mislocalized tau).
- Antibody PHF‐1 (phosphorylation sites pSer396 + pSer404) illustrates pathological phosphorylation of Tau due to hTauAT expression especially in stratum lucidum (asterisks) of area CA3 and pyramidal cell bodies (arrows).
- Tau phosphorylation detected by antibody AT8 (pS202 + pT205) in stratum pyramidale of area CA3 (arrowhead). Note that immunoreactivity increases with expression level.
Figure 2. Expression of hTauAT leads to pathological conformation and aggregation of Tau in the hippocampus of aged mice.
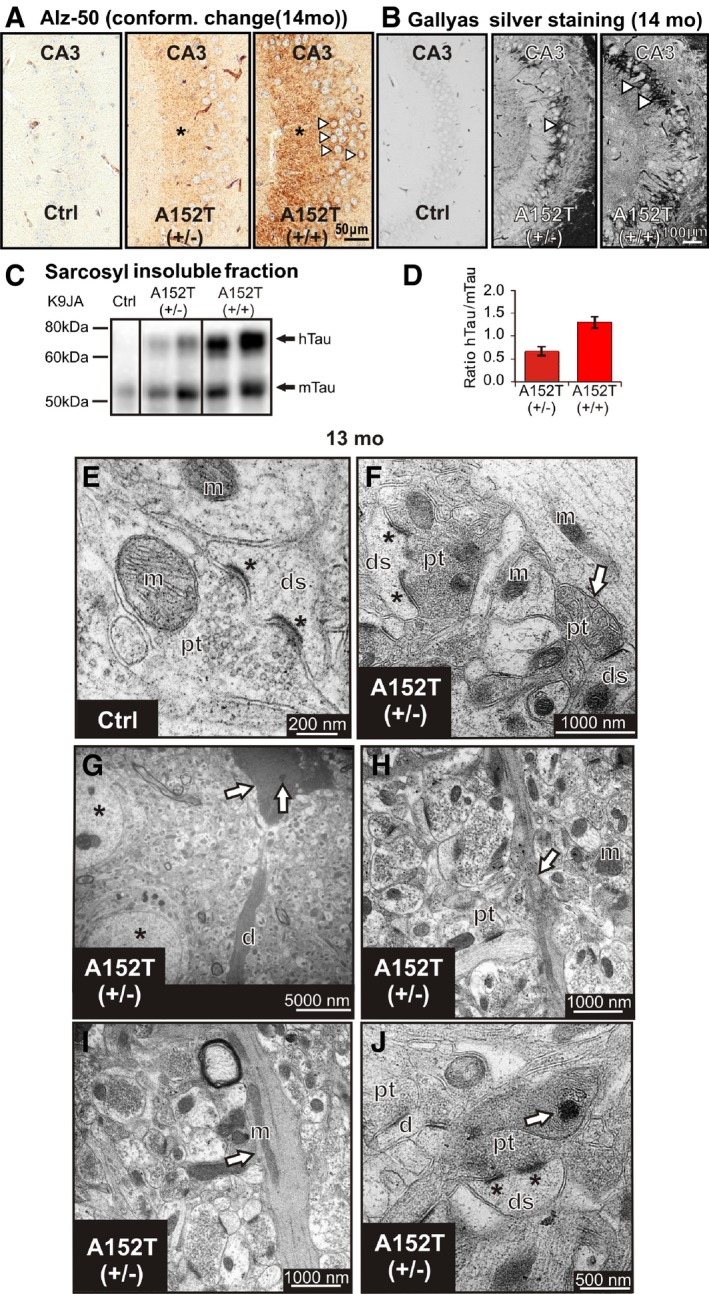
- Conformational change of Tau detected by ALZ‐50 antibody immunoreactivity in stratum lucidum (asterisks) of area CA3 and somata in stratum pyramidale (arrowheads).
- Tau aggregation confirmed by Gallyas silver staining of NFTs bearing neurons in hetero‐ and homozygous hTauAT mice at 14 months of age compared to non‐reactive control littermate mice. In homozygous hTauAT mice, the extent of neurofibrillary tangles (NFTs) visualized by Gallyas silver staining is enhanced compared to heterozygous hTauAT mice (white arrowheads). The control shows no silver‐reactive Tau aggregates.
- Western blot analysis using the pan‐Tau antibody K9JA indicates sarcosyl‐insoluble Tau species of human hTauAT (upper band) and mouse Tau (mTau, lower band). Note the enhanced Tau aggregation in homozygous hTauAT mice compared to heterozygous hTauAT mice and control mice.
- Quantification of (C). The ratio of hTauAT/mTau indicates a stronger aggregation in the homozygous hTauAT mice (˜1.4) compared to heterozygous hTauAT mice (˜0.7) (n = 4 animals, error bars represent SEM).
- Electron micrograph of CA3 region of the hippocampus illustrating typical synapse with a perforated postsynaptic density (asterisks) in a control animal at 12 months. ds, dendritic spine; pt, presynaptic terminal; m, mitochondrium.
- Example of a degenerating synaptic bouton (arrow) containing swollen synaptic vesicles in proximity to a large terminal with a perforated postsynaptic density (asterisks) in a transgenic animal at 13 months.
- Electron‐dense neuronal cytoplasm with dark nucleoplasm and various vacuoles (arrow) detected in CA3 pyramidal neurons (arrow) at 13 months in transgenic animals in proximity to normally appearing neurons (asterisks), degenerating apical dendrite (d).
- Neuropil of a transgenic animal (13 months) with a degenerating neuritic profile (arrow).
- Degenerating dendrite (arrow) in a transgenic animal with darkened cytoplasm and abnormally distributed mitochondria (arrow).
- Degenerating dendrite containing electron‐dense whorling membrane fragments (arrow) in proximity to normally appearing synapses (synapse with a perforated postsynaptic density, asterisks).
Electron microscopy revealed typical ultrastructural hallmarks of hippocampal CA3 neuropil, including distinct mossy fiber boutons in the stratum lucidum that appeared intact, densely packed with clear synaptic vesicles in control animals (Fig 2E). By contrast, in transgenic age‐matched animals, some presynaptic terminals were electron dense and filled with swollen synaptic vesicles (Fig 2F, arrow). Interestingly, relatively high numbers of synapses, specifically with perforated postsynaptic densities, appeared intact in the stratum lucidum of transgenic animals with no obvious signs of degeneration (Fig 2F and J, asterisks). This finding is in apparent contrast to other animal models including a tau‐aggregation model associated with the ΔK280 mutation and the classical murine models overexpressing APP/PS1 mutations 29, 30. Neuropathology in these models was generally associated with a profound and early reduction in the numbers of excitatory hippocampal synapses that was not apparent in our study even at late disease stage (12–13 months). Signs of neuronal degeneration were obvious in pyramidal neurons; degenerating profiles were identified by a shrunken cell membrane plus a darkened cytoplasm, as well as darkened nucleoplasm and crenated nucleolemma within cell soma (Fig 2G, arrow). Furthermore, various degrees of structural abnormalities were detected in dendrites and axons (Fig 2G–J). Electron opaque, degenerating neuritic profiles were identified by an increase in mitochondrial density, presence of whorling membrane fragments, and numerous lysosome‐like vacuoles (Fig 2J, arrow).
Tau is hyperphosphorylated and mis‐sorted due to hTauAT expression in hippocampal slice cultures
To further clarify whether hTauAT is mis‐sorted into dendrites and dendritic spines, we used immunofluorescence in organotypic hippocampal slices. Organotypic hippocampal slices were derived from young heterozygous transgenic hTauAT mice and maintained in culture for several weeks. Western blotting with pan‐Tau antibody K9JA revealed a ~onefold overexpression in heterozygous slice cultures when compared to endogenous Tau levels (Fig 3A and B), well comparable with hippocampal extracts from adult hTauAT mice (Fig 1C). To detect the subcellular location of hTauAT, we used immunohistochemistry with human Tau‐specific antibody TauY9 or pan‐Tau antibody K9JA. In slices from non‐transgenic littermates, we could not detect any signal with antibody TauY9 (Fig 3C) but found an axonal distribution of Tau with the pan‐Tau antibody (Fig EV1A). In contrast, in hTauAT slices the human Tau appeared both in axons (Fig 3C asterisk) and dendrites (Fig 3C, right panel). Whereas the dendritic marker MAP2 was restricted to the dendritic shaft, Tau was also apparent in dendritic spines when hTauAT was expressed (Fig 3E, see also Fig EV1B, inset). The somato‐dendritically mis‐sorted Tau showed enhanced phosphorylation at the PHF1 epitope (pSer394/pSer404) already at DIV 10, but not in control littermate slices (Fig 3D).
Figure 3. hTauAT expression causes Tau phosphorylation and mis‐sorting in organotypic hippocampal slice cultures.
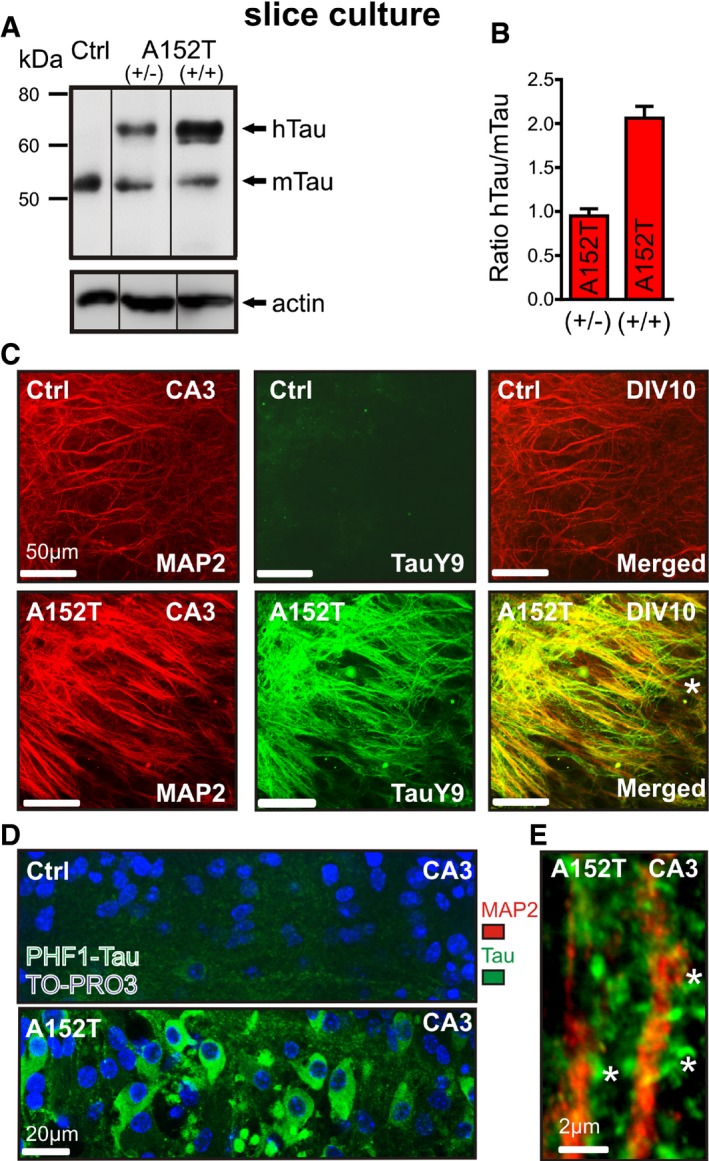
- Western blot analysis with pan‐Tau K9JA antibody to estimate expression levels of hTauAT and endogenous Tau (mTau). Slice homogenates from non‐transgenic littermate (lane 1, Ctrl), heterozygous hTauAT (lane 2 (+/−)), or homozygous hTauAT slices (lane 3 (+/+)) were analyzed after three weeks in culture. Actin served as a loading control.
- Quantification of hTauAT expression levels (n = average of 3–6 slice homogenates per group, error bars indicate mean ± SEM). The ratio between hTauAT and endogenous mouse Tau is shown.
- Immunohistochemistry with antibodies against human Tau (TauY9 antibodies; middle panel) and dendritic marker MAP2 (left panel) in slice cultures at DIV 10. Stratum radiatum of area CA3 is shown. Although MAP2 staining is apparent, no signal is detected by the TauY9 antibody in control slices. In contrast, in hTauAT slices human Tau is detected in both dendrites and axons (see asterisk in merged image).
- Immunohistochemistry against phosphorylated Tau at the PHF1 epitope in area CA3 of a control (upper lane) or hTauAT slice (bottom lane). PHF1 staining is slightly visible in some axons in control slices. In contrast, PHF1‐phosphorylated Tau is apparent in somata, dendrites and axons of neurons in hTauAT slice cultures.
- Higher magnification image of apical dendrites in area CA3 in a hTauAT slice after immunohistochemistry against MAP2 (red) and Tau (K9JA antibody, green). Tau staining is seen in dendritic spines (asterisks) in contrast to MAP2, which is restricted to the dendritic shaft.
Figure EV1. Expression of hTauAT causes missorting in organotypic hippocampal slice cultures.
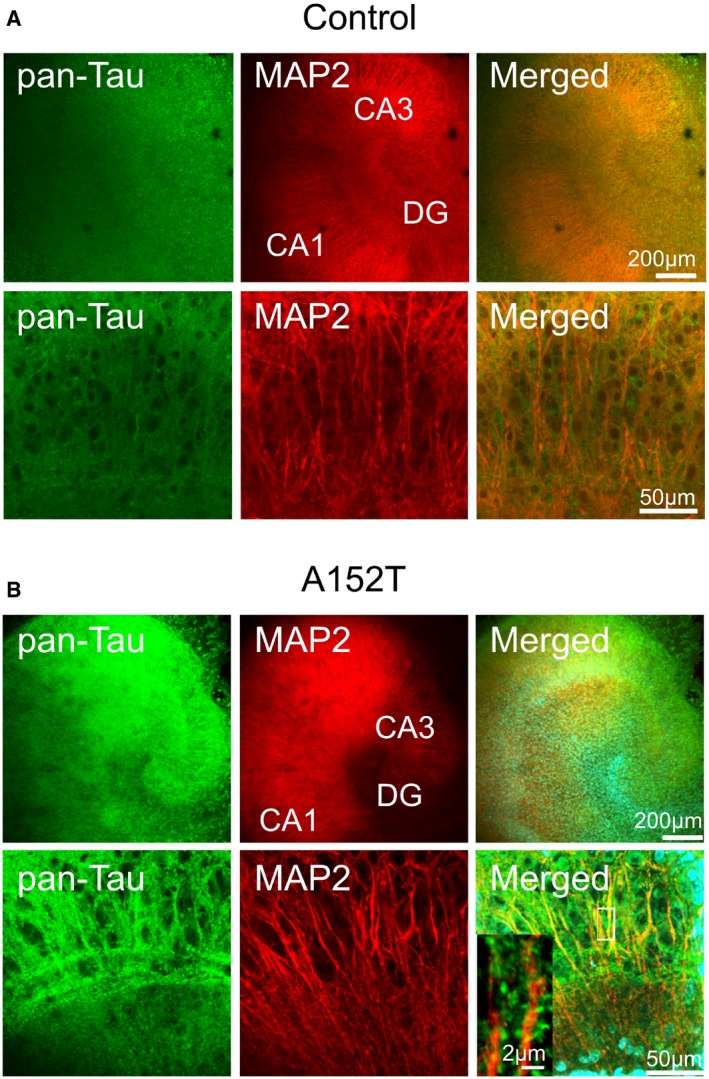
- Immunohistochemistry highlighting the dendritic marker MAP2 and the axonal marker Tau protein (by pan‐Tau antibody K9JA recognizing both human and mouse Tau) in slice cultures from non‐transgenic littermate at DIV 10. Overview images (upper panel) and higher magnification of area CA3 (lower panel). Tau is restricted to axons and not seen in dendrites.
- Immunohistochemistry highlighting the dendritic marker MAP2 and axonal Tau protein (by pan‐Tau antibody K9JA recognizing both human and mouse Tau) in slice cultures from hTauAT at DIV 10. Overview images (upper panel) and higher magnification of area CA3 (lower panel). In hTauAT slices, Tau is seen both in axons and dendrites. Higher magnification of apical dendrite (inset) displays Tau in dendritic spines in contrast to MAP2, which is restricted to the dendritic shaft.
Expression of hTauAT elevates intracellular Ca2+ concentrations in CA3 neurons at resting state and after membrane depolarization through NR2B‐containing NMDA receptors
It was reported earlier that mis‐sorted, phosphorylated Tau within dendritic spines of primary neurons impairs synaptic transmission by altering the densities of postsynaptic receptors such as AMPARs and NMDARs 12 and causes abnormal changes in intracellular Ca2+ ([Ca2+]i) 17. We therefore investigated [Ca2+]i by Fura‐2AM imaging in organotypic hippocampal slices. Experiments were performed in area CA3 of slice cultures at DIV 15 (Fig 4A and B), when the NR2B to NR2A ratio in synapses is comparable to acute slices 31, 32, 33. We observed a pronounced increase in resting [Ca2+]i in hTauAT slices (~129 nM) compared to control littermate slices (~82 nM, Fig 4A–D). Next, slices were incubated and imaged for [Ca2+]i in the presence of drugs to identify the source of the [Ca2+]i increase. We applied the L‐type voltage‐gated calcium channel (L‐VGCC) blocker nifedipine (NIF), the AMPAR antagonist CNQX, the NMDAR antagonists APV and ifenprodil (IFEN, inhibitor of NMDARs composed of NR1 and NR2B subunits 34), memantine (MEM: preferentially blocking extrasynaptic NMDA receptor currents; 35), the sodium channel blocker tetrodotoxin (TTX), and the presynaptic vesicle release inhibitor tetanus neurotoxin (TeNT), or imaged in the absence of extracellular Ca2+ (see Table EV1 for a summary of all drugs and concentrations used). In control littermate slices, the resting [Ca2+]i was not significantly affected by these drugs (Fig 4D). However, as expected, the removal of extracellular Ca2+ leads to a pronounced decrease in [Ca2+]i (−50%, ~40 nM, P < 0.05, Fig 4D). In agreement, Ca2+‐free saline caused the strongest [Ca2+]i reduction in hTauAT slices (−55%, ~55 nM, P < 0.0001, Fig 4D) but additionally the blockade of NMDAR with APV leads to a reduction in resting [Ca2+]i (~83.5 nM, P < 0.05, Fig 4D).
Figure 4. hTauAT causes elevation of Ca2+ levels in CA3 hippocampal neurons at resting state and after membrane depolarization through extrasynaptic NMDA receptors.
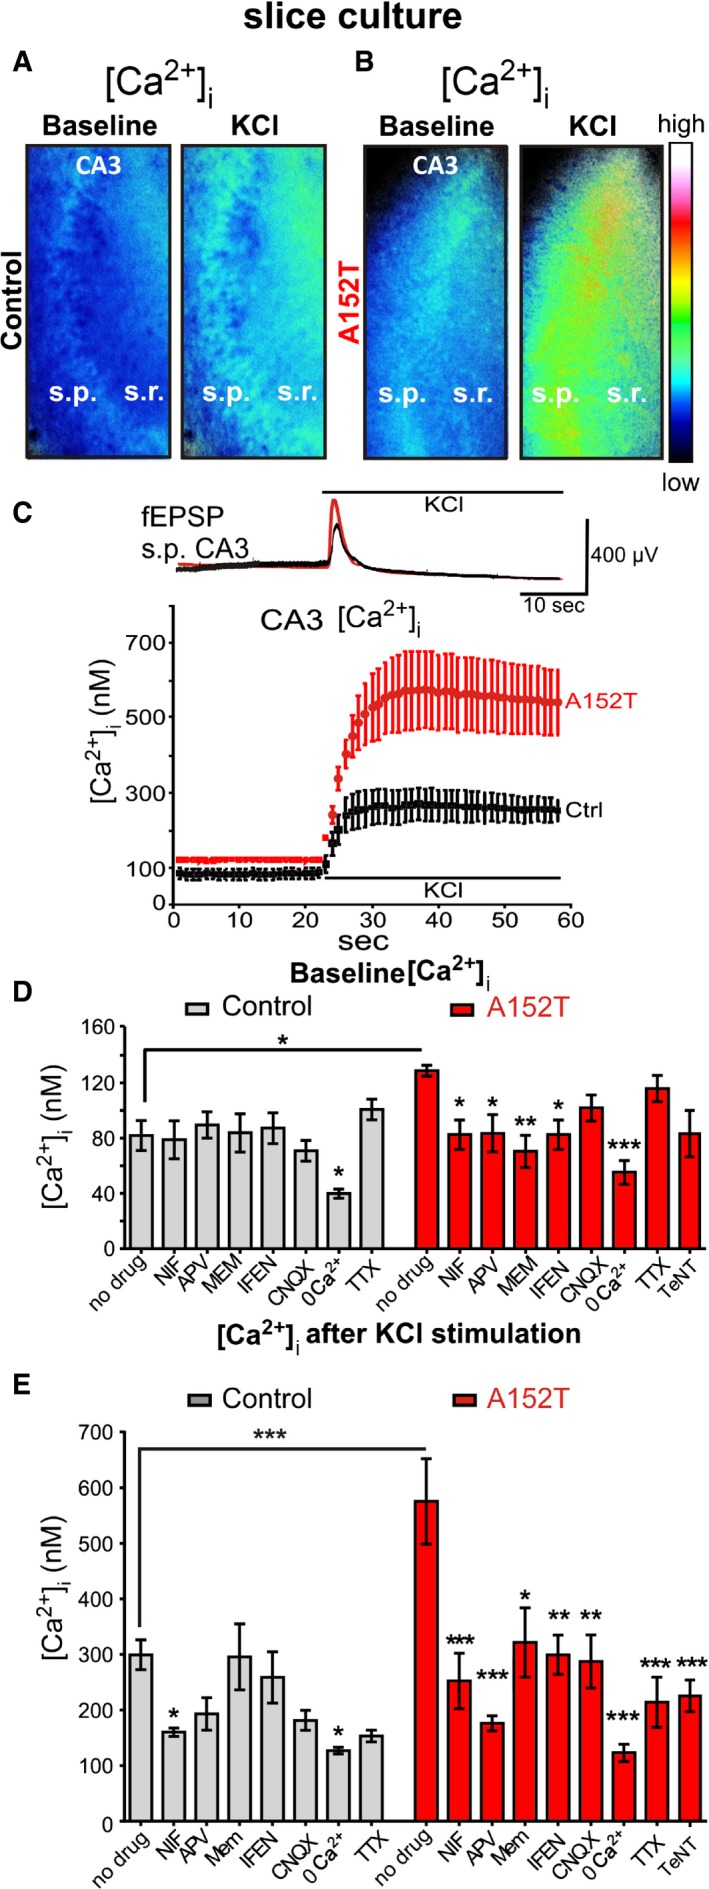
- Slices (DIV 15) from control mice were loaded with the Ca2+‐sensitive dye Fura‐2AM. Ratiometric images are presented at baseline and after application of high potassium. Note the increase in intracellular Ca2+ ([Ca2+]i) after KCl application.
- Slices (DIV 15) from hTauAT mice were loaded with the Ca2+‐sensitive dye Fura‐2AM. Ratiometric images at baseline and after application of high potassium chloride in area CA3 are depicted. Note the increase in [Ca2+]i (false color legend) under both conditions in hTauAT slices compared to controls.
- Electrophysiological example traces (control, black; hTauAT, red) of excitatory postsynaptic field potentials (fEPSP) depict examples of depolarizations that are induced by a single high potassium chloride application in stratum pyramidale (s.p.) of area CA3 in slices in which calcium imaging experiments were conducted. The example depolarization evokes averaged calcium influxes into neurons depicted in the calcium imaging graph. The graph shows the mean of [Ca2+]i changes in response to high KCl in stratum radiatum and stratum pyramidale of area CA3 in Fura‐2AM‐loaded hippocampal slices. After depolarization, [Ca2+]i rises up to ˜600 nM in hTauAT slices (red trace, n = 6 slices, prepared from at least three animals), compared to ˜300 nM in control slices (black trace, n = 6 slices; prepared from at least three animals). Note that even under resting conditions, [Ca2+]i is elevated to ˜120 nM due to hTauAT expression.
- Quantification of the [Ca2+]i from ratiometric images as depicted in (A) and (B) after background subtraction and selection of regions of interest (10 circles of fixed diameter) in stratum radiatum border to stratum pyramidale of area CA3. Under resting conditions, [Ca2+]i was elevated in transgenic slice cultures (˜120 nM, n = 11) compared to controls (˜80 nM, n = 8). Slices were incubated with one of the following channel blockers: nifedipine (NIF, VGCC; Ctrl n = 8; A152T: n = 7), APV (NMDAR; Ctrl n = 7; A152T n = 8), ifenprodil (IFEN, NMDAR; Ctrl n = 8; A152T n = 7), memantine (MEM, NMDAR; Ctrl/A152T n = 6), 6‐cyano‐7‐nitroquinoxaline‐2,3‐dione (CNQX; AMPAR; Ctrl n = 8; A152T n = 7)), tetrodotoxin (TTX, VGNaC; Ctrl n = 4; A152T n = 5), tetanus neurotoxin (TeNT, neurotransmitter release; A152T n = 6) or in Ca2+‐free buffer (Ctrl n = 10; A152T n = 7). For each experiment, slice preparations from at least three different mice were used. One‐way ANOVA followed by Tukey's post hoc test; Ctrl: F(7/51) = 3,533; P = 0.0036; A152T: F(8/55) = 5,230; P < 0.0001. For an overview of drug concentrations see Table EV1.
- Quantification of the maximum peak increase in intracellular calcium after high KCl stimulation. One‐way ANOVA followed by Tukey's post hoc test Ctrl: F(7/45) = 4,080; P = 0.0015; A152T: F(8/53) = 7,580; P < 0.0001).
The inhibition of extrasynaptic NMDARs (either by IFEN or by low‐dose MEM) or the blockage of L‐VGCC (by NIF) was sufficient to reduce resting [Ca2+]i in hTauAT‐expressing slices to control levels (IFEN: ~70 nM, P < 0.05; MEM: ~83 nM, P < 0.01; NIF: ~83 nM, P < 0.05, Fig 4D). [Ca2+]i levels were not significantly altered in presence of either TTX, TeNT, or CNQX in both control and hTauAT slices under resting conditions (Fig 4D).
Next, changes in calcium influx after membrane depolarization were monitored by applying high potassium chloride (KCl). After activity induction, we observed a steep rise in [Ca2+]i levels in hTauAT slices (~575 nM, Fig 4E), whereas control slices achieved only maximum values of ~300 nM (Fig 4E). KCl‐evoked Ca2+ influx was blocked by nifedipine (NIF: −47%, P < 0.05, Fig 4E) and less prominently by APV (−36%, Fig 4E) in control littermate slices.
In contrast, treatment of hTauAT slices with APV caused a stronger inhibition of Ca2+ influx than application of NIF (−56%, P < 0.001; APV: −69%, P < 0.001, Fig 4E).
Comparison of the effects of MEM and IFEN on KCl‐evoked Ca2+ influx in control (MEM: −1%; IFEN: −13%, Fig 4E) and in hTauAT slices (MEM: −44%, P < 0.05; IFEN: −48%, P < 0.01, Fig 4E) demonstrated a prominent contribution of NR2B‐mediated Ca2+ influx to the overall [Ca2+]i increase in hTauAT slices.
hTauAT expression is neurotoxic by increasing extracellular glutamate, thereby activating the CREB shutoff pathway
Adult excitatory neurons of the hippocampus express NMDARs with mainly two subunit compositions, NR1/NR2A and NR1/NR2B 36, 37. Synaptic NMDARs are predominantly of the types NR1/NR2A or NR1/NR2A/NR2B (ifenprodil insensitive), whereas somatic or extrasynaptic NMDARs are predominantly of the type NR1/NR2B (ifenprodil sensitive) 36. The pathway downstream of NMDAR activation is dependent both on the subunit composition and on the location of the receptors 38, 39. For example, Ca2+ flux through synaptic NMDARs initiates changes in synaptic efficacy and promotes pro‐survival events, whereas Ca2+ flux through extrasynaptic NMDARs is coupled to cell‐death pathways 38, 40, 41. The pharmacology of calcium imaging experiments (IFEN, MEM) pointed to a strong contribution of NR2B‐containing extrasynaptic NMDARs under both conditions, resting and activity‐induced Ca2+ influx in hTauAT slices, not seen in control littermate slices.
Since NR2B‐containing NMDARs get activated by excessive glutamate 42, we hypothesized the possibility of high levels of extracellular glutamate in hTauAT slices. To test this, culture medium from hTauAT‐expressing (or control littermate) slices was collected at different time points and glutamate concentrations were measured. The extracellular glutamate levels from hTauAT slices were increased by ~45% at DIV 5 and DIV 10 and declined at DIV 20–25 almost to control levels (+28% (DIV 20) and −4% (DIV 25); Fig 5A). The maximum glutamate concentrations were already observed at early time points (DIV 5 and 10; Fig 5A). Remarkably, the increase in glutamate was already maximal several days before the increase in cytotoxicity as seen by LDH (Fig 5B), which argues in favor of a rise in extracellular glutamate as a trigger for toxicity.
Figure 5. hTauAT expression enhances extracellular glutamate, cytotoxicity and progressive neuronal loss in the hippocampus.
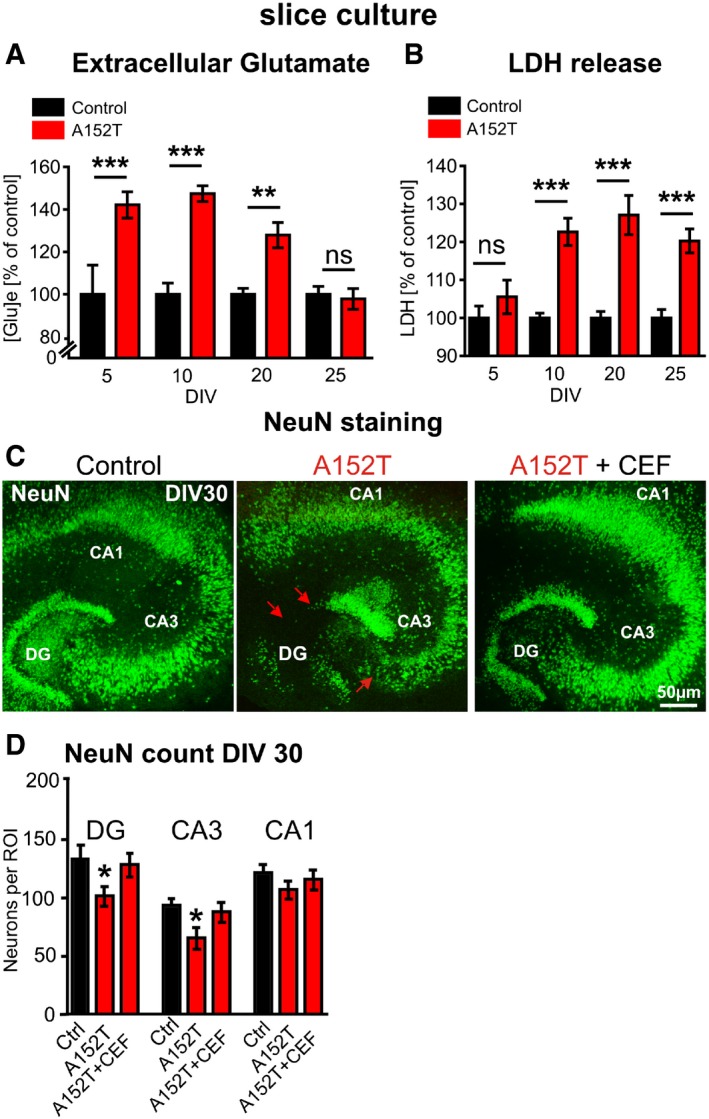
- Glutamate content in the culture medium ([Glu]e) from either hTauAT (n = 10 culture inserts containing 6 slices each) or control slices (n = 5–12 culture inserts) analyzed at DIV 5, 10, 20 and 25. Glutamate content from medium cultured with hTauAT slices is shown in percent of control at each time point. Increased levels were observed between DIV 5 and DIV 20. At DIV 25, glutamate levels already declined to control levels. One‐way ANOVA followed by Tukey's post hoc test: **P < 0.01, ***P < 0.001.
- Lactate dehydrogenase (LDH) release (a measure of cytotoxicity) analyzed in hTauAT (n = 17–19 culture inserts containing 6 slices each) or control slices (n = 15–16 culture inserts) at DIV5, 10, 20 and 25. LDH release of hTauAT slices is shown in percent of control at each time point. A pronounced increase (˜25%) in LDH release was observed due to hTauAT expression starting at DIV 10 but not at DIV 5. One‐way ANOVA; ***P < 0.001.
- Slice cultures from control (left), hTauAT (middle) or hTauAT treated with ceftriaxone (CEF 100 μM; right) stained against neuronal nuclear protein (NeuN) at DIV 30. Representative neuronal cell layers are shown. hTauAT slices show neuronal loss in the granular cell layer of the dentate gyrus and the pyramidal cell layer in the region of the hilus in area CA3 (middle panel, red arrows). Treatment with ceftriaxone for 30 days prevents neuronal loss in DG and area CA3.
- NeuN‐positive cell bodies were counted in the DG and within the pyramidal cell layer in area CA3 and CA1 at DIV 30 in defined regions of interest (ROI). The number of neurons was reduced in hTauAT slices, both within area DG and CA3, whereas the number of neurons in the CA1 was only slightly affected. Neuronal loss was largely prevented in cultures treated with ceftriaxone (CEF) in dentate gyrus and area CA3 (n = 14–19 slices per group and area; prepared from at least 6 animals). One‐way ANOVA followed by Tukey's post hoc test; *P < 0.05.
To test whether augmented, NR2B‐mediated calcium influx in hTauAT slices leads to downstream cell‐death signaling pathway, we evaluated the effect of hTauAT on cytotoxicity. This revealed an increase in lactate dehydrogenase (LDH) release, a marker for dying cells, starting at DIV 10 (+23%; Fig 5B) and lasting over the whole cultivation period of 25 days (+27% at DIV 20, +20% at DIV 25; Fig 5B). An exception was the earliest time point of measurement (DIV 5) where toxicity stayed close to control levels (+5%, Fig 5B), demonstrating that toxicity progresses from young to older hTauAT slices. The question therefore arose, what is the cause of the rise in Ca2+ and of cytotoxicity in slices from hTauAT mice?
To further differentiate between cytotoxicity and neurotoxicity and to test a possible differential vulnerability of hippocampal subregions, NeuN immunohistochemistry was performed. NeuN‐expressing cells were counted at DIV 30 and showed a selective neuronal loss in area CA3 (−30%, P = 0.015) and DG (−23%, P = 0.032, Fig 5C and D) in hTauAT‐expressing slices, whereas CA1 neurons were only mildly affected (−11%, P = 0.15, Fig 5D). We further analyzed neurons in slices at an earlier (DIV 10; Fig EV2A) and a later time point (DIV 60; Fig EV2B). At DIV 10, no significant cell loss was detected in areas DG, CA1, and CA3. In contrast, at DIV 60 neuronal loss was even more pronounced when compared to values observed at DIV 30. These findings in slice cultures were supported by the observation of neuronal cell loss in the hippocampus of aged hTauAT mice. Neuronal cell loss was prominent in the pyramidal layer of area CA3 in 12‐month‐old heterozygous hTauAT mice (Fig EV5A). Next, we analyzed NeuN protein levels in hippocampi of 12‐ and 18‐month‐old hTauAT mice (Fig EV5B and C). Here, we found a progressive loss of NeuN expression which was reduced by ~10% already in 12‐month‐old hTauAT mice and neuronal loss became more pronounced to ~35% in 18‐month‐old hTauAT mice when compared to control mice (Fig EV5B and C). Hippocampal neurotoxicity was also confirmed in hippocampi from 16‐month‐old, heterozygous hTauAT animals by quantitative real‐time PCR. NeuN mRNA was significantly decreased in hippocampi from hTauAT mice compared to control littermate hippocampi (n = 4 animals per group, unpaired t‐test: P = 0.0323, Fig EV2C). The activity of the pro‐apoptotic caspase 3 was not increased in hTauAT slices compared to control (P = 0.4143; Fig EV2D). This points to a necrotic caspase‐independent pathway rather than apoptotic events leading to neuronal cell death.
Figure EV2. Neuronal counting in young and old slice cultures demonstrating progressive cell loss due to hTauAT expression and CREB shut‐off.
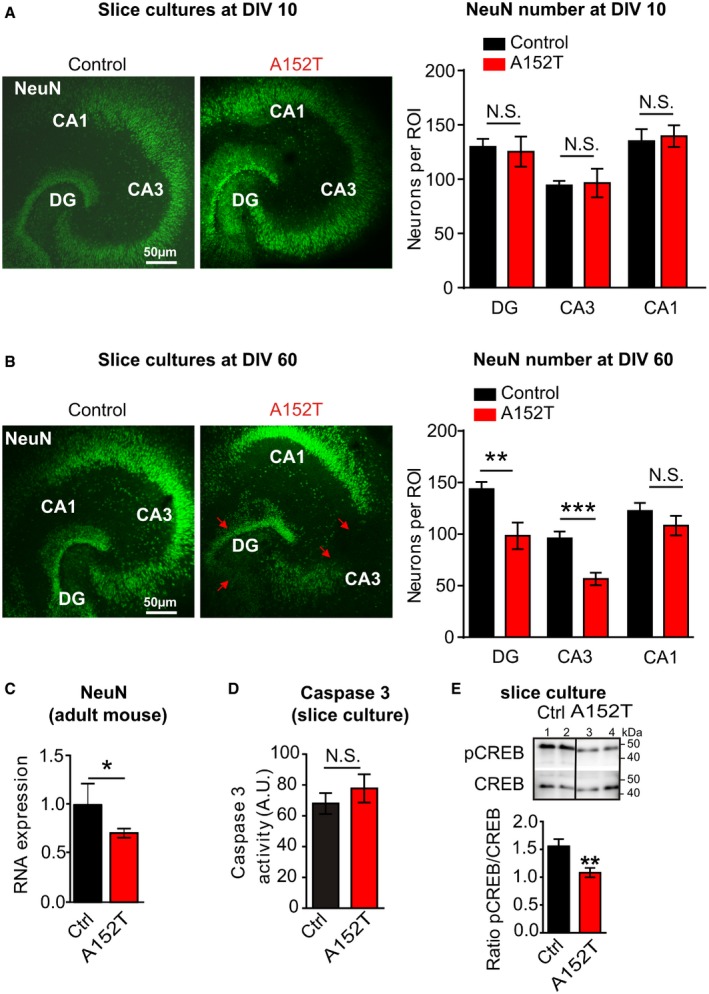
- NeuN‐positive cell bodies were counted in the DG and within the pyramidal cell layer in areas CA3 and CA1 in slice cultures at DIV 10 in defined regions of interest (ROI). The number of neurons was unchanged in all regions investigated (n = 7 slices; prepared from at least two animals).
- NeuN‐positive cell bodies were counted in the DG and within the pyramidal cell layer in area CA3 and CA1 in 60‐day‐old slice cultures. The number of neurons was strongly reduced in hTauAT slices, both within area DG (**P = 0.0096) and CA3 (***P = 0.0007), whereas the number of neurons in the CA1 region (n.s., P = 0.2893) was only slightly affected (n = 6–9 slices; prepared from at least two animals; Student's t‐test).
- Comparison of NeuN mRNA levels in control littermates and hTauAT animals (control = 100%; n = 4 animals). In hTauAT animals, NeuN mRNA is decreased to ˜70% of control, indicating neuronal loss (n = 4 animals). Student's t‐test; *P < 0.05.
- Caspase‐3 activity was not significantly changed in hTauAT slices (n = 5 slice homogenates prepared from 6 slices; Student's t‐test; n.s., P = 0.4143).
- Slice homogenates of control (Ctrl, lanes 1 + 2) and hTauAT (A152T, lanes 3 + 4) were probed for Western blot analysis with antibodies against CREB and p133CREB. The ratio of p133CREB to CREB was strongly reduced in hTauAT slices (n = 12) in comparison to control littermates (n = 6 slice homogenates, Student's t‐test; **P = 0.0064), indicating the activation of the CREB shut‐off pathway.
Data information: Error bars indicate mean ± SEM.
Figure EV5. In adult mice, the expression of hTauAT leads to progressive neuronal loss in the hippocampus.
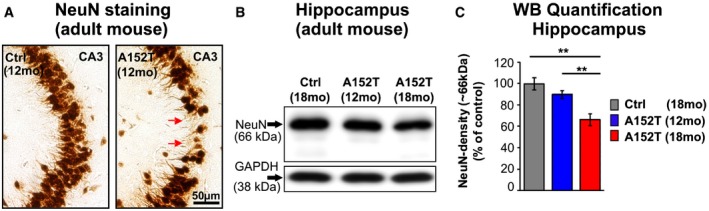
- Microphotograph of paraffin sections of 12‐month‐old control littermates and hTauAT‐expressing mice demonstrating neuronal loss (red arrows) in area CA3 by anti‐NeuN immunochemistry.
- Western blots of hippocampus extracts show NeuN expression levels in 12‐ and 18‐month‐old hTauAT and 18‐month‐old control mice (Ctrl). GAPDH serves as a loading control. Note the dramatic loss of NeuN (˜66 kDa) in 18‐month‐old hTauAT compared to control mice.
- Quantification of (B) normalized to GAPDH. Neuronal loss of ˜10% in 12‐month‐old hTauAT mice (blue bar) and neuronal loss of ˜35% in 18‐month‐old hTauAT mice (red bar) compared to control indicate progressive neurodegeneration in aging hTauAT mice. Bars show mean values ± SEM (n = 4 animals). One‐way ANOVA followed by a post hoc Newman–Keuls multiple comparison test. Asterisks indicate significant differences (**P < 0.01) between control and 18‐month‐old hTauAT mice and between 12‐ and 18‐month‐old hTauAT mice. CA, cornu ammonis; mo, months.
Ca2+ flux through extrasynaptic NMDARs is known to induce dephosphorylation of CREB protein (at Ser133) which in turn causes shut‐off of the CREB pathway, leading to neuronal death 38, 40, 43. Therefore, we monitored a potential CREB shut‐off in hTauAT slices by Western blot analysis for total CREB and pS133‐CREB (Fig EV2E). There was a marked reduction (−50%; P = 0.0064) in active pCREB levels in the mutant slices (Fig EV2E). Taking these findings together with the elevated levels of extracellular glutamate and elevated [Ca2+]i, we conclude that a pathological increase in Ca2+ influx through extrasynaptic NMDARs takes place in hTauAT slices resulting in activation of the pro‐death CREB shut‐off pathway and subsequent neurotoxicity.
The hTauAT mutation enhances synaptic transmission and susceptibility for epileptiform activity in area CA3 without affecting synaptic plasticity
The shut‐off of CREB activity influences not only synaptic plasticity and memory formation but also neuronal survival 44 which is based on the proper function of dendritic spines 45. We thus analyzed dendritic spine density of 10‐ to 12‐month‐old, heterozygous hTauAT mice. Apical dendrites of hTauAT CA3 pyramidal neurons displayed a 50% increased spine density compared to control littermate animals (2.04 ± 0.15 spines/μm and 1.36 ± 0.05 spines/μm, P = 0.039; Fig 6A–C). In organotypical slices at DIV 20, the spine density of CA3 apical dendrites was unchanged in hTauAT slices (control: ~1.6 spines, hTauAT: ~1.4 spines/μm, Fig EV3A–E).
Figure 6. hTauAT enhances synaptic transmission and dendritic spine density in area CA3 but does not interfere with synaptic plasticity.
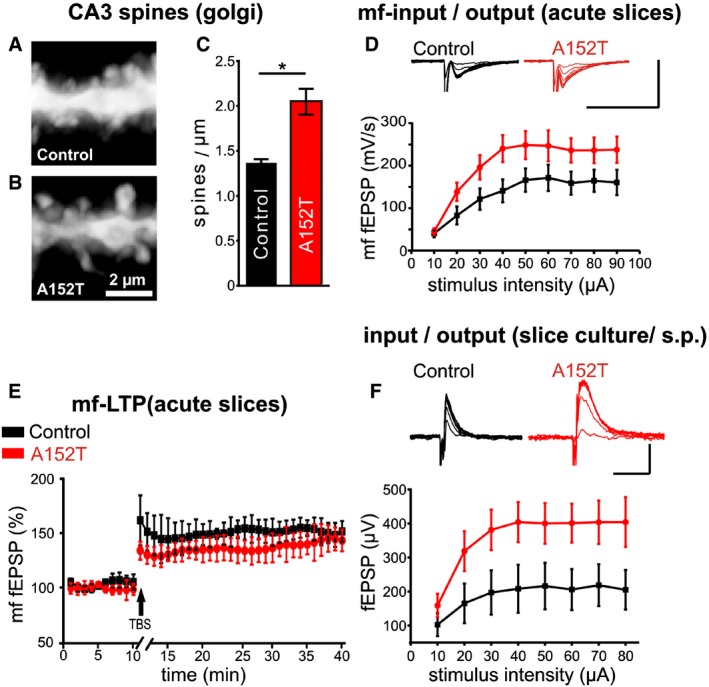
- Representative microphotograph of spines on dendrites from control littermate mice at the age of 12 months. Apical dendrites from CA3 pyramidal neurons are visualized by Golgi staining. The contrast of photomicrographs was inverted.
- Dendritic spines from heterozygous hTauAT mice, seen by Golgi staining.
- Quantification of dendritic spine densities in control littermate and hTauAT mice. Note that the spine density in heterozygous hTauAT is increased (control littermates: n = 2 animals; heterozygous hTauAT: n = 4 animals; an average of 5 dendrites of CA3 pyramidal neurons were analyzed per animal; unpaired t‐test).
- Input/output curve of field potential recording in the mossy fiber pathway in acute slices of 12(±1)‐month‐old mice demonstrating significantly enhanced basal synaptic transmission (multiple repeat ANOVA, F(9, 126) = 2.00, P = 0.044) in area CA3 in mice expressing hTauAT. Scale bars: 500 μV vertical bar and 20 msec horizontal bar.
- Long‐term potentiation in the mossy fiber pathway demonstrates no differences in long‐term plasticity between control (black) and hTauAT‐expressing mice (red).
- Input/output curve of field potential recording in stratum pyramidale (s.p.) of area CA3 in organotypic hippocampal slices at DIV 30. Somatic field potentials are increased in hTauAT compared to control littermates. Scale bars: 800 μV vertical bar and 20 msec horizontal bar.
Figure EV3. Dendritic spine density, paired‐pulse ratio as well as input–output relation in area CA3 of young slice cultures is unchanged.

- Example of a DiI‐labeled neuron in 20‐day‐old control slice culture.
- Example of soma region and dendritic region where apical dendrites of area CA3 pyramidal neurons were imaged.
- Spines on apical dendrites (˜100 μm distance to the cell body) in control littermate slices (magnification of box in B). Most spines are of the “stubby” type.
- Spines on dendrites from hTauAT‐expressing slices have a mostly filamentous morphology.
- Quantification of spine density per μm dendrite length did not show differences between control and hTauAT‐expressing neurons (Student's t‐test: P = 0.110; n = 26 neurons from at least 12 slices (Control); n = 24 neurons from at least 12 slices (hTauAT)).
- Paired‐pulse ratio as a measure for short‐term plasticity in the mossy fiber pathway of adult mice shows no differences between control littermates (n = 29) and TauAT‐expressing mice (n = 38).
- Input–output relation of field excitatory potentials recorded in stratum pyramidale of area CA3 in hippocampal slice cultures. At DIV 10, no change between control littermates (n = 7) and hTauAT‐expressing mice (n = 12) could be detected.
Data information: Error bars represent SEM.
Long‐term potentiation (LTP) is a common way to measure learning and memory on a cellular scale because memories are encoded by changes in synaptic strength through LTP and LTD 46. We used excitatory postsynaptic field potentials (fEPSP) in stratum lucidum of area CA3 to measure basal synaptic transmission, short‐term plasticity and long‐term plasticity of the mossy fiber pathway, since this pathway was found to be particularly affected as judged by tauopathy markers (e.g., PHF1, Alz‐50, Figs 2 and 2). Recording input/output curves of the mossy fiber pathway from 12(±1)‐month‐old hTauAT (+/−) mice revealed an increase in basal synaptic transmission compared to non‐transgenic siblings (Fig 6D). At 10 μA stimulation intensity, fEPSP responses still stayed at the same level in control littermates and hTauAT animals (40.4 ± 9.1 mV/s, n = 7 and 44.8 ± 8 mV/s, n = 9; Fig 6D), but when comparing all other stimulation intensity steps the responses of hTauAT mice were clearly increased. The maximum of the i/o curve of hTauAT animals was reached at 50 μA stimulation intensity (248.49 ± 33.1 mV/s, n = 9; Fig 6D), whereas control littermates reached the maximum fEPSP only at 60 μA stimulation intensity (171.4 ± 30.9 mV/s, n = 7; Fig 6D). However, short‐term plasticity (paired‐pulse facilitation) remained unaffected in hTauAT mice (paired‐pulse ratio control littermates: 1.44 ± 0.08, n = 31 and hTauAT: 1.48 ± 0.05, n = 33; Fig EV3F). The same was true for long‐term plasticity evoked by theta burst stimulation in the mossy fiber pathway. There were no differences in the level of potentiation of the last 10 min of LTP recording (control littermates: 152 ± 9.7% of baseline, n = 6 and hTauAT: 141.2 ± 12.2% of baseline, last 10 min of recording, n = 7; Fig 6E).
Similar to the situation in acute hippocampal slices, recording evoked fEPSPs in stratum pyramidale of area CA3 in DIV 26–30 old hTauAT organotypic slices revealed elevated amplitudes of somatic fEPSPs in stratum pyramidale (Fig 6F). At an input stimulus intensity of 10 μA, the average output fEPSP amplitude in control littermate slices was 102.5 ± 33.64 μV (n = 5) and 158.58 ± 34.79 μV (n = 15) in hTauAT slices; however, overall amplitudes were increased in hTauAT slices compared to control littermates (multiple repeat ANOVA, F(7,89) = 2.1874, P = 0.042; Fig 6F). In younger slices at DIV 10, this effect was not observed (no significant difference between control (n = 5) and hTauAT slices (n = 12); multiple repeat ANOVA, F(7,77) = 1.1472, P = 0.34, Fig EV3G), which suggest a progression of this phenotype with age.
Given that basal synaptic transmission in the mossy fiber tract of hTauAT mice was increased, we hypothesized that this might be accompanied by elevated susceptibility for epileptiform activity. To investigate this, we recorded field potentials (fEPSPs) in stratum pyramidale of area CA3 in hTauAT‐expressing slices. Picrotoxin (50 μm) was used to induce epileptiform discharges by blocking GABAergic transmission in control slices and hTauAT‐expressing slices at two time points (DIV 10 and DIV 30). After washing in picrotoxin diluted in ACSF, recurrent epileptiform discharges occurred approximately after 3 min (Fig 7A and B). At DIV 10, when extracellular glutamate concentrations are enhanced in hTauAT slices (Fig 5B), we observed an increase in burst frequency (bursts per minute) compared to control littermate slices (control: 1.07 ± 0.21 burst per minute, n = 8 slices and hTauAT: 1.82 ± 0.169 bursts per minute, n = 8, two‐sample t‐test: P = 0.001; Fig 7C). In addition, the number of firings per burst was enhanced by ~40% (control: 5.80 ± 0.73 firings per burst, n = 7 slices and hTauAT: 8.32 ± 0.41 firings per burst, n = 5; two‐sample t‐test: P = 0.004; Fig 7D). Recording at a later time point (DIV 30), when excessive extracellular glutamate levels drop down to control levels (Fig 5A), demonstrated that enhanced epileptiform activity becomes even more pronounced. At this time point, hTauAT‐expressing slices display on average 2.56 ± 0.26 bursts per minute (n = 10, Fig 7E) after picrotoxin wash‐in, which was ~100% higher than recorded in control littermate slices (1.24 ± 0.37 bursts per minute, n = 5, two‐sample t‐test: P = 0.006; Fig 7E).
Figure 7. 2Cultured slices expressing hTauAT show a progressive increase in epileptiform activity and mossy fiber sprouting which can be prevented by CEF application.
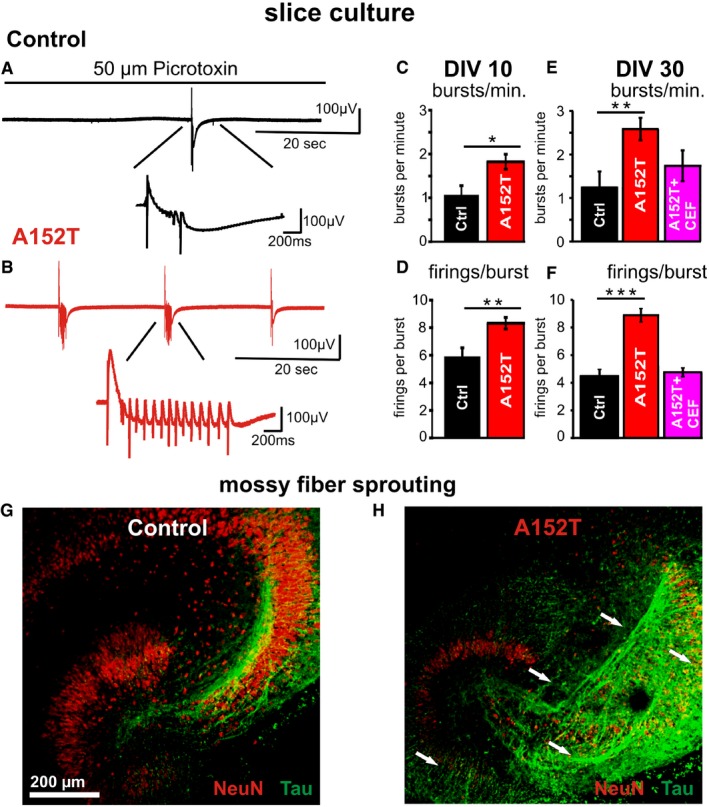
- Example of electrophysiological fEPSP recording in stratum pyramidale of area CA3 in a control slice (DIV 30) during wash‐in of 50 μM picrotoxin. This leads to blockage of GABAergic transmission followed by epileptiform discharges (burst) occurring approximately after 3 min. The zoom‐in reveals that such an epileptiform discharge (burst) consists of repetitive firings.
- Similar example trace as in (A) recorded in a hTauAT‐expressing slice (red) demonstrating an increase in burst frequency as well as in firings per burst due to hTauAT expression.
- Quantification of bursts per minute in DIV 10 slices from control littermates and hTauAT slices demonstrating a ˜twofold increase in hTauAT slices (n = 8 slices per group).
- Firings per burst are increased ˜1.5‐fold already at the early time point DIV 10 due to hTauAT expression.
- Analysis of burst frequency in slices at DIV 30 demonstrates the progression of the pathological effect beyond that observed at DIV 10. Burst frequency is enhanced in hTauAT‐expressing slices (n = 10 slices). If ceftriaxone (CEF) is applied to hTauAT slices, the pathological burst frequency enhancement is partly prevented (n = 5 slices).
- Firings per burst are strongly enhanced due to hTauAT expression in slices at DIV 30. Ceftriaxone prevents this pathological phenotype if applied during the entire period of cultivation (n = 6 slices).
- Example of a control littermate organotypic slice culture at DIV 24 stained against NeuN (red) and pan‐Tau (K9JA antibody, green). Axonal projections (green) of granule cells (red) in the dentate gyrus are depicted.
- Hippocampal slice culture expressing hTauAT stained against NeuN (red) and pan‐Tau (green) showing mossy fiber sprouting in the hilar region, CA3 and dentate gyrus (white arrows).
Applying the β‐lactam antibiotic ceftriaxone (CEF), which is known to upregulate the astrocytic excitatory amino acid transporter EAAT2/GLT1 expression and its biochemical activity 47, prevented the burst frequency increase in hTauAT slices, presumably by normalizing extracellular glutamate levels (1.74 ± 0.35 bursts per minute, n = 5, Fig 7E). Similar to the burst frequency, firings per burst were strongly enhanced (~80%) at DIV 30 in slices expressing hTauAT (control: 4.47 ± 0.42 firings per burst, n = 5 and hTauAT: 8.74 ± 0.45, n = 10, Fig 7F, t‐test: P = 0.0000001). Finally, a pathological change in slices expressing hTauAT recorded at DIV 30 was prevented by ceftriaxone (4.71 ± 0.32 firings per burst, n = 6, Fig 7F).
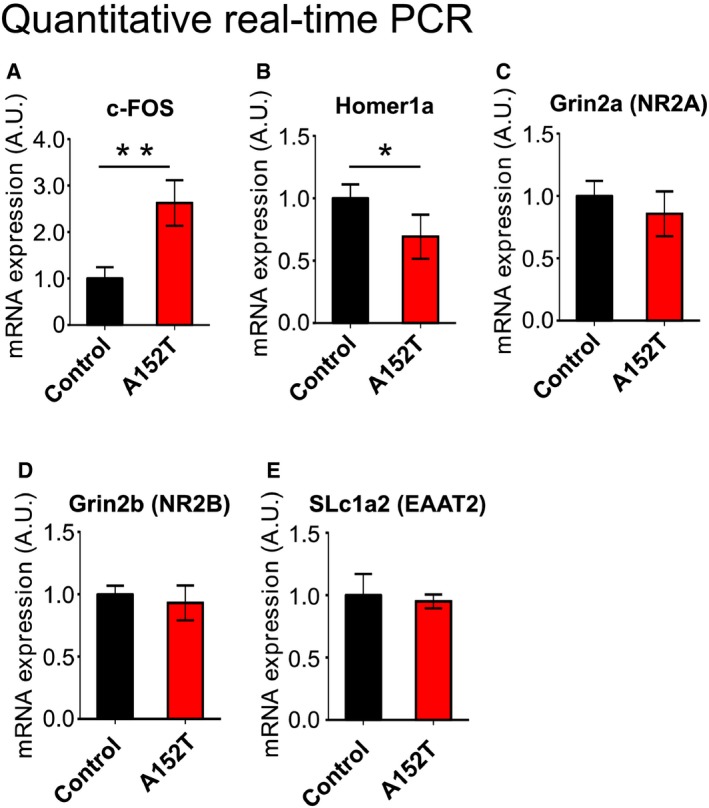
Staining by pan‐Tau antibody (K9JA) indicated that hTauAT slices used for epileptiform activity recordings displayed increased mossy fiber sprouting (Fig 7G and H). In adult heterozygous A152T mice, we confirmed network hyperactivity in the hippocampus by a significant increase in c‐Fos mRNA expression in comparison to control littermates (n = 4 animals per group, P = 0.001, Fig EV4A). c‐Fos is upregulated in the hippocampus under a variety of activity inducing conditions, for example, seizure induction 48. At the same time, Homer1a was downregulated (Fig EV4B) in such animals pointing to a disturbed Homer scaffolding with metabotropic glutamate receptors, which is causative for an epileptic phenotype in a mouse model with fragile X syndrome 49, 50. However, we did not observe any changes in transcription levels of NR2B and NR2A receptors (Fig EV4C and D).
Figure EV4. Quantitative real‐time PCR for network activity markers, NMDAR subunits, and glutamate transporter in hippocampi from 16‐month‐old hTauAT‐expressing mice.
-
AQuantification of c‐Fos mRNA in control littermate and hTauAT transgenics. Note the pronounced increase in c‐Fos expression in transgenic animals (˜250% of control), indicating enhanced neuronal activity.
-
BAmount of mRNA of the scaffolding protein Homer1a in control littermate mice and hTauAT‐expressing mice. Mutant Tau expression decreases expression of Homer1a (˜70% of control).
-
C, DQuantification of Grin2a (C) and Grin2b (D) transcripts. No obvious changes were detected, indicating no translational changes in NR2A and NR2B subunits in hTauAT mice.
-
EQuantification of SLc1a2 (EAAT2) transcripts. No obvious changes could be detected, indicating that EAAT2 mRNA levels are normal in hTauAT mice.
Data information: Error bars denote SEM; *P < 0.05, **P < 0.01. All experiments were carried out with 4 animals per group.
Enhanced presynaptic glutamate release is responsible for excitotoxicity due to hTauAT expression
The observation that extracellular glutamate concentrations are elevated even before cytotoxicity becomes enhanced (Fig 5A and B) was indicative of a mechanism of glutamate‐mediated excitotoxicity in hTauAT slices. To prove that excess glutamate in the slice medium was due to enhanced neuronal activity (causing elevated neurotransmitter release), we next incubated the slices with either tetrodotoxin (TTX: 1 μM) to inhibit action potentials driven by voltage‐gated sodium channels or tetanus neurotoxin (TeNT: 50 nM) to inhibit glutamate release from presynaptic terminals. In both conditions, glutamate levels in hTauAT slices dropped down to control levels (TeNT: −57%; TTX: −35%; Fig 8A). Both inhibitors had smaller effects in control slices (TeNT: −35%; TTX: −25%; Fig 8A), indicating that elevated glutamate levels are due to hTauAT expression.
Figure 8. The pathophysiological phenotype of hTauAT expression is related to enhanced presynaptic release and is prevented by increasing EAAT2/GLT1 activity.
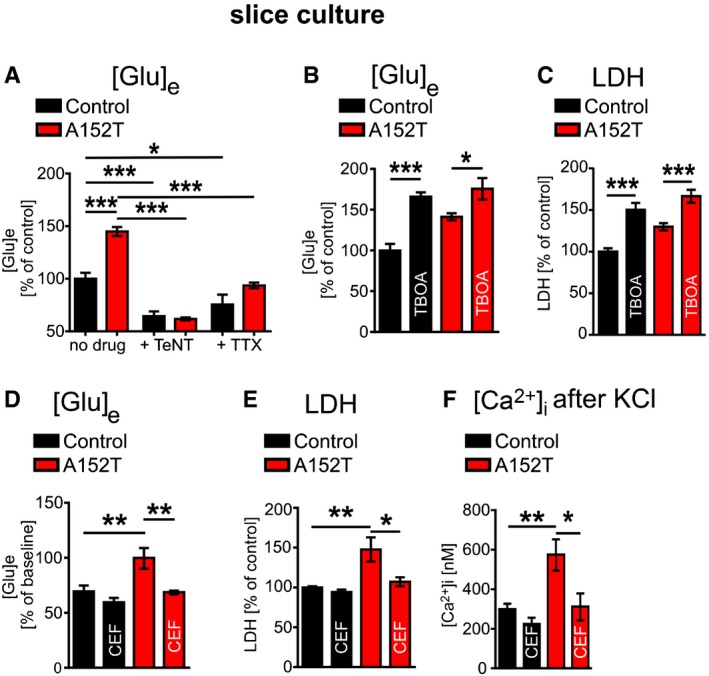
- Quantification of glutamate concentrations in the medium of control and hTauAT cultures in the presence of either 50 nM tetanus neurotoxin (TeNT) or 1 μM tetrodotoxin (TTX) at DIV5. Under both conditions, glutamate levels in the culture medium of hTauAT slices decreased to control levels (n = 6 culture inserts containing 6 slices each/group and condition).
- Quantification of extracellular glutamate concentrations in culture medium of either control or hTauAT slices at DIV 20 in the presence or absence of 50 μM benzyloxy‐aspartic acid (TBOA) from DIV 1‐DIV 20 demonstrating a possible contribution of astrocytic glutamate dysregulation to increased extracellular glutamate in hTauAT slices (n = 8–9 culture inserts containing 6 slices each/group and condition). One‐way ANOVA F(3,30) = 14,89; P < 0.001.
- Quantification of LDH release into the culture medium of either control or hTauAT slices at DIV 20 in the presence or absence of 50 μM benzyloxy‐aspartic acid (TBOA) from DIV 1 to DIV 20 (n = 6–12 culture inserts containing 6 slices each/group and condition). One‐way ANOVA followed by Tukey's post hoc test.
- Quantification of extracellular glutamate concentrations in either control or hTauAT cultures (n = 7–8 culture inserts containing 6 slices each/group and condition) treated with ceftriaxone from DIV 1 to DIV 25 demonstrating the preventative effect of CEF on the increase in extracellular glutamate in hTauAT slices. One‐way ANOVA F(3,25) = 9.075; P = 0.0003.
- LDH release at DIV 25 is strongly reduced due to long‐term treatment with ceftriaxone in hTauAT slice cultures (n = 8–10 culture inserts containing 6 slices each/group and condition). One‐way ANOVA F(3,32) = 7.685; P = 0.0005.
- Intracellular calcium rise after KCl stimulation is not distinguishable from control slices in hTauAT slices treated with ceftriaxone for 15 days (n = 5–9 slices; prepared from at least three animals). One‐way ANOVA F(3,25) = 7.317; P = 0.0011.
EAAT2/GLT1 plays important roles in restricting extracellular glutamate concentrations in order to limit the activation of glutamate receptors, thereby protecting neurons from excitotoxicity 51. To test this, EAAT2/GLT1 was blocked by treating slices with benzyloxyaspartic acid (TBOA, 50 μM). This caused a strong increase in glutamate in control slices (+66%; P < 0.01), but only a small rise in hTauAT slices (+24%, Fig 8B) accompanied by an increase in cytotoxicity (LDH; control: +50%; P < 0.001; hTauAT: +28%, P < 0.001, Fig 8C).
To investigate mechanisms causing the rise in extracellular glutamate due to hTauAT expression, we treated organotypic cultures with ceftriaxone (CEF: 100 μM, starting at DIV 1) (Figs 8D–F and5C and D). Indeed, treatment with CEF prevented all pathological phenotypes in hTauAT‐expressing slices mentioned above, that is, (i) extracellular glutamate (Fig 8D), (ii) maximum calcium influx after membrane depolarization (Fig 8F), (iii) neurotoxicity measured by LDH release (Fig 8E), (iv) epileptiform activity (Fig 7E and F), and (v) neuronal loss (by NeuN counting; Fig 5C and D).
Discussion
In the present study, we used aged hTauAT mice and organotypic hippocampal slices from P8 mice to characterize the pathophysiological phenotype of the recently described Tau mutation p.A152T 4, 7. This mutation is a risk factor for FTD‐spectrum disorders such as PSP or CBD, and AD. However, its pathogenic effects are poorly understood. In transgenic mice and slice cultures, we found characteristic signs of Tau pathology, that is, phosphorylation, pathological conformation, somato‐dendritic mis‐sorting, aggregation, neuronal degeneration, and loss due to hTauAT expression, similar to human carriers 5, 6. The slices revealed a remarkable increase in intracellular Ca2+ concentration in hippocampal CA3 neurons, both at resting state and after membrane depolarization. These alterations were apparent before Tau aggregates, suggesting oligomeric forms of Tau as mediators of these changes. Indeed, in vitro experiments had shown that p.A152T favors the formation of oligomers 7. This is remarkable because the mutation lies in the N‐terminal domain, far away from the repeat domain that forms the core of aggregation, and therefore, one would not expect the mutation to have an effect on tau aggregation.
To identify the origin of the intracellular Ca2+ increase, we tested different drugs and found that intracellular Ca2+ concentrations were normalized by ifenprodil and memantine (targeting NR2B‐containing NMDA receptors) but also by nifedipine (targeting VGCCs). Since we also observed enhanced extracellular glutamate levels in hTauAT slices, we assume this phenotype to cause network hyperactivity. This was confirmed by the measurements of epileptiform activity. In conclusion, an increased network activity could lead to constant enhancement of extracellular glutamate concentrations, which would in turn lead to increased NR2B activation causing increased intracellular Ca2+ concentrations.
For future investigation, it would be worth investigating whether a Na/Ca exchanger reversal is contributing to the high intracellular calcium concentration comparable to the situation in other excitotoxic phenotypes (e.g., ischemia, stroke). Since we found no indication of disturbances in NR2A or NR2B transcription by real‐time PCR measurements (Fig EV4C and D), one can speculate that the enhanced calcium influx through NR2B‐containing NMDAR at resting state should be due to receptor/channel dysfunction caused by somato‐dendritic mis‐sorted Tau. Indeed, we observed enhanced epileptiform activity in hTauAT slices at DIV 10 and 30 as well as an increase in synaptic transmission. Consistent with this, several reports have suggested the involvement of the NR2B subunit in the mediation of seizures 52, and the reduction in Tau leads to seizure resistance in epilepsy models 21, 53. Moreover, when rats were treated with transient middle cerebral artery occlusion to initiate an excitotoxic insult, NR2B‐containing NMDARs were overactivated, resulting in Tau hyperphosphorylation and aggregation 54.
It is notable that different Tau mutations may have opposite consequences on synaptic transmission in mice: Pro‐aggregant mutations in Tau's repeat domain (Δ280) lead to reduced transmission in the mossy fiber tract 15, 55, 56, whereas the amino‐terminal mutation A152T, described here, enhances transmission in the same pathway. By analogy, there can be opposite effects in terms of calcium levels, which are reduced in neurons expressing TauRDΔK280 15, 16 and increased when A152T Tau is expressed. Enhanced calcium levels were also observed in SH‐SY5Y cells expressing Tau with a V337M mutation 57. EEG studies of human hTauAT carriers are not available so far, but increased seizure susceptibility was described for PSP 26 and Alzheimer's disease patients 58.
Notably, we did not observe any changes in synaptic plasticity of the CA3 synapses but an increase in spine density of CA3 pyramidal neurons. An increase in spine density is also observed under excitotoxic conditions in animals which have undergone transient global ischemia 59. This is in strong contrast to mouse models expressing Tau with mutations in the repeat domain which show reduced plasticity and synapse loss 14, 55, 56.
The CREB shut‐off pathway is well established, assuming that enhanced intracellular calcium concentrations through NR2B‐containing NMDAR lead to necrotic cell death 38. In agreement with this pathway, we observed a decreased ratio of phospho‐CREB/CREB, at the same time no alteration in caspase‐3 activity but progressive neuronal cell death due to hTauAT expression in organotypic slices and in adult animals. This correlates well with the observation of enhanced glutamate content in the slice medium of hTauAT slices. Elevated levels of glutamate cause excitotoxic insults which finally lead to neurotoxicity 60. The strongest vulnerability was seen in the DG and CA3, the same regions that were affected in aged hTauAT mice by enhanced synaptic transmission in acute slices as well as in organotypic slices and by increased epileptiform activity in organotypic slices. Moreover, in cultured slices we observed mossy fiber sprouting demonstrating this pathway to be severely affected during the process of pathogenesis. At the ultrastructural level, degenerative hallmarks were observed in aged transgenic mice by electron microscopy in the somato‐dendritic compartment as well as in axons.
It is interesting to compare our results with those of Mucke and colleagues who created regulatable transgenic mice with the same mutation (A152T), but in a different human Tau isoform (1N4R), and under a different promoter, CaMKII‐tTA 27. These mice developed a comparable phenotype including age‐dependent neuronal loss and spontaneous nonconvulsive epileptiform activity. Tau pathology markers and neuronal loss were most prominently found in hippocampal areas CA3 and DG; however, synaptic plasticity was not affected in both mouse lines. The similarity of phenotypes argues for a common pathway of toxicity induced by the Tau‐A152T mutation. Finally, our observations of neuronal toxicity are broadly consistent with the neurotoxicity reported for human‐induced pluripotent stem cells (iPSCs) carrying the Tau‐A152T mutation 61.
As the phenotype suggests, enhanced extracellular glutamate concentrations in the hTauAT slice medium may be caused by an increase in presynaptic release (as revealed by the effect of tetanus toxin, which reduces the increase in extracellular glutamate in hTauAT slices to control levels). However, electrophysiology demonstrated that paired‐pulse ratios are unaffected arguing against presynaptic vesicle release enhancement due to hTauAT expression, but leaving the possibility that extracellular glutamate increase is due to an increase in total number of presynaptic release sites. Additionally, a dysfunction of the glutamate transporter EAAT2/GLT1 in astrocytes may contribute to the observed increase in extracellular glutamate levels as revealed by pharmacological application of the EAAT2/GLT1 blocker TBOA. Dysregulation of glutamate was also reported in other tau transgenic mouse lines 25, 62. Glutamate is largely taken up by astrocytic glutamate transporters (EAAT2/GLT1), but in many neurodegenerative diseases the expression of the EAAT2/GLT1 is reduced 63, 64 and mice expressing mutant tau P301L show lower EAAT2/GLT1 expression levels 25. Indeed, in our slice system the activation of EAAT2/GLT1 by ceftriaxone 47 was able to preserve normal intracellular calcium levels and extracellular glutamate levels; it prevented neurotoxicity and mitigated epileptiform activity to control levels. However, transcription levels of EAAT2/GLT1 remained unchanged in hTauAT‐expressing mice (Fig EV4E).
In conclusion, the pathological effects of the hTauAT mutation are explained by an enhanced presynaptic glutamate release which results in an overactivation of NR2B‐containing, extrasynaptic NMDA receptors that finally initiate an excitotoxic cascade ending up with CREB shutoff and neuronal death. The pathology can be ameliorated by lowering extracellular glutamate (e.g., by enhancing glutamate re‐uptake into astrocytes by ceftriaxon), or by de‐sensitizing extrasynaptic NR2B receptors (e.g., memantine).
Materials and Methods
Generation of hTauAT mice
To achieve ubiquitous transgene expression in the brain at moderate levels, the transgene (human full‐length Tau carrying the mutation A152T) was inserted into the ROSA locus of C57BL/6NTac embryo stem (ES) cells and injected C57BL/6NTac ES cells into BALB/c blastocysts (TACONIC, Germantown, NY). Injected blastocysts were transferred into the uterine horn of pseudopregnant NMR1 females. Chimerism was determined in chimeras by coat color contribution of ES cells to the BALB/c host (black/white). Highly chimeric mice were bred to C57BL/6 females. Germline transmission was identified by the presence of black offspring. The transgene expression is controlled by the neuron‐specific Thy1.2 promoter and occurs in the entire brain and spinal cord. The mouse strain was conceived on an identical C57BL/6N background. The present study presents data from heterozygous and homozygous hTauAT mice. Non‐transgenic littermates were used as negative controls. All animals were housed and tested according to the standards of the German Animal Welfare Act.
Genotyping of hTauAT mice
The hTauAT mice (hetero‐ or homozygous) were identified by PCR of genomic mouse tail DNA using the primer pair 5′‐AGCACCCTTAGTGGATGAGG‐3′ and 5′‐TTGTCATCGCTTCCAGTCC‐3′, which amplified an expected DNA fragment of 192 bp (human Tau construct). Heterozygous and non‐transgenic littermates differ by the appearance of the 299 bp control fragment (ROSA26‐locus) amplified by the primer pair 5′‐CTCTTCCCTCGTGATCTGCAACTCC‐3′ and 5′‐CATGTCTTTAATCTACCTCGATGG‐3′ to homozygous hTauAT.
Biochemical analysis of mice
Mice were anesthetized with a O2/CO2 mixture and killed by decapitation. Sarcosyl extraction, total protein preparation, and Western blots were performed as described previously 29. About 3 μg of total protein or 3 μl of sarcosyl extraction lysates from different tissues (cortex and hippocampus) were loaded for the detection with the pan‐Tau antibody K9JA (1:20,000, Dako). Blots were normalized by the concentration of β‐actin (1:20,000, Sigma), visualized with ECL Plus detection system (GE Healthcare), and analyzed by densitometry (LAS 3000, AIDA software). For the analysis of NeuN (antibody 1:1,000, Millipore) expression, 5 μg of total protein from hippocampal tissue was loaded. Blots were normalized by the concentration of GAPDH (antibody 1:60,000, Sigma).
Real‐time PCR
The RNA extraction was performed by using a standard Trizol/1‐bromo‐3‐chloropropane extraction protocol followed by cDNA generation using the first strand cDNA synthesis kit (Thermo Scientific). RNA was extracted from hippocampus homogenates of 16‐month‐old heterozygous and homozygous animals and control littermates (for all groups n = 4 animals were analyzed). The Primer3Plus program was used for primer design 65. Primers were required to be intron spanning and to be yielding an amplicon of 70–120 basepair. The three most stable housekeeping genes were selected (out of a group of five commonly used housekeeping genes) based on the geNorm value 66. The qPCR analysis was done using the IQ5 optical system real‐time PCR machine (BIO‐RAD) and the Maxima SYBR Green qPCR Master Mix (Thermo). The raw fluorescence data were exported to Excel (Microsoft) after which mRNA levels were determined based on an assumption free analysis by processing the raw fluorescence data with the LinRegPCR program 67. A list of primers is found in Table 1.
Table 1.
Primers
| Gene | Full name | Alias | Sequence (forward) | Sequence(reverse) | TM |
|---|---|---|---|---|---|
| hTau40 A152T | human tau full‐length with A152T substitution | hTauAT | ATCGACATGGTAGACTCGCC | TGACCGGGAGAAGCAAGAC | |
| Fos | FBJ osteosarcoma oncogene | cFOS | TCCTACTACCATTCCCCAGC | ATAAAGTTGGCACTAGAGACGG | 60° |
| Homer1a | homer homolog 1 (Drosophila) | Vesl‐1S | GTTTGAACTGCATTAATAGGGC | GTCATCCCTAACTTCCTTGTTCC | 60° |
| Rbfox3 | RNA binding protein, fox‐1 homolog (C. elegans) 3 | NeuN | GTAGAGGGACGGAAAATTGAG | ATAGACTGTTCCTACCACAGGG | 60° |
| Grin2a | Glutamate receptor, ionotropic, NMDA2A (epsilon 1) | NR2A | ATGGGAAGCATGGGAAAAAGG | CACGGCCATAACTGCTCG | 60° |
| Grin2b | Glutamate receptor, ionotropic, NMDA2B (epsilon 2) | NR2B | TTCCGACATTGCTTCATGGG | TAGCTACTCCGTGGATACAGC | 60° |
| Slc1a2 | Solute carrier family 1 (glial high affinity glutamate transporter), member 2 | EAAT2 | GGAGAACCTGGTGCAAGC | TTCAACATGGAGATGACCGC | 60° |
Immunohistological analysis of mice
Immunohistochemistry was performed on 5‐μm paraffin sections as described previously 29. Brains were placed into histofix (Roth; 4% formalin for 24 h) and dehydrated by sequential incubation in a series of ethanols and chloroform. Sagittal brain sections were incubated with primary antibody prepared in 1% horse serum overnight at 4°C. The following antibodies were used: human Tau‐specific antibody HT7 (1:2,000, Thermo Fisher Scientific, Waltham, MA, USA), AT180 (pThr231/pSer235, 1:500, Pierce, Rockford, USA), AT8 (pSer202/pThr205, 1:500, Thermo Scientific), NeuN (1:1,000, Millipore), Alz‐50 (1:50), and PHF‐1 (1:50, both gifts from Dr. P. Davies, Albert Einstein College, NY, USA). Rabbit polyclonal peptide antibody was generated against pT217 (1:1,000, Biosource, Camarillo, CA, USA). Counterstaining with hematoxylin (Roth, Karlsruhe, Germany) was performed according to the company instructions.
Gallyas silver staining
A total of 5‐μm‐thick paraffin sections were stained as published 68.
Transmission electron microscopy
Heterozygous hTauAT mice (hTauAT mice as described above were crossed with black C57Bl/6N background to Gfap‐luc mice with a white FVB/N background receiving mice with a brown coat color and mixed background 50:50) and controls only carrying the reporter gene but not the mutation (12–13 months old) in groups (n = 4) were terminally anesthetized using ketamine–xylazine and euthanized by perfusion fixation for transmission electron microscopy as described previously 69. Sections were examined using a Zeiss LEO922 transmission electron microscope with a 2k‐CCD camera and subsequently processed using Adobe Photoshop software (Adobe Systems Incorporated, San Jose, CA, USA).
Golgi staining and dendritic spine counting
For Golgi‐Cox impregnation of neurons 70, the FD rapid GolgiStain TM kit (FD NeuroTechnologies, Columbia, MD, USA) was used according to the manufacturer's protocol. A total of 80‐μm floating sections of transgenic and WT mice at 10 months of age were Golgi‐impregnated and hippocampal pyramidal CA3‐neurons were used for quantification of dendritic spines as described 71. The number of animals used for spine quantification was four for heterozygous A152T mice, while two littermate control animals were used for spine counting. An average of 5 dendrites of CA3 pyramidal neurons were analyzed per animal. The sections were imaged using the FV‐1000 microscope (Olympus, Shinjuku, Tokyo, Japan) in stacks by application of a 60× objective and a 5× digital zoom. Stacks were loaded in NeuronStudio (CNIC, NY, USA) and inverted after which the dendrite length and spine detection was done in an automated fashion with the trainable spine classifier. Groups were compared and tested for statistically significant difference by applying an unpaired t‐test.
Hippocampal organotypic slice cultures
Hippocampal organotypic slice cultures were prepared as described 72, with modifications 16. Briefly, 8‐day‐old mice were decapitated, brains were rapidly removed, and hippocampi dissected at 4°C. A McIIwain tissue chopper (Gabler, Bad Schwabach, Germany) was used to prepare 400‐μm‐thick transverse slices which were transferred to semiporous cell culture inserts (Millipore, Bedford, MA, USA; 0.4 mm). Inserts containing 6–8 slices were placed in 6‐well culture trays containing 1 ml of culture media (50% Minimum Essential Medium (MEM), 25% Hank's Balanced Salt Solution (HBSS), penicillin/streptomycin (all from PAA, Pasching, Austria), 25% horse serum, 4.5 mg/ml glucose (Sigma‐Aldrich, St. Louis, MO, USA), pH 7.4). The culture medium was changed on the first day after preparation and afterward every third day. Slices were kept in culture for up to 60 days.
Ca2+ imaging
Ca2+ imaging experiments of organotypic slices (at 15 DIV) were performed as described previously 16. Briefly, slices were loaded with Fura‐2AM (Invitrogen, Carlsbad, CA, USA) at a concentration of 100 μM at 37°C for 30 min. After loading, slices were washed with 4‐(2‐hydroxyethyl)‐1‐piperazineethane sulfonic acid (HEPES)‐buffered saline (130 mM NaCl, 5.4 mM KCl; 10 mM HEPES, 25 mM glucose, 1.8 mM CaCl2, 1 mM MgCl2; pH 7.4) for another 30 min to allow complete de‐esterification of the Fura dye. After washing, cultures were transferred to a submerged imaging chamber of an Examiner A1 microscope (Zeiss, Jena, Germany). Fura‐2 fluorescence was imaged at room temperature (RT) in HEPES‐buffered saline, using a 10× water immersion objective. The emission of Fura‐2‐loaded pyramidal neurons was collected at 510 nm after excitation at 340 and 380 nm, respectively, with a Sutter DCIV shutter (Sutter Instrument Co, Navato, CA, USA). Images were taken at a rate of 1 Hz. For baseline recording, intracellular Ca2+ levels were imaged for a 30‐s period following superfusion with high potassium (HEPES‐buffered saline containing 180 mM KCl) for an additional 30 s. Analysis was performed offline, using 10 regions of interest with constant diameter in area CA3. For each slice, we performed an internal background subtraction, averaged the values in the regions of interest, and normalized with their individual baseline value. Absolute intracellular Ca2+ concentrations were calculated from the ratio of emitted fluorescence (510 nm) after excitation at 340 nm and 380 nm with the standard Grynkiewicz formula 73. The Kd value was calculated by using Invitrogen Fura‐2 calibration kit. Initially, Ca2+ imaging was performed in a blinded fashion to compare control littermate slices with slices expressing hTauAT without drug application.
Microscopy
Images were acquired with an Olympus laser scanning microscope FV1000 (Olympus, Tokyo, Japan), equipped with a confocal laser scanning unit, argon (Ar; 488 nm) and helium/neon (He/Ne 543 nm and 633 nm). For 2 or 3 channel imaging, images were acquired via sequential scanning. Maximum projection images were generated from resulting z‐stacks using ImageJ software (NIH, Bethesda, MD, USA).
DiI labeling of slice cultures and spine counting
Hippocampal slice cultures were fixed at DIV 20 in 4% PFA for 2 h, still attached to the semiporous cell culture inserts. A DiI crystal was placed on the CA3 region followed by an incubation of 10 days at room temperature in 4% PFA to allow diffusion. Dendritic spines were imaged by confocal microscopy using tetramethyl rhodamine isothiocyanate (TRITC)‐filter settings. ImageJ (NIH, USA) was used to measure spine density from resulting z‐stacks.
Cytotoxicity and glutamate assay
Cytotoxicity was assessed by the lactate dehydrogenase (LDH) assay (Cytotoxicity Detection Kit (Roche Diagnostics, Mannheim, Germany)). Slice cultures were incubated in serum‐free culture medium. The medium was collected at different time points in vitro and processed as prescribed. Finally, the absorbance at 492 nm (indicating dying cells) was assayed in 96‐well plates (plate reader Tecan Safire, Männedorf, Switzerland). The amount of glutamate in the culture medium (serum and glutamate free) was determined with the Amplex Red Glutamic Acid/Glutamate Oxidase Assay Kit (Molecular Probes, US). Medium was collected at different time points in vitro and treated as prescribed. Caspase‐3 activity was determined fluorometrically by the EnzChek Caspase‐3 Assay Kit with Z‐DEVD‐AMC substrate (Molecular Probes). Pooled slice cultures (6 slices per sample) were homogenized and treated as prescribed. The assay was performed in 96‐well microplates and read on a fluorescence plate reader (Tecan Safire) at excitation 342 nm and emission 441 nm.
Immunohistological analysis of slice cultures
Slice cultures were attached on the Millicell membrane and stained as free‐floating sections in 6‐well plates. Cultures were first fixed with 4% paraformaldehyde (PFA) in phosphate‐buffered saline (PBS) (PAA, Austria) for 2 h at 4°C. After washing with PBS, slices were permeabilized by 0.1% Triton X‐100/PBS for 90 min at RT. Slices were then blocked with 5% bovine serum albumin (BSA) for 2 h and afterward incubated with primary antibody diluted in PBS for 3 days at 4°C. After washing three times with PBS, slices were incubated with secondary antibody for 3 days at 4°C. Finally, slices were incubated with the nuclear counterstain and dead cell indicator TO‐PRO3 (Thermo Fisher Scientific, Waltham, MA, USA) for 15 min and washed three times with PBS before getting mounted with Permafluor mounting solution (Beckman Coulter, Paris, France) and cover‐slipped. The following primary antibodies were used: monoclonal anti‐neuronal nuclei (NeuN) antibody (Chemicon International, Temecula, CA, USA) (1:500), pan‐Tau antibody K9JA (Dako, Hamburg, Germany, Nr. A0024 (1:1,000)), microtubule associated protein 2a/b (MAP2a/b) antibody (AP20; Sigma‐Aldrich, Germany, 1:200), human‐specific TauY9 (Enzo Life Sciences, Germany, 1:500); and PHF1 antibody for phosphorylated S396/404 Tau (gift from Dr. Peter Davies, Albert Einstein College, NY, US, 1:50); all fluorescent (goat anti‐rabbit/mouse cyanine 2, 3 and 5)‐labeled secondary antibodies were from Dianova (Hamburg, Germany) (1:1,000).
Drug application
For Ca2+ imaging, slices were incubated with the following drugs 120 min before and during Fura‐2AM experiments: 20 μM L‐VGCC inhibitor Nifedipine (Tocris Biosciences, Bristol, UK); 100 μM NMDAR blocker APV (Tocris Biosciences, Bristol, UK); 30 μM AMPAR antagonist CNQX (Tocris Biosciences, US); 20 μM NR2B‐containing NMDA receptor antagonist Ifenprodil (Tocris Biosciences, Bristol, UK); 1 μM sodium channel blocker Tetrodotoxin (TTX) or 8 μM NMDA receptor antagonist memantine. For glutamate and LDH release assays, drugs were administered from DIV 1 until DIV 25 or DIV 30. During treatment, the drug was refreshed every 3rd day, simultaneously with full medium change. The following drugs were used: 1 μM TTX, 100 μM EAAT2/GLT1 activator ceftriaxone; 50 nM tetanus neurotoxin (TeNT) or memantine (8 μM). TBOA (50 μM; Tocris Biosciences, Bristol, UK) and DCGIV (5 μM; Tocris Biosciences, Bristol, UK).
Biochemical analysis of slice cultures
To estimate protein expression, cultured hippocampal slices (6–8, prepared and pooled from the same animal) were homogenized in lysis buffer [50 mM Tris–HCl, pH 7.4, 10% glycerol, 1% NP‐40, 5 mM DTT, 1 mM EGTA, 20 mM NaF, 1 mM Na3VO4, 150 mM NaCl, protease inhibitors (Complete Mini; Roche, Indianapolis, IN), 100 U/ml benzonase, 5 μM okadaic acid, 5 mM CHAPS (3‐[(3‐ cholamidopropyl)dimethylammonio]‐1‐propanesulfonate)]. Total protein extracts were resolved by SDS–PAGE (10% polyacrylamide gels) and transferred to polyvinylidene fluoride (PVDF) membranes (Millipore, Bedford, MA, USA). The membrane was incubated in 5% non‐fat milk in TBS‐Tween for 1 h at RT, washed with TBS‐Tween and incubated overnight in primary antibody solution at 4°C. The membrane was washed with TBS‐Tween and incubated with the secondary antibody (Dako, Hamburg, Germany) coupled to horseradish peroxidase (HRP) for 1 h at RT. The membrane was developed by ECL Western Blotting Detection Kit (GE Healthcare, Chalfont St Giles, UK) and analyzed by densitometry (LAS 3000; AIDA software; Raytest, Straubenhardt, Germany). The following antibodies were used: pan‐Tau antibody K9JA (DAKO, Hamburg, A‐0024) (1:10,000), anti‐β‐actin (Sigma, Germany) (1:10,000)), anti‐CREB (Cell Signaling) (1:1,000), and anti‐p133 CREB (Cell Signaling, Darmstadt, Germany) (1:1,000) and secondary antibodies, HRP‐anti‐rabbit and HRP‐anti‐mouse (DakoCytomation, Carpinteria, CA, USA) (1:1,000).
Electrophysiology
Acute, transverse hippocampal slices were prepared from 12(±1)‐month‐old male and female mice anaesthetized for approximately 15 s by isoflurane inhalation before decapitation. To obtain optimal mossy fiber preservation, a cutting angle of 12° in the fronto‐occipital direction was used 74 for vibrating‐blade microtome (VS1200T; Leica, Wetzlar, Germany) sectioning. A total of 350‐μm‐thick slices were transferred into a custom‐made interface chamber and superfused with carbogenated ACSF (126 mM NaCl, 26 mM NaHCO3, 3 mM KCl, 2.5 mM CaCl2, 1.3 mM MgSO4, 1.25 mM NaH2PO4 and 10 mM glucose, saturated with 95% O2/5% CO2) at 36 ± 0.5°C; flow rate, 1.8–3 ml/min; pH 7.4. After 1.5‐h recovery, slices were transferred to a submerged recording chamber at 30°C. Extracellular field potentials (fEPSP) were recorded from stratum lucidum in area CA3 at a flow rate of ~5 ml/min. The mossy fiber tract was visualized by infrared (IR)/differential interference contrast (DIC) microscopy. As stimulation electrode, a patch‐clamp pipette was used (1–2 MΩ) to excite mossy fibers (mf) in the region of the hilus. Recording electrodes (2.5–3 MΩ) were filled with ACSF and separated constantly 200 μm from each other. fEPSPs were 10× preamplified (custom‐made preamplifier) filtered at 1 kHz and sampled at 10 kHz using a HEKA double patch‐clamp EPC 10 USB amplifier (HEKA Elektronik Dr. Schulze GmbH, Lambrecht, Germany). Organotypic hippocampal slices were recorded at DIV 10 and 30 with the same ACSF composition, temperature, and electrodes as described above.
Stimulation and recording procedures
Constant current pulses were elicited every 20 s (0.05 Hz) with a pulse width of 0.1 ms. Input/output (I/O) curves were generated using stimulus intensities ranging from 10 to 100 μA with an increment of 10 μA. In the same slice, paired‐pulse facilitation (PPF) was evoked by a 50‐ms interstimulus interval (ISI). In a next step, frequency facilitation (FF) of the mossy fiber pathway was measured by switching stimulation frequency from 0.1 to 1 Hz. Only slices which showed robust FF were used further on for mf‐LTP recordings. LTP was induced by theta burst stimulation at 30% of the maximum stimulus intensity as revealed initially during the I/O recording. At the end of each recording, 5 μM DCGIV (Tocris Biosciences, Bristol, UK) was applied for at least 5 min to test mossy fiber specificity. In case the fEPSP slope was not reduced to more than 50% of the initial slope steepness, slices were excluded from further mossy fiber analysis.
Statistical analysis
Statistical analysis was performed by using the statistics software Prism5 (GraphPad, La Jolla, CA, USA). Evaluation of data was performed either by Student's t‐test or one‐way ANOVA followed by Tukey's post hoc test or Newman–Keuls multiple comparison test or multiple repeat ANOVA (Statistica, Statsoft (Europe), Hamburg, Germany) as indicated. If not indicated, P‐values display Student's t‐test. Data are shown as mean ± SEM. P‐values are as follows:*P < 0.05, **< 0.01, and ***P < 0.001.
Author contributions
JMD performed electrophysiological experiments in acute and organotypic slices, calcium imaging in slice cultures as well as analysis, experiment design, writing of the manuscript, and figure artwork. LK contributed immunfluorescence, biochemistry, and calcium imaging in organotypic slices as well as analysis, experiment design, writing of the manuscript, and figure artwork. AS performed biochemical and immunohistochemical analysis of adult transgenic mice. FJAD performed quantitative real‐time PCR and dendritic spine analysis in adult mice. ZS carried out EM experiments and analysis. EM and E‐MM supervised the study and writing of the manuscript.
Conflict of interest
The authors declare that they have no conflict of interest.
Supporting information
Expanded View Figures PDF
Table EV1
Review Process File
Acknowledgements
We thank the following laboratory members for their expert help and advice: Olga Petrova for help with brain sections and biochemical analysis; Stefanie Koenen for help with the mouse breeding, and Dr. Katja Hochgräfe for stimulating discussion. Furthermore, we thank the team of the animal facility of CAESAR (headed by Dr. Dagmar Wachten) and the team of the animal facility of DZNE Bonn (headed by Dr. Ylva Mende & Dr. Michaela Möhring). Reagents are gratefully acknowledged from Dr. P. Seubert (Elan Pharma, South San Francisco, CA; 12E8 antibody) and from Dr. P. Davies (Albert Einstein College, Bronx, NY; Alz‐50 and PHF‐1 antibodies). This research was supported by MPG, DZNE and Tau Consortium.
EMBO Reports (2016) 17: 552–569
See also: S Maeda et al
References
- 1. Goedert M, Crowther RA, Spillantini MG (1998) Tau mutations cause frontotemporal dementias. Neuron 21: 955–958 [DOI] [PubMed] [Google Scholar]
- 2. Barghorn S, Zheng‐Fischhofer Q, Ackmann M, Biernat J, von Bergen M, Mandelkow EM, Mandelkow E (2000) Structure, microtubule interactions, and paired helical filament aggregation by tau mutants of frontotemporal dementias. Biochemistry 39: 11714–11721 [DOI] [PubMed] [Google Scholar]
- 3. Hong M, Zhukareva V, Vogelsberg‐Ragaglia V, Wszolek Z, Reed L, Miller BI, Geschwind DH, Bird TD, McKeel D, Goate A et al (1998) Mutation‐specific functional impairments in distinct tau isoforms of hereditary FTDP‐17. Science 282: 1914–1917 [DOI] [PubMed] [Google Scholar]
- 4. Kovacs GG, Molnar K, Laszlo L, Strobel T, Botond G, Honigschnabl S, Reiner‐Concin A, Palkovits M, Fischer P, Budka H (2011) A peculiar constellation of tau pathology defines a subset of dementia in the elderly. Acta Neuropathol 122: 205–222 [DOI] [PubMed] [Google Scholar]
- 5. Kara E, Ling H, Pittman AM, Shaw K, deSilva R , Simone R, Holton JL, Warren JD, Rohrer JD, Xiromerisiou G et al (2012) The MAPT p.A152T variant is a risk factor associated with tauopathies with atypical clinical and neuropathological features. Neurobiol Aging 33: 2231 e7–2231 e14 [DOI] [PMC free article] [PubMed] [Google Scholar]
- 6. Lee SE, Tartaglia MC, Yener G, Genc S, Seeley WW, Sanchez‐Juan P, Moreno F, Mendez MF, Klein E, Rademakers R et al (2013) Neurodegenerative disease phenotypes in carriers of MAPT p. A152T, a risk factor for frontotemporal dementia spectrum disorders and Alzheimer disease. Alzheimer Dis Assoc Disord 27: 302–309 [DOI] [PMC free article] [PubMed] [Google Scholar]
- 7. Coppola G, Chinnathambi S, Lee JJ, Dombroski BA, Baker MC, Soto‐Ortolaza AI, Lee SE, Klein E, Huang AY, Sears R et al (2012) Evidence for a role of the rare p. A152T variant in MAPT in increasing the risk for FTD‐spectrum and Alzheimer's diseases. Hum Mol Genet 21: 3500–3512 [DOI] [PMC free article] [PubMed] [Google Scholar]
- 8. Binder LI, Frankfurter A, Rebhun LI (1985) The distribution of tau in the mammalian central nervous system. J Cell Biol 101: 1371–1378 [DOI] [PMC free article] [PubMed] [Google Scholar]
- 9. Brion JP, Guilleminot J, Couchie D, Flament‐Durand J, Nunez J (1988) Both adult and juvenile tau microtubule‐associated proteins are axon specific in the developing and adult rat cerebellum. Neuroscience 25: 139–146 [DOI] [PubMed] [Google Scholar]
- 10. Gotz J, Ittner LM, Kins S (2006) Do axonal defects in tau and amyloid precursor protein transgenic animals model axonopathy in Alzheimer's disease? J Neurochem 98: 993–1006 [DOI] [PubMed] [Google Scholar]
- 11. Thies E, Mandelkow EM (2007) Missorting of tau in neurons causes degeneration of synapses that can be rescued by the kinase MARK2/Par‐1. J Neurosci 27: 2896–2907 [DOI] [PMC free article] [PubMed] [Google Scholar]
- 12. Hoover BR, Reed MN, Su J, Penrod RD, Kotilinek LA, Grant MK, Pitstick R, Carlson GA, Lanier LM, Yuan LL et al (2010) Tau mislocalization to dendritic spines mediates synaptic dysfunction independently of neurodegeneration. Neuron 68: 1067–1081 [DOI] [PMC free article] [PubMed] [Google Scholar]
- 13. Ittner LM, Ke YD, Delerue F, Bi M, Gladbach A, van Eersel J, Wolfing H, Chieng BC, Christie MJ, Napier IA et al (2010) Dendritic function of tau mediates amyloid‐beta toxicity in Alzheimer's disease mouse models. Cell 142: 387–397 [DOI] [PubMed] [Google Scholar]
- 14. Polydoro M, Dzhala VI, Pooler AM, Nicholls SB, McKinney AP, Sanchez L, Pitstick R, Carlson GA, Staley KJ, Spires‐Jones TL et al (2014) Soluble pathological tau in the entorhinal cortex leads to presynaptic deficits in an early Alzheimer's disease model. Acta Neuropathol 127: 257–270 [DOI] [PMC free article] [PubMed] [Google Scholar]
- 15. Decker JM, Kruger L, Sydow A, Zhao S, Frotscher M, Mandelkow E, Mandelkow EM (2015) Pro‐aggregant Tau impairs mossy fiber plasticity due to structural changes and Ca2+ dysregulation. Acta Neuropathol Commun 3: 23 [DOI] [PMC free article] [PubMed] [Google Scholar]
- 16. Messing L, Decker JM, Joseph M, Mandelkow E, Mandelkow EM (2013) Cascade of tau toxicity in inducible hippocampal brain slices and prevention by aggregation inhibitors. Neurobiol Aging 34: 1343–1354 [DOI] [PMC free article] [PubMed] [Google Scholar]
- 17. Zempel H, Thies E, Mandelkow E, Mandelkow EM (2010) Abeta oligomers cause localized Ca(2+) elevation, missorting of endogenous Tau into dendrites, Tau phosphorylation, and destruction of microtubules and spines. J Neurosci 30: 11938–11950 [DOI] [PMC free article] [PubMed] [Google Scholar]
- 18. Morris M, Maeda S, Vossel K, Mucke L (2011) The many faces of tau. Neuron 70: 410–426 [DOI] [PMC free article] [PubMed] [Google Scholar]
- 19. Vossel KA, Xu JC, Fomenko V, Miyamoto T, Suberbielle E, Knox JA, Ho K, Kim DH, Yu GQ, Mucke L (2015) Tau reduction prevents Abeta‐induced axonal transport deficits by blocking activation of GSK3beta. J Cell Biol 209: 419–433 [DOI] [PMC free article] [PubMed] [Google Scholar]
- 20. Roberson ED, Halabisky B, Yoo JW, Yao J, Chin J, Yan F, Wu T, Hamto P, Devidze N, Yu GQ et al (2011) Amyloid‐beta/Fyn‐induced synaptic, network, and cognitive impairments depend on tau levels in multiple mouse models of Alzheimer's disease. J Neurosci 31: 700–711 [DOI] [PMC free article] [PubMed] [Google Scholar]
- 21. Holth JK, Bomben VC, Reed JG, Inoue T, Younkin L, Younkin SG, Pautler RG, Botas J, Noebels JL (2013) Tau loss attenuates neuronal network hyperexcitability in mouse and Drosophila genetic models of epilepsy. J Neurosci 33: 1651–1659 [DOI] [PMC free article] [PubMed] [Google Scholar]
- 22. Hauw JJ, Daniel SE, Dickson D, Horoupian DS, Jellinger K, Lantos PL, McKee A, Tabaton M, Litvan I (1994) Preliminary NINDS neuropathologic criteria for Steele‐Richardson‐Olszewski syndrome (progressive supranuclear palsy). Neurology 44: 2015–2019 [DOI] [PubMed] [Google Scholar]
- 23. Amadoro G, Ciotti MT, Costanzi M, Cestari V, Calissano P, Canu N (2006) NMDA receptor mediates tau‐induced neurotoxicity by calpain and ERK/MAPK activation. Proc Natl Acad Sci USA 103: 2892–2897 [DOI] [PMC free article] [PubMed] [Google Scholar]
- 24. Nilsen LH, Rae C, Ittner LM, Gotz J, Sonnewald U (2013) Glutamate metabolism is impaired in transgenic mice with tau hyperphosphorylation. J Cereb Blood Flow Metab 33: 684–691 [DOI] [PMC free article] [PubMed] [Google Scholar]
- 25. Hunsberger HC, Rudy CC, Batten SR, Gerhardt GA, Reed MN (2015) P301L tau expression affects glutamate release and clearance in the hippocampal trisynaptic pathway. J Neurochem 132: 169–182 [DOI] [PMC free article] [PubMed] [Google Scholar]
- 26. Nygaard TG, Duvoisin RC, Manocha M, Chokroverty S (1989) Seizures in progressive supranuclear palsy. Neurology 39: 138–140 [DOI] [PubMed] [Google Scholar]
- 27. Maeda S, Djukic B, Taneja P, Yu G, Lo I, Davis A, Craft R, Guo W, Wang X, Kim D et al (2016) Expression of A152T human tau causes age‐dependent neuronal dysfunction and loss in transgenic mice. EMBO Rep 17: 530–551 [DOI] [PMC free article] [PubMed] [Google Scholar]
- 28. Bouabe H, Okkenhaug K (2013) A protocol for construction of gene targeting vectors and generation of homologous recombinant embryonic stem cells. Methods Mol Biol 1064: 337–354 [DOI] [PMC free article] [PubMed] [Google Scholar]
- 29. Mocanu MM, Nissen A, Eckermann K, Khlistunova I, Biernat J, Drexler D, Petrova O, Schonig K, Bujard H, Mandelkow E et al (2008) The potential for beta‐structure in the repeat domain of tau protein determines aggregation, synaptic decay, neuronal loss, and coassembly with endogenous Tau in inducible mouse models of tauopathy. J Neurosci 28: 737–748 [DOI] [PMC free article] [PubMed] [Google Scholar]
- 30. Siskova Z, Justus D, Kaneko H, Friedrichs D, Henneberg N, Beutel T, Pitsch J, Schoch S, Becker A, von der Kammer H et al (2014) Dendritic structural degeneration is functionally linked to cellular hyperexcitability in a mouse model of Alzheimer's disease. Neuron 84: 1023–1033 [DOI] [PubMed] [Google Scholar]
- 31. Foster KA, McLaughlin N, Edbauer D, Phillips M, Bolton A, Constantine‐Paton M, Sheng M (2010) Distinct roles of NR2A and NR2B cytoplasmic tails in long‐term potentiation. J Neurosci 30: 2676–2685 [DOI] [PMC free article] [PubMed] [Google Scholar]
- 32. Barria A, Malinow R (2002) Subunit‐specific NMDA receptor trafficking to synapses. Neuron 35: 345–353 [DOI] [PubMed] [Google Scholar]
- 33. Barria A, Malinow R (2005) NMDA receptor subunit composition controls synaptic plasticity by regulating binding to CaMKII. Neuron 48: 289–301 [DOI] [PubMed] [Google Scholar]
- 34. Korinek M, Kapras V, Vyklicky V, Adamusova E, Borovska J, Vales K, Stuchlik A, Horak M, Chodounska H, Vyklicky L Jr (2011) Neurosteroid modulation of N‐methyl‐D‐aspartate receptors: molecular mechanism and behavioral effects. Steroids 76: 1409–1418 [DOI] [PubMed] [Google Scholar]
- 35. Xia P, Chen HS, Zhang D, Lipton SA (2010) Memantine preferentially blocks extrasynaptic over synaptic NMDA receptor currents in hippocampal autapses. J Neurosci 30: 11246–11250 [DOI] [PMC free article] [PubMed] [Google Scholar]
- 36. Cull‐Candy SG, Leszkiewicz DN (2004) Role of distinct NMDA receptor subtypes at central synapses. Sci STKE 2004: re16 [DOI] [PubMed] [Google Scholar]
- 37. Cull‐Candy S, Brickley S, Farrant M (2001) NMDA receptor subunits: diversity, development and disease. Curr Opin Neurobiol 11: 327–335 [DOI] [PubMed] [Google Scholar]
- 38. Hardingham GE, Bading H (2010) Synaptic versus extrasynaptic NMDA receptor signalling: implications for neurodegenerative disorders. Nat Rev Neurosci 11: 682–696 [DOI] [PMC free article] [PubMed] [Google Scholar]
- 39. Paoletti P, Bellone C, Zhou Q (2013) NMDA receptor subunit diversity: impact on receptor properties, synaptic plasticity and disease. Nat Rev Neurosci 14: 383–400 [DOI] [PubMed] [Google Scholar]
- 40. Parsons MP, Raymond LA (2014) Extrasynaptic NMDA receptor involvement in central nervous system disorders. Neuron 82: 279–293 [DOI] [PubMed] [Google Scholar]
- 41. Talantova M, Sanz‐Blasco S, Zhang X, Xia P, Akhtar MW, Okamoto S, Dziewczapolski G, Nakamura T, Cao G, Pratt AE et al (2013) Abeta induces astrocytic glutamate release, extrasynaptic NMDA receptor activation, and synaptic loss. Proc Natl Acad Sci USA 110: E2518–E2527 [DOI] [PMC free article] [PubMed] [Google Scholar]
- 42. Hara MR, Snyder SH (2007) Cell signaling and neuronal death. Annu Rev Pharmacol Toxicol 47: 117–141 [DOI] [PubMed] [Google Scholar]
- 43. Mantamadiotis T, Lemberger T, Bleckmann SC, Kern H, Kretz O, Martin Villalba A, Tronche F, Kellendonk C, Gau D, Kapfhammer J et al (2002) Disruption of CREB function in brain leads to neurodegeneration. Nat Genet 31: 47–54 [DOI] [PubMed] [Google Scholar]
- 44. Barco A, Bailey CH, Kandel ER (2006) Common molecular mechanisms in explicit and implicit memory. J Neurochem 97: 1520–1533 [DOI] [PubMed] [Google Scholar]
- 45. Yuste R, Bonhoeffer T (2001) Morphological changes in dendritic spines associated with long‐term synaptic plasticity. Annu Rev Neurosci 24: 1071–1089 [DOI] [PubMed] [Google Scholar]
- 46. Nabavi S, Fox R, Proulx CD, Lin JY, Tsien RY, Malinow R (2014) Engineering a memory with LTD and LTP. Nature 511: 348–352 [DOI] [PMC free article] [PubMed] [Google Scholar]
- 47. Rothstein JD, Patel S, Regan MR, Haenggeli C, Huang YH, Bergles DE, Jin L, Dykes Hoberg M, Vidensky S, Chung DS et al (2005) Beta‐lactam antibiotics offer neuroprotection by increasing glutamate transporter expression. Nature 433: 73–77 [DOI] [PubMed] [Google Scholar]
- 48. Morgan JI, Cohen DR, Hempstead JL, Curran T (1987) Mapping patterns of c‐fos expression in the central nervous system after seizure. Science 237: 192–197 [DOI] [PubMed] [Google Scholar]
- 49. Ronesi JA, Collins KA, Hays SA, Tsai NP, Guo W, Birnbaum SG, Hu JH, Worley PF, Gibson JR, Huber KM (2012) Disrupted Homer scaffolds mediate abnormal mGluR5 function in a mouse model of fragile X syndrome. Nat Neurosci 15: 431–440, S1 [DOI] [PMC free article] [PubMed] [Google Scholar]
- 50. Tang AH, Alger BE (2015) Homer protein‐metabotropic glutamate receptor binding regulates endocannabinoid signaling and affects hyperexcitability in a mouse model of fragile X syndrome. J Neurosci 35: 3938–3945 [DOI] [PMC free article] [PubMed] [Google Scholar]
- 51. Danbolt NC (2001) Glutamate uptake. Prog Neurobiol 65: 1–105 [DOI] [PubMed] [Google Scholar]
- 52. Moddel G, Jacobson B, Ying Z, Janigro D, Bingaman W, Gonzalez‐Martinez J, Kellinghaus C, Prayson RA, Najm IM (2005) The NMDA receptor NR2B subunit contributes to epileptogenesis in human cortical dysplasia. Brain Res 1046: 10–23 [DOI] [PubMed] [Google Scholar]
- 53. Li Z, Hall AM, Kelinske M, Roberson ED (2014) Seizure resistance without parkinsonism in aged mice after tau reduction. Neurobiol Aging 35: 2617–2624 [DOI] [PMC free article] [PubMed] [Google Scholar]
- 54. Xu CS, Liu AC, Chen J, Pan ZY, Wan Q, Li ZQ, Wang ZF (2015) Overactivation of NR2B‐containing NMDA receptors through entorhinal‐hippocampal connection initiates accumulation of hyperphosphorylated tau in rat hippocampus after transient middle cerebral artery occlusion (MCAO). J Neurochem 134: 566–577 [DOI] [PubMed] [Google Scholar]
- 55. Van der Jeugd A, Hochgrafe K, Ahmed T, Decker JM, Sydow A, Hofmann A, Wu D, Messing L, Balschun D, D'Hooge R et al (2012) Cognitive defects are reversible in inducible mice expressing pro‐aggregant full‐length human Tau. Acta Neuropathol 123: 787–805 [DOI] [PMC free article] [PubMed] [Google Scholar]
- 56. Sydow A, Van der Jeugd A, Zheng F, Ahmed T, Balschun D, Petrova O, Drexler D, Zhou L, Rune G, Mandelkow E et al (2011) Tau‐induced defects in synaptic plasticity, learning, and memory are reversible in transgenic mice after switching off the toxic Tau mutant. J Neurosci 31: 2511–2525 [DOI] [PMC free article] [PubMed] [Google Scholar]
- 57. Furukawa K, Wang Y, Yao PJ, Fu W, Mattson MP, Itoyama Y, Onodera H, D'Souza I, Poorkaj PH, Bird TD et al (2003) Alteration in calcium channel properties is responsible for the neurotoxic action of a familial frontotemporal dementia tau mutation. J Neurochem 87: 427–436 [DOI] [PubMed] [Google Scholar]
- 58. Vossel KA, Beagle AJ, Rabinovici GD, Shu H, Lee SE, Naasan G, Hegde M, Cornes SB, Henry ML, Nelson AB et al (2013) Seizures and epileptiform activity in the early stages of Alzheimer disease. JAMA Neurol 70: 1158–1166 [DOI] [PMC free article] [PubMed] [Google Scholar]
- 59. Ruan YW, Lei Z, Fan Y, Zou B, Xu ZC (2009) Diversity and fluctuation of spine morphology in CA1 pyramidal neurons after transient global ischemia. J Neurosci Res 87: 61–68 [DOI] [PubMed] [Google Scholar]
- 60. Bano D, Young KW, Guerin CJ, Lefeuvre R, Rothwell NJ, Naldini L, Rizzuto R, Carafoli E, Nicotera P (2005) Cleavage of the plasma membrane Na+/Ca2+ exchanger in excitotoxicity. Cell 120: 275–285 [DOI] [PubMed] [Google Scholar]
- 61. Fong H, Wang C, Knoferle J, Walker D, Balestra ME, Tong LM, Leung L, Ring KL, Seeley WW, Karydas A et al (2013) Genetic correction of tauopathy phenotypes in neurons derived from human induced pluripotent stem cells. Stem Cell Reports 1: 226–234 [DOI] [PMC free article] [PubMed] [Google Scholar]
- 62. Roberson ED, Scearce‐Levie K, Palop JJ, Yan F, Cheng IH, Wu T, Gerstein H, Yu GQ, Mucke L (2007) Reducing endogenous tau ameliorates amyloid beta‐induced deficits in an Alzheimer's disease mouse model. Science 316: 750–754 [DOI] [PubMed] [Google Scholar]
- 63. Masliah E, Alford M, Mallory M, Rockenstein E, Moechars D, Van Leuven F (2000) Abnormal glutamate transport function in mutant amyloid precursor protein transgenic mice. Exp Neurol 163: 381–387 [DOI] [PubMed] [Google Scholar]
- 64. Rothstein JD, Van Kammen M, Levey AI, Martin LJ, Kuncl RW (1995) Selective loss of glial glutamate transporter GLT‐1 in amyotrophic lateral sclerosis. Ann Neurol 38: 73–84 [DOI] [PubMed] [Google Scholar]
- 65. Untergasser A, Nijveen H, Rao X, Bisseling T, Geurts R, Leunissen JA (2007) Primer3Plus, an enhanced web interface to Primer3. Nucleic Acids Res 35: W71–W74 [DOI] [PMC free article] [PubMed] [Google Scholar]
- 66. Vandesompele J, De Preter K, Pattyn F, Poppe B, Van Roy N, De Paepe A, Speleman F (2002) Accurate normalization of real‐time quantitative RT‐PCR data by geometric averaging of multiple internal control genes. Genome Biol 3: RESEARCH0034 [DOI] [PMC free article] [PubMed] [Google Scholar]
- 67. Ramakers C, Ruijter JM, Deprez RH, Moorman AF (2003) Assumption‐free analysis of quantitative real‐time polymerase chain reaction (PCR) data. Neurosci Lett 339: 62–66 [DOI] [PubMed] [Google Scholar]
- 68. Braak H, Braak E (1991) Neuropathological stageing of Alzheimer‐related changes. Acta Neuropathol 82: 239–259 [DOI] [PubMed] [Google Scholar]
- 69. Siskova Z, Page A, O'Connor V, Perry VH (2009) Degenerating synaptic boutons in prion disease: microglia activation without synaptic stripping. Am J Pathol 175: 1610–1621 [DOI] [PMC free article] [PubMed] [Google Scholar]
- 70. Glaser EM, Van der Loos H (1981) Analysis of thick brain sections by obverse‐reverse computer microscopy: application of a new, high clarity Golgi‐Nissl stain. J Neurosci Methods 4: 117–125 [DOI] [PubMed] [Google Scholar]
- 71. Ricobaraza A, Cuadrado‐Tejedor M, Marco S, Perez‐Otano I, Garcia‐Osta A (2012) Phenylbutyrate rescues dendritic spine loss associated with memory deficits in a mouse model of Alzheimer disease. Hippocampus 22: 1040–1050 [DOI] [PubMed] [Google Scholar]
- 72. Stoppini L, Buchs PA, Muller D (1991) A simple method for organotypic cultures of nervous tissue. J Neurosci Methods 37: 173–182 [DOI] [PubMed] [Google Scholar]
- 73. Grynkiewicz G, Poenie M, Tsien RY (1985) A new generation of Ca2+ indicators with greatly improved fluorescence properties. J Biol Chem 260: 3440–3450 [PubMed] [Google Scholar]
- 74. Behrens CJ, van den Boom LP, de Hoz L, Friedman A, Heinemann U (2005) Induction of sharp wave‐ripple complexes in vitro and reorganization of hippocampal networks. Nat Neurosci 8: 1560–1567 [DOI] [PubMed] [Google Scholar]
Associated Data
This section collects any data citations, data availability statements, or supplementary materials included in this article.
Supplementary Materials
Expanded View Figures PDF
Table EV1
Review Process File