Abstract
In a Wall Street Journal article published on April 5, 2013, E. O. Wilson attempted to make the case that biologists do not really need to learn any mathematics—whenever they run into difficulty with numerical issues, they can find a technician (aka mathematician) to help them out of their difficulty. He formalizes this in Wilsons Principle No. 1: “It is far easier for scientists to acquire needed collaboration from mathematicians and statisticians than it is for mathematicians and statisticians to find scientists able to make use of their equations.” This reflects a complete misunderstanding of the role of mathematics in all sciences throughout history. To Wilson, mathematics is mere number crunching, but as Galileo said long ago, “The laws of Nature are written in the language of mathematics…the symbols are triangles, circles and other geometrical figures, without whose help it is impossible to comprehend a single word.” Mathematics has moved beyond the geometry-based model of Galileo’s time, and in a rebuttal to Wilson, E. Frenkel has pointed out the role of mathematics in synthesizing the general principles in science (Both point and counter-point are available in Wilson and Frenkel in Notices Am Math Soc 60(7):837–838, 2013). We will take this a step further and show how mathematics has been used to make new and experimentally verified discoveries in developmental biology and how mathematics is essential for understanding a problem that has puzzled experimentalists for decades—that of how organisms can scale in size. Mathematical analysis alone cannot “solve” these problems since the validation lies at the molecular level, but conversely, a growing number of questions in biology cannot be solved without mathematical analysis and modeling. Herein, we discuss a few examples of the productive intercourse between mathematics and biology.
1 Introduction
Development of an organism such as a human that contains many interacting components involves numerous complex processes, including signal transduction, gene expression, pattern formation, transport of material, growth, and mechanical forces, and thus, it is not surprising that mathematical models and analysis have played a role in understanding development. For example, D’Arcy Thompson’s classic work on the characterization of growth and form in terms of physical forces and mechanics sought general principles or rules to explain how variations in the form of different organisms could be understood (Thompson 1942). This work did not lead to testable predictions, but such conceptual models made significant contributions to the language and interpretation of mechanical aspects of developmental events, the understanding of which is still a major focus of current research. Early work on pattern formation by Child and others introduced the notion of developmental fields, and while not explicitly formulated in mathematical terms, the underlying basis was similar to the role of fields in physics and influenced thinking about development for some time (Child 1941).
In the context of pattern formation, the spatial distribution of extracellular state variables to which the cells in a developing tissue respond is called the morphogenetic landscape, and when the signals are diffusible molecules that affect the internal state in a concentration-dependent manner, they are called morphogens, a term coined by the British mathematician Alan Turing (Turing 1952). Currently, morphogens are defined as secreted signaling molecules that (i) are produced in a restricted portion of a tissue, (ii) are transported by diffusion (Lander et al. 2002), active transport, relay mechanisms, or other means to the remainder of the tissue (Kerszberg and Wolpert 1998), (iii) are detected by specific receptors or bind to regulatory regions of DNA, and (iv) initiate an intracellular signal transduction cascade that initiates or terminates the expression of target genes in a concentration-dependent manner.
The first morphogen-based mathematical theory of how patterns in biology can arise is due to Turing, who demonstrated that suitable interactions between reacting and diffusing chemical species could lead to stable spatial patterns that emerge from an unstable state. To understand this in a simple context, consider a one-dimensional ring of cells or a two-dimensional sheet of cells and suppose that all cells are initially in similar chemical states. The question then is under what conditions a spatial pattern of the reactants will arise spontaneously in the tissue. Turing showed that the uniform state can be unstable to some nonuniform disturbances if the kinetic interactions and the diffusion constants are chosen appropriately, and that such instabilities, which Turing called symmetry-breaking, can lead to a steady or a time-periodic spatially nonuniform distribution of morphogens. In Turing’s mechanism, the intrinsic scale of the pattern, called a ‘chemical wavelength’, is set by the diffusion coefficients and the reaction rates. An early criticism of Turing’s scheme was that biological systems generally do not evolve from uniformity to pattern, but rather from one pattern to another (Waddington 1952), as Turing himself observed in stating that ‘most of an organism, most of the time, is developing from one pattern into another, rather than from homogeneity into a pattern’ (Turing 1952). While there is as yet no firmly established example of a Turing mechanism in the context of biological pattern formation, it has been invoked to explain numerous mammalian coat patterns (Murray 1993), the patterns of pigmentation on certain species of fish and sea shells (Maini 2004), and more recently, it has been suggested that the patterning of the ridges on the roof of the mouse mouth may also involve a Turing mechanism (Pantalacci et al. 2009). Whether or not a system that generates biological pattern in a developmental context via a Turing mechanism is identified, Turing’s theory has had an enormous impact by demonstrating that it is necessary to understand the interactions of the processes that are involved, and not only their characteristics in isolation.
That systems evolve from one pattern to another is frequently manifested by the presence of specialized cells in some regions of the tissue, often at the boundary, and the definition of a morphogen now includes this localization. Such cells break the symmetry of a domain and can provide preferred directions to guide development. The concept of positional information (PI), which developed from the earlier field theories due to Child and others, was developed by Wolpert (1969) to formalize this idea. The PI theory postulates that a cell ‘knows’ its position by sampling its environment and modifies its downstream interpretation based on that information. If the spatial distribution of the external signal is nonuniform, this can lead to a spatial pattern in the tissue. This explicitly addresses Waddington’s criticism of Turing models, in that, the nth stage of patterning is based on gene expression or morphogen production in the (n − 1)st stage. An example described in more detail later is embryonic patterning in Drosophila. PI models and their descendants have been more widely used than Turing models because the systems for which detailed molecular schemes for the detection, transduction, and response of a cell to its position in the morphogenetic landscape are known are those with localized morphogen sources that drive pattern formation.
The French flag model, in which a one-dimensional domain is divided into three equal parts by a diffusible signal that originates at one boundary, serves as a paradigm of a reaction–diffusion mechanism for morphogen-mediated spatial patterning based on a PI model. It has been built upon to study the effects of other mechanisms, such as (i) dynamic pattern interpretation (Bergmann et al. 2007; Jaeger et al. 2004; Nahmad and Stathopoulos 2009; Tucker et al. 2008; Umulis 2009; Umulis et al. 2010; Wartlick et al. 2011a); (ii) feed-forward and feedback-mediated regulation, where cells no longer act as naive responders to an extracellular signal and instead modify both their own interpretation of the signal and the signal levels of other cells in the tissue (Umulis and Othmer 2012; Wang et al. 2010; Jaeger et al. 2004; Umulis et al. 2010; Ben-Zvi et al. 2011, 2008; Gregor et al. 2007; Harris et al. 2011; Janssens et al. 2006; Perkins et al. 2006; Umulis et al. 2009); and (iii) the interrelationship between growth and patterning (Aegerter-Wilmsen et al. 2007, 2010; Nahmad and Stathopoulos 2009; Wartlick et al. 2011a, b; Wartlick and González-Gaitán 2011).
Both of these early mathematical models preceded direct evidence for morphogens, yet they shaped the language and approach to identifying morphogens in developing organisms. While it is clear that these mathematical abstractions have changed how biologists think about pattern formation, more recent use of models has evolved from providing abstract concepts to a more applied science in which models are used as tools in conjunction with other methods to understand patterning mechanisms. Throughout the remainder of this paper, we will cover both types of contributions to modeling by discussing examples of how modeling is being used as a tool to dissect function and mechanism in biology. Specifically, we consider the role of modeling in (1) addressing new questions of robustness and scaling in Drosophila embryos, (2) integrating complex phenomena of signaling and tissue growth in the Drosophila wing disc, and (3) interpreting and designing experiments (Cv-2 in the pupal wing). Lastly, we provide perspective on how models provide an efficient tool to dissect signaling and gene control networks.
2 A Fundamental Question: What Confers Robustness of Patterning Processes?
The early Turing and PI models simply asked how patterns might be formed in developing systems, but Waddington and others had long before this recognized that development was typically insensitive to a certain level of perturbations in the environment or internal state. Waddington formalized this as the concept of canalization, by asserting that developmental reactions, as they occur in organisms submitted to natural selection, are in general canalized. That is to say, they are adjusted so as to bring about one definite end-result regardless of minor variations in conditions during the course of the reactions (Waddington 1942). Currently, canalization reflects what is called robustness or resilience of the system, which we define as follows. A component, system or process, is robust with respect to a given class of perturbations if its output or response is unchanged to within some tolerance by these perturbations, i.e., if the system is unlikely to ‘fail’ in the face of these perturbations (Lander et al. 2009; Umulis et al. 2008; Kang et al. 2012). The perturbations can be in the inputs to the component, system or process, or they can be perturbations or alterations in the internal structure of the component or system. Explicit in this definition is that robustness can be defined at many different levels, that it can only be defined with respect to a specified class of perturbations of the inputs or internal structure, and that a system may be robust even if it contains nonrobust components. Conversely, a system comprised of robust components need not be robust itself. In the developmental context, the system might be an entire developing embryo, or a portion thereof, the output could be the expression of a certain gene, the spatial pattern of tissue types, etc., and the perturbations might be knockouts or over-expression of an upstream gene, the removal of a portion of the system, a mutation that interferes with a signal transduction pathway, variations in the amount of cellular constituents received at division time, and so on. One aspect of the robustness of patterning is how well the patterning system adapts to changes in the size of the system, and when it adapts the intrinsic scale of the patterning to the size of the system, we say that patterning is scale-invariant.
A two-dimensional metaphor for scale-invariance is that a basic pattern dictated by the intrinsic scale is inscribed on a rubber sheet, and the sheet is then stretched isometrically to the final desired size, thus producing a scale-invariant pattern. This is an example of what is known as allometric scaling, which involves size-related correlations between different characteristics of a system (reviewed in Shingleton et al. 2007). Such correlations, which occur both within a species and between species, are usually described by a scaling law of the form
In developing systems, one can identify X as a characteristic geometric measure, such as the length of a system, and Y as the characteristic scale of a pattern of gene expression during development. The pattern scales perfectly with the measure of system size when α = 1, and we call this isometric scaling. In reality, systems are three dimensional, and a single measure of size may not suffice.
2.1 Scaling in Reaction–Diffusion Equations
A simple example will illustrate the essential ideas—specific application to patterning in Drosophila will be treated later, and further discussion of the theoretical background is given in (Umulis 2009; Othmer and Pate 1980; Umulis and Othmer 2013). Suppose that the spatial domain is the interval [0, L], that transport is via diffusion only, and that there is an input flux at x = 0. To simplify notation, we suppose that ci is a morphogen and denote its concentration by m. Then, its evolution is governed by
| (1) |
with the boundary and initial conditions
where κ is a characteristic reaction rate and κ−1 is a characteristic time scale factor for the reactions that involve m.
To understand scaling of the solution, we choose a time scale T, we define the dimensionless time and space variables
and we rewrite the equations in terms of these variables. To simplify the discussion, assume that Dm is independent of position but can vary due to dependence on a spatially uniform factor. The resulting equations are
| (2) |
with the boundary and initial conditions
These equations contain dimensionless groups that affect the solution, and the length of the system appears in some of these. The solution m(ξ, τ) of the rescaled equations will be scale-invariant only if there is no explicit dependence on L in these equations. There are two cases that arise, depending on whether or not the input flux j vanishes.
-
if j = 0, then there are two dimensionless groups,
the first, a dimensionless reaction time scale; the second, a dimensionless diffusion coefficient. When the first is large compared with the second, the reactions are fast compared with diffusion and conversely when it is small. The morphogen pattern will be independent of the system size if these groups are independent of L, and in general, the different ways in which this can be achieved are as follows.
Fix the characteristic rate κ, measure time on this scale by choosing T = κ−1 and modulate Dm ∝ L2
Choose T = κ−1, modulate κ ∝ L−2, and fix Dm
-
Any combination of modulating Dm and κ to make
L-independent
Thus, a Turing mechanism can be made scale-invariant by suitably modulating the characteristic diffusion and/or reaction rates.
-
if j ≠ 0, then there are three dimensionless groups
and each of these must be modulated, so that they are L-independent. Again there are several ways in which this can be achieved.
For example, one can fix κ, choose T = κ−1, and modulate Dm ∝ L2, j ∝ L.
Another possible strategy is to fix Dm, choose T = κ−1, modulate κ ∝ L−2, and modulate the input flux j ∝ L−1.
More generally, any combination of modulation that makes the dimensionless groups independent of L will lead to scale-invariance. A balanced modulation of transport and reaction, in which Dm ∝ L and κ ∝ L−1, may be optimal, in that, no scaling of the input flux is required, as is seen from the second form of the dimensionless flux J.
In effect, scale-invariance of the spatial pattern can be achieved by speeding up diffusion, slowing the reaction, increasing or decreasing the input flux, or some combination of these (Othmer and Pate 1980). This could occur through an evolutionary process that results in modification of the intrinsic properties of the morphogen itself, or some other factor may be used to modulate the transport or reaction characteristics suitably, and how this might be done is discussed later and is reviewed in Umulis and Othmer (2013). It should be noted that modulation of the diffusion coefficient or the input flux does not affect the time scale for the evolution of the spatial profile, whereas modulation of the reaction time scale does, and the latter may limit the applicability of this strategy in rapidly developing systems. Furthermore, while the above discussion is presented for a single species, it applies equally well to systems containing other species in the patterning scheme, but now one must identify a scaling factor for all diffusion coefficients and a single factor for all reactions, if the pattern of all species is to be scale-invariant. However, in reality, not all species can scale perfectly—at least, one must serve as a ‘size-sensor’.
The size sensing needed to produce scale-invariance can be effected by introducing a modulator M that modulates reaction and transport characteristics. We consider the single species example discussed at (1) and now add a separate equation for the evolution of M.
| (3) |
| (4) |
| (5) |
with the boundary conditions on the morphogen as before
Two variations of this have been used, depending on whether or not the evolution of the modulator depends on the concentration of the morphogen. The first case is called active modulation, whereas the second is called passive modulation. The boundary conditions on the modulator M are specific to the type of modulation. In passive modulation, one choice is to set the concentration of the modulator to be zero on the boundary, and then the level sets of the modulator reflect the distance of a point in the domain to the boundary, irrespective of the spatial dimension.
3 Discovering Mechanisms: Patterning in the Drosophila Embryo
The common fruit fly Drosophila melanogaster serves as a model system for studying many aspects of development because it is easy to grow, it has a short life cycle, the genome has been sequenced, and many mutants are known. Two phases of development, the early embryonic phase and the larval phase, are particularly well characterized, and mathematical modeling has made a number of contributions to understand the characteristics of pattern formation in both phases. The embryonic phase is discussed in this section and the wing disc in the following section.
Bicoid, which is involved in early anterior–posterior (AP) patterning of Drosophila, was the first morphogen to be discovered (Driever and Nüsslein-Volhard 1988), and this occurred 35 years after Turing’s definition of the term. Shortly thereafter, the bone morphogenetic protein (BMP) homolog decapentaplegic (Dpp) was identified as a molecule that functioned as a morphogen to pattern the dorsal–ventral (DV) embryonic axis and the anterior-posterior axis of the wing imaginal disk, a primordial tissue that develops into an adult wing (Irish and Gelbart 1987; Nellen et al. 1994). All of these pathways provide substantial evidence of the back and forth between modeling and experiment that drives discovery forward. In the following section, we describe in greater detail how experiments have informed modeling and how modeling has informed experiments in the context of BMP patterning of the dorsal ectoderm in Drosophila.
3.1 How Morphogens are Localized at the Dorsal Midline
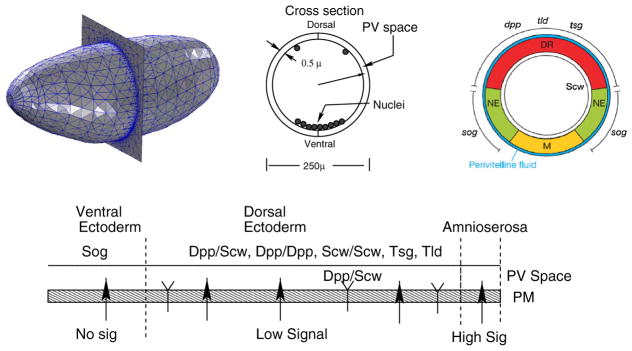
In the Drosophila embryo, the morphogens Dpp and Screw (Scw) are tightly regulated by a cohort of intra- and extracellular components to form a strip of BMP signaling localized at the dorsal-most 10 % of the embryo, called the amnioserosa (reviewed in O’Connor et al. 2006). The localization of highest BMP signaling, measured by the phosphorylation of the intracellular molecule Mad to form pMad, is regulated by the secreted factors short gastrulation (Sog), twisted gastrulation (Tsg), crossveinless-2 (Cv-2), the metalloprotease Tolloid (Tld), and other factors including type-IV collagen. Sog is a BMP inhibitor that binds to the heterodimer of Dpp/Scw to block its ability to bind to receptors. Sog is secreted in the presumptive neuroectoderm that encompasses the lateral 40 % of the embryo circumference (See Fig. 1) and therefore flanks the region of Dpp/Scw secretion in the dorsal-most 40 % of the embryo. Sog binds to dorsally secreted Tsg to form a more potent extracellular inhibitor of Dpp/Scw signaling than either Sog or Tsg alone. The flanking expression of Sog and the degradation of Sog by the Tld metalloprotease establishes a net flux of Dpp/Scw from an initial broad distribution into a narrow and tightly-regulated gradient. The free Dpp/Scw becomes most abundant in the dorsal midline region where it binds to two type-I receptors Thickvein (Tkv) and Saxophone (Sax) and two type-II receptors Punt. The binding of the ligand and formation of the heterotetrameric receptor signaling complex initiates phosphorylation of the intracellular transcription factor Mad to form pMad, which in turn binds to the cofactor Medea and regulates gene expression.
Fig. 1.
Embryo geometry and cross section at midway point between anterior and posterior of the embryo. Red dorsal region, green neuroectoderm, yellow mesoderm. The figure at bottom shows the distribution of extracellular component secretion
Mathematical models of the extracellular patterning network were developed and screened to identify the parameter regions in which the mechanism yielded output consistent with wild-type observations and was capable of achieving certain performance objectives (Lou et al. 2005; Eldar et al. 2002). Specifically, the model was screened to identify what type of biophysical requirements was needed to provide dorsally-localized stripe formation, and resilience of the spatial pattern to partial loss of Sog, Tld, or Scw protein, which would be expected in sog, tld, or scw heterozygous mutant embryos. The primary rationale underpinning the focus on networks that were insensitive to gene dosage was the idea that mechanisms must be robust or resilient to partial loss of function for important network components that might be encountered in diploid cells. The first study provided a number of testable predictions, including the following: (i) Dpp and Scw do not freely diffuse but can be shuttled by Sog, (ii) Sog cleavage by Tld only occurs if Sog is attached to either Dpp or Scw, and (iii) that Dpp and Scw patterning are decoupled by the cofactor Tsg. This work led to new experiments to test the range of Dpp diffusion by ectopic expression in a circumferential stripe along the AP axis driven by eve2, and these suggested that the range of Dpp was limited in the absence of Sog. However, other experiments provide evidence of a greater, Sog-independent range of Dpp (Mizutani et al. 1993; Wang and Ferguson 2005).
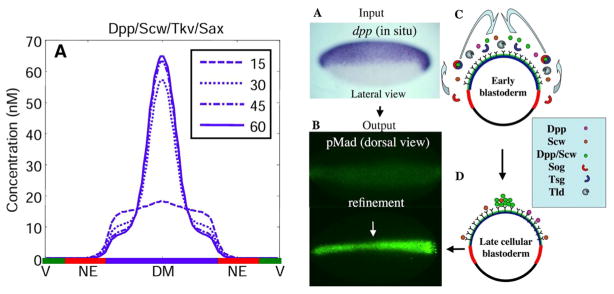
One aspect that was not an initial focus of the extracellular-only models is the differences between the model dynamics and the observed dynamics that show a contraction of the signaling distribution over time (Fig. 2) (Wang and Ferguson 2005; Umulis et al. 2006). While the models provided new questions and predictions regarding the extracellular environment, an experimental study at about the same time identified a requirement for intracellular signaling to feed back to support the dynamics and localization of extracellular Dpp. Specifically, Wang and Ferguson (2005) showed that if the intracellular cofactor Medea was knocked out, the pattern of high Dpp signaling and of extracellular Dpp localization did not refine or grow in intensity, causing a failure of dorsal surface patterning. This showed that feedback leads to both a refinement of the pMad pattern from a low broad region into a narrow, high-intensity stripe, and it leads to physical accumulation of Dpp in the extracellular space that co-localizes with the high-intensity signaling. This suggests that feedback modifies the ability of Dpp to accumulate near receptors and that the feedback is a necessary condition for dynamic refinement of Dpp signaling. While the experimental data pointed to the need for signaling-mediated feedback to regulate pattern formation of extracellular Dpp, the targets of the feedback were not known, and it was unclear how adding a feedback module would affect the overall patterning model.
Fig. 2.
a Early patterning models do not have significant gradient contraction with a continuous source of Dpp in the system. b In situ hybridization for the dpp input and the readout of high-intensity pMad. c Cartoon description of molecular flux to pattern the dorsal surface. Used by permission (O’Connor et al. 2006). d The distribution in late cycle 14 embryos
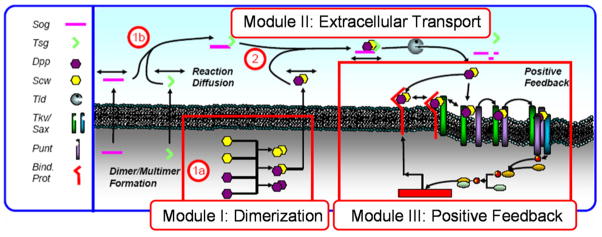
In parallel with the study identifying the role of feedback, Shimmi et al. identified the primary ligand as a heterodimer of Dpp and Scw and showed that the process of dimerization leads to robustness to perturbations in the amount of each individual ligand component produced by secreting cells (Shimmi et al. 2005). The combination of the dimer formation steps, the extracellular binding and transport steps, and the requirement for feedback by the receiving cells to dynamically regulate the highest levels of signaling prompted Umulis et al. to investigate the system as a sequence of interacting modules shown in Fig. 3. The structure shown there allows for analysis of the intra- and extracellular modules prior to integration into a full spatiotemporal patterning model (Umulis et al. 2006, 2008).
Fig. 3.
A modular description of the dorsal surface patterning model divides the system into three modules: dimerization, extracellular transport, and positive feedback
Module I: production of the dimers and other species and their secretion into the PV space
Module II: binding of Sog with Tsg, Dpp/Scw, cleavage by Tolloid, binding of Dpp/Scw to Tkv/Sax
Module III: signal transduction, transcription and translation, insertion of the surface binding protein into the membrane
The integrated mathematical description of the modules leads to a large system of reaction–diffusion equations, of which one is shown below and the remainder can be found in Umulis et al. (2010).
Here, B is the BMP ligand, C is a cofactor such as Cv-2, S is Sog, T is Tsg, Tld is Tolloid, R is the receptor, and letter pairs denote the complex formation.
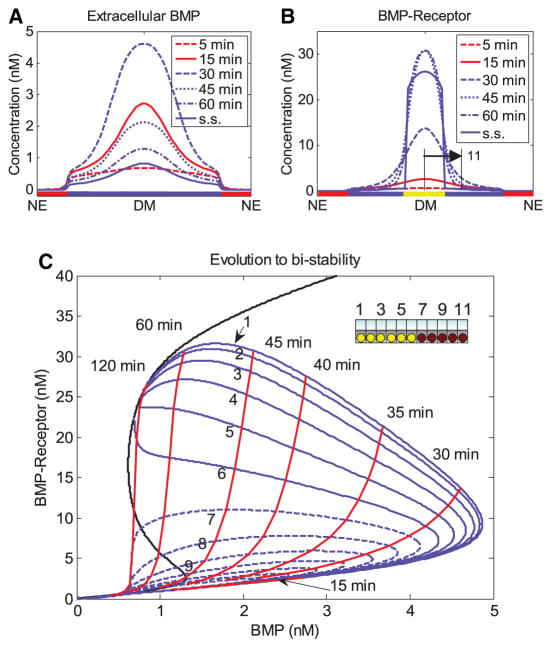
While early models focused on Module II, it is apparent that feedback between the modules could alter the dynamics of Module II and thus the entire patterning process, particularly the interactions between modules II and III. To understand how the feedback affects the dynamics, robustness, and scaling of patterning, and to identify potential targets of the signaling feedback, Umulis and colleagues developed 1D and 3D models of dorsal surface patterning with a number of different feedback motifs that ranged from enhancement of ligand–receptor interactions to modifying the rate of protease processing of Tld (Umulis et al. 2006, 2010). The most consistent models enhanced localization through feedback that produced a secreted factor that interacted with receptors or by targeting the receptor–ligand binding parameters themselves. A significant characteristic of the pMad evolution that was captured by inclusion of positive feedback that increased interactions between ligand and receptor by secreted Cv-2 was the dynamic evolution of the gradient from a broad, low-level distribution into a narrower and sharper profile, as shown in Fig. 4, and as is observed experimentally.
Fig. 4.
a Dynamics of free BMP in the presence of feedback that enhances receptor binding. b Dynamics of BMP-receptor levels leads to a stable population of high signaling states. c Dynamic evolution to equilibrium solution (black line) of individual cells labeled 1–9 for distance away from the dorsal midline. Cells 1–6 reach and maintain a high signaling state, whereas cells 7–9 revert back to the low signaling state. From Umulis et al. (2006) with permission
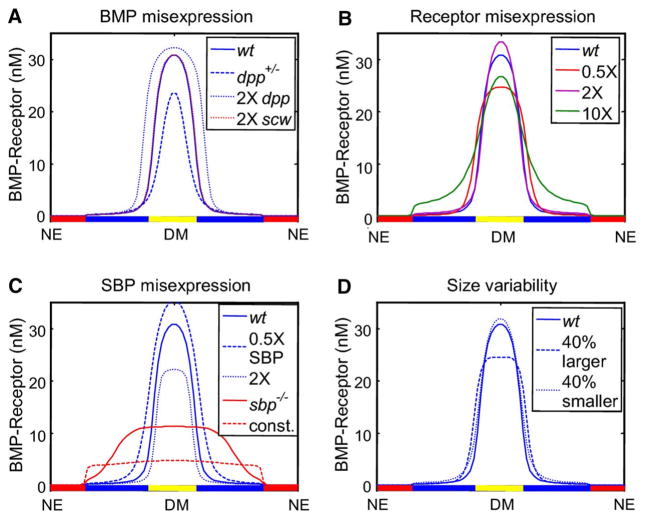
The dynamic contraction occurs in situations when the enhanced binding to receptors is coupled to receptor internalization and ligand decay. With the coupling of binding with enhanced decay as in Fig. 3, an intriguing, autocorrecting mechanism emerges that provides both robustness and proper dynamics as shown in Fig. 4a–c. In the 1D model with a secreted factor, such as Cv-2, that binds Dpp/Scw and regulates receptor interactions, feedback establishes a bistability in the local dynamics that separates the high signaling state from the low signaling state. The high signaling state also has a greater impact on removal of ligand since binding to receptor enhances the removal and degradation of Dpp/Scw from the system. When this module is coupled with the extracellular patterning module, this establishes a competitive environment for a limited amount of ligand. The most competitive cells dynamically evolve to the high signaling state (Fig. 4c) and simultaneously strip ligand from the system causing cells that are initially on a trajectory to the high signaling state to return to the low signaling state as time progresses. At steady state, the system only has the capacity to support a finite number of cells at the high signaling state for a given amount of ligand supplied, regardless of what the other factors are doing in the extracellular environment. This forces the extracellular level of ligand to drop to a lower state while the level of bound receptors is maintained (Fig. 4a, b). The self-limiting feedback promotes a strong canalization that is absent without the feedback. When the system is only capable of supporting a small population of high signaling cells, this imparts an automatic form of competitive robustness since the primary role of the extracellular module is to place cells in roughly the right region, and feedback provides the final step in the sorting process (Fig. 5).
Fig. 5.
a Resilience to changes in scw but sensitive to dpp. b System is insensitive to the level of excess or partial loss of Type-I receptor. c System is sensitive to feedback components missing, but is robust with respect to scale (d)
In other work on the same network, Karim et al. modeled the local receptor/ligand/ Cv-2 interactions and found that Cv-2 imparts signaling robustness to small levels of BMP ligand and overcomes the slow receptor dynamics, which leads to a high fidelity interpretation of the extracellular gradient over time (Karim et al. 2012). In this model, Cv-2 significantly reduces signaling noise, leading to a more reliable interpretation of position and a sharper, more reliable boundary. In an experimental study, Gavin-Smyth et al. investigated the role of Cv-2 in embryonic pattern formation and found that it works in concert with eiger (egr) to provide pattern canalization (Gavin-Smyth et al. 2013). In the absence of egr and cv-2, feedback is disrupted and embryos exhibit greater levels of variability in embryonic patterning. While more should be done both with mathematical modeling of the pathway and experimentally identifying the targets of the feedback that work in concert with egr, the back and forth between experiment and modeling will continue to provide new insights into how the system works, in particular how it copes with perturbations and external pressures.
3.2 Scaling of Dorsal Surface Patterning in the Embryo
As shown in Sect. 2, the mathematical requirements for scaling of reaction–diffusion equations are easily stated—either the rate of reactions that remove the morphogen must decrease or there has to be an increase in the diffusion constant as the system size increases. The patterning of the dorsal region by Dpp/Scw involves a nonlinear system of reaction diffusion equations for Module II, and scaling conditions are formally similar, but an implementation of the conditions is not known. Scaling could be ensured if a modulator species affected the extracellular reactions appropriately and encoded a component that is sensitive to scale or size. However, every component or step in the network may not have to scale perfectly, in which case scaling emerges as a feature of the connectivity, requiring further work to elucidate the particular mechanisms that provide the scaling. First, if we focus on reception of the signal in the absence of the primary inhibitor Sog, then the equations simplify to the following.
Two possible sources of scaling emerge in this system. If we assume rapid equilibrium and that reactions are far from saturation, and we then add the equations and scale space by L, we obtain
If we use the fact that RT = NT/(σ L2) and define , Λ = NT/(σ Km), we obtain
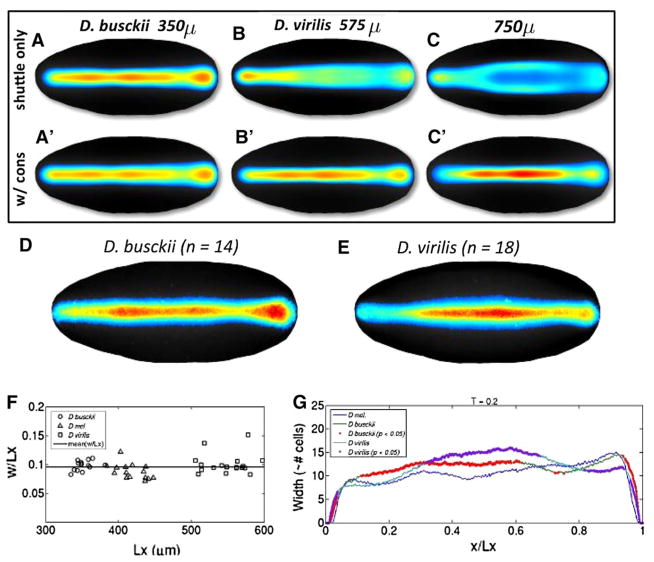
In this case, the steady state of free ligand scales perfectly but the concentration of bound receptors does not and cells would have to interpret signaling over a larger area. The other possibility of scaling emerges by closer inspection of the extracellular regulatory network. If all of the reactions that the ligand participates in were affected by a common modulator, then the reactions would increase or decrease in rate in accordance with the level of the modulator. It is not known whether such a modulator exists, but many known components act in a manner consistent with what can be expected of a modulator. For instance, the secreted factor Tsg is a molecule that increases the effectiveness of Sog binding to Dpp, increases the rate of Tld processing of Sog when complexed with Sog and Dpp, and has also been implicated in an increase of receptor binding. Modulation of Tsg or a molecule such as Tsg would alter numerous components in the network simultaneously in a way consistent with the modulation needed for scaling. Previously, we found that if receptor levels are conserved, the complete network yields scaling results consistent with observations (Fig. 6).
Fig. 6.
A Computational results for 3D patterning model without conservation of receptor levels (A–C) versus with receptor level conservation (A′–C′). D–G Experimental results for smaller (D. busckii and larger D. virilis embryos. Reprinted with permission of Dev. Cell
4 Progress Toward Integrating Patterning and Growth in the Drosophila Wing Disc
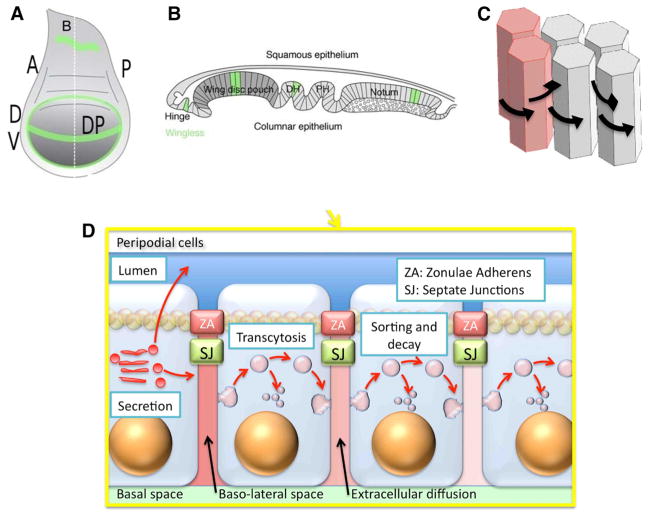
Mathematical modeling of Dpp patterning in the wing disc has also progressed in close collaboration with experimental developments, each informing the other to determine the mechanisms of growth and patterning. The Drosophila wing disc, which is the larval-stage progenitor of the adult wing, begins as a cluster of ~40 cells that are specified at the embryonic stage in response to wingless (Wg), the product of a segment polarity gene, and Dpp. Wg is expressed in a circumferential stripe anterior to a parasegment boundary [the gene network is analyzed in detail elsewhere (Albert and Othmer 2003)], and Dpp is expressed in an AP stripe generated by the DV patterning system described in the previous section. The intersection of these stripes defines the disc. By late third instar, a disc has ~50K cells and the disc pouch is ~150 μm (DV) × 300 μm (AP) (Held 2002) (Fig. 7). Discs are two-sided sacs comprising two layers separated by a lumen (Fig. 7b), a layer of columnar cells with their apical side at the lumen (Fig. 7d) and an overlying peripodial epithelium (Gibson et al. 2002). Columnar cells are connected by septate junctions and linked mechanically by a band of zonula adherens (ZAs). ZAs maintain the cell shape in the epithelium and divide the extracellular fluid into an apical layer and a basal layer, which probably only communicate via transmission of signals through the cells (Vincent and Dubois 2002).
Fig. 7.
a Geometry of a larval-stage wing disc (Widmann and Dahmann 2009)—A anterior, P posterior, D dorsal, V ventral, DP disc pouch. b Side view along B in (A), c the columnar cells. c, d transport processes that affect the Dpp distribution: diffusion in the around columnar cells (c) or transcytosis through columnar cells (d). From (Othmer et al. 2009) with permission
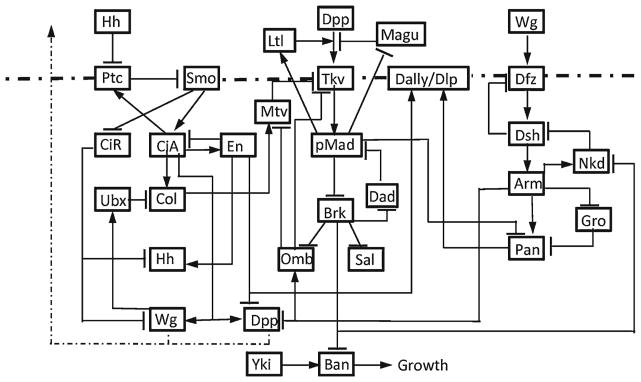
While relatively simple in structure, the wing disc requires tightly controlled mechanisms for reliable pattern formation and consistent growth—both within an individual to coordinate the growth of two wings, and between individuals that display a very high degree of reproducibility. The current understanding of the interaction network that regulates disc growth and patterning is summarized in Fig. 8, and the complexity of this network suggests that a mathematical model and computational analysis will be necessary to understand how it functions. In particular, the dynamic regulation that controls and coordinates the growth along multiple axes of the disc cannot be addressed without utilizing a mathematical model as a means of hypothesis testing and data integration. To more fully understand the biology of the problem and begin to see where modeling could impact the study of the system, it is helpful to first have an idea of how the disc grows and changes in response to the factors in Fig. 8.
Fig. 8.
The three major signaling pathways and their interactions in the wing disc. Ptc: patched, Smo: smoothened, CiA(R): cubitus interruptus activator (repressor), Ubx: ultrabithorax, Col: collier, Dfz: Drosophila frizzled, Dsh: disheveled, Nkd: naked, Gro: groucho, Pan: pangolin, Yki: Yorkie, Ban: bantam
The integration of outputs of the pathways shown in Fig. 8 across the disc determines the downstream effect of the entire network on the macroscopic growth and patterning of the disc, and how these are affected by various mutations, perturbations, and stresses. Patterning is inextricably linked with growth of the disc, the nature of transport in and around the cells, and the mechanisms of signal reception (Umulis and Othmer 2013). In normal development, growth is quite uniform in the disc; when sections are cut from an imaginal disc, adjacent cells grow and divide to produce a normal-sized disc, even when the injured disc is grown outside the developing larva. Such experiments have shown that the final size of a wing may be regulated within the structure itself, although external influences from the hormonal system convey information on the nutritional status of the entire organism. A major challenge in understanding growth control is how local pathways within discs and global pathways that function throughout the larva are balanced to produce normally proportioned organs and to prevent aberrant growth. Mathematical models can clearly play a role in understanding growth and patterning, firstly by analyzing the dynamics of individual cells given fixed inputs, and secondly, by properly describing the transport between cells to produce an integrated description of the disc dynamics. At present, we are far from this comprehensive description, but components have been studied, and we describe some of this work here. A more detailed exposition on how patterning can be made size-invariant in the wing disc and in other tissues appears elsewhere (Umulis and Othmer 2013).
4.1 Gradient Formation in the Wing Disc
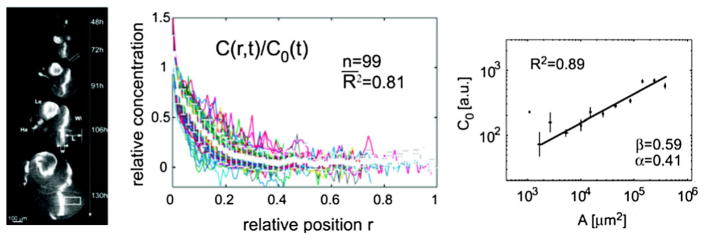
The dpp gene is expressed in medial cells between the anterior and posterior compartments and establishes a long-range, nearly exponential, distribution of Dpp in the posterior compartment (Fig. 9). The level of Dpp and Glass bottom boat (Gbb) sets the pattern of longitudinal veins and is involved in the regulation of tissue growth. Measurements of the gradient of a Dpp–GFP fusion protein shows that the gradient of Dpp does not scale perfectly—rather, the spatial distribution does but the amplitude does not (Wartlick et al. 2011a). As shown in Fig. 9, when concentrations are normalized by peak intensity, the profiles are essentially size-independent, but the amplitude of Dpp–GFP increases with time as the disc grows and the increase is strongly correlated with cell growth and division rates in the disc (Wartlick et al. 2011a). An increase in amplitude can be achieved by a reduction in the decay rate with a constant input flux, a balanced modulation of reaction and transport coupled with an increase in the input flux, or by a combination of flux, increasing with a decrease in the rate, but the observed power-law increase in amplitude shown in Fig. 9 cannot be explained by a decrease in reaction rates alone (Umulis and Othmer 2013). That requires modulation of the input flux with size, which is consistent with the observation that the width of the Dpp-expressing region expands with disc size (Wartlick et al. 2011a).
Fig. 9.
Scaling of the gradient of Dpp during growth of the wing imaginal disc is an example of dynamic scaling. Normalized profiles of Dpp–GFP from multiple time points (center) are shown at relative spatial positions. During growth, the amplitude of the morphogen gradient grows (right) in proportion to the length of the disc squared. Used by permission of AAAS (Science) (Wartlick et al. 2011a)
Studies of Dpp gradient formation in the wing disc have determined that the dynamics and shape of the Dpp gradient are consistent with nondirectional movement such as diffusion, but it is not clear whether Dpp spreads by diffusion around cells or by movement through cells in vesicles via a process called “transcytosis” (Entchev et al. 2000; Entchev and Gonzalez-Gaitan 2002; Belenkaya et al. 2002; Teleman and Cohen 2000). Transport by transcytosis requires extracellular diffusion, receptor binding, internalization, trafficking through the endocytic pathway, re-secretion of the receptor–ligand complex, and release from the receptor (Entchev and Gonzalez-Gaitan 2002) (Fig. 10). Theoretical studies of morphogen gradient formation question whether transcytosis could happen rapidly enough to form the gradient of Dpp during development, while others argue that simple diffusion models of Dpp cannot explain the unique signaling profiles generated around mutant clones in the wing disc (Lander et al. 2002).
Fig. 10.
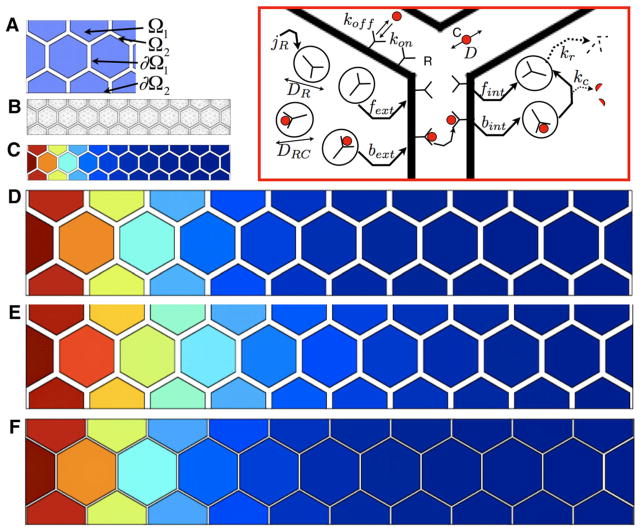
a The geometry labels for subdomains and boundaries for the hexagonally packed array of cells. b The mesh for the finite element analysis. c The relative level of the total number of receptors bound to ligand per cell (red is the maximum level set to 1 and blue is zero) for an array of ten cells that span 70 μ. d Results from (c) stretched out threefold to compare with computed solutions in (e) and (f). e Computed distribution of ligand if the geometry in (c) is uniformly scaled threefold. Note that the color mapping in (e) extends farther than the color profile in (d). f Same as (e), except now the distance between adjacent cell surfaces is equal to the spacing in (c). Note that the color mapping does indeed scale [compare (f) and (d)]
The geometry of the wing disc is complex, and diffusion occurs in a tortuous path surrounding hexagonally-packed columnar shaped cells (see Fig. 10). Diffusion along a tortuous path is slower than free diffusion due to an increase in the path length a molecule must travel to avoid obstacles. This “slowing” of diffusion can be estimated by Deff ≈ D/ω2, where ω is the geometric tortuosity representing the change in path length along a tortuous path versus free diffusion (Lander et al. 2002). In what follows, the analysis is broken up into two subsections: (i) analysis of diffusion around cells, and (ii) analysis of transcytosis through cells. Irrespective of the exact mechanism of Dpp transport, both transcytosis and extracellular diffusion lead to a system of partial differential equations with transport by diffusion and linear degradation (Bollenbach et al. 2005; Kicheva et al. 2007).
4.2 Anterior–Posterior Scaling
To determine conditions under which AP patterning of the disc is scale-invariant, the evolution equations describing the transport and kinetic steps for the species shown in Fig. 10 were developed and solved in an “ideal” 2D tissue composed of hexagonally-packed cells surround by an extracellular matrix (Fig. 10a). Our initial investigation into this pathway supposes that the receptor levels or binding rates are reduced as the tissue size increases to isolate the role of geometry. However, as discussed in more detail later, other mechanisms could produce similar results. The system of reaction–diffusion equations for the morphogen C, the receptor R, and various complexes is as follows. The subscript i denotes intracellular whereas the subscript s denotes cell surface.
| (6) |
| (7) |
| (8) |
| (9) |
| (10) |
| (11) |
| (12) |
| (13) |
In addition, the fluxes of C, RCi, and Ri are zero on ∂Ω2. The system was solved using the finite element method with a triangular mesh and quadratic basis functions (Fig. 10b). The transcytosis and extracellular diffusion models are represented in the same set of equations. For extracellular diffusion, the bext and fext terms are set equal to zero (i.e., no re-secretion) of receptors once endocytosed.
Solutions for a linear array of ten hexagonally packed cells are shown in Fig. 10c–f. The computed solution for a threefold increase length of the array is shown in Fig. 10e. For a direct dilation of the cells in Fig. 10c, the gap between cells, the linear distance in the x-direction, and the height of the cells increase proportionately, which leads to an increase in the extracellular volume that scales as L3, and the concentration gradient does not scale (compare Fig. 10d, e). If the intercellular spacing between adjacent cells remains constant, then the profile scales appropriately (compare Fig. 10c, f). In this situation, the volume surrounding the cells scales as L2 and perfect scale-invariance is achieved provided the total ligand production and total receptor number remain constant.
This demonstrates that when transport is by extracellular diffusion of ligand around hexagonally packed cells that grow uniformly in all directions, perfect scale-invariance occurs only if the intercellular gap remains fixed on an absolute full-dimensional scale, a very reasonable assumption in epithelial layers where cells are in direct contact with each other. If this condition is met, then the volume of extracellular diffusion scales as L2 and scale-invariance is automatic. If this condition is not met, then the space volume scales as L3 and the range of the ligand increases for increases in tissue size, as shown if Fig. 10e.
4.3 Transcytosis and Diffusion in Cells
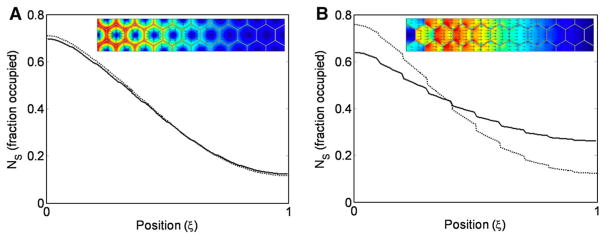
The foregoing establishes a sufficient condition for scale-invariance of the morphogen distribution, but since the nature of Dpp transport in the wing disc is not clear, we also investigated the effect of transcytosis on scaling. Figure 11a, b shows the diffusive flux and steady-state distribution of internalized Dpp bound to receptor for decreasing levels of re-secretion. Figure 11a show the diffusive flux and concentration profile when the rate of re-secretion is set to zero, and in Fig. 11b, the maximum level of re-secretion 1 μs−1 was calculated based on the rate at which a vesicle can move within a cell. The range of ligand decreases with decreased levels of transcytosis, consistent with the experiments in shi mutants. While transcytosis may increase the range of the ligand, it does not automatically lead to scale-invariance for changes in size in Fig. 11b. The principal reason scale-invariance by conservation of binding sites does not work with a transcytosis dominant process is because the diffusion volume scales as L3 instead of L2. If re-secretion is eliminated, scale-invariance is a property of the system as expected. Thus, if transcytosis is the dominant method of ligand transport, more complex regulatory mechanisms are required to ensure the preservation of proportion for changes in system size.
Fig. 11.
The diffusive flux of Dpp with transcytosis (inset) for lengths of 70 μ (left) and 210 μ (right). Scale-invariance results if transport occurs in the extracellular space as shown in Fig. 10, but would require additional regulatory mechanisms if transport is mediated by transcytosis
The foregoing shows that in the absence of transcytosis the AP pattern will scale with length if the total number of receptors remains constant as the tissue grows. However, there is no reason to suppose that this occurs in the literal sense, but an equivalent result can be achieved by other means consistent with the modulation mechanisms described earlier. A number of secreted species regulate the BMP activity gradient, including the glycoprotein Dally and a downstream target named pentagone (pent) (now called Magu) (Vuilleumier et al. 2010). Loss of the latter results in contraction of the pMad gradient and an increase in the pMad amplitude (Vuilleumier et al. 2010), consistent with Pent regulation of the range of Dpp activity. Pent interacts with Dally, presumably to modify access of Dpp to receptors, and, like dally expression, pent expression is repressed by Dpp signaling. It has also been shown that loss or ectopic over-expression of pent reduces scaling of the activity gradient and the distribution of downstream target genes in wing discs (Hamaratoglu et al. 2011; Ben-Zvi et al. 2011).
An active modulation mechanism based on Dpp, Tkv, Pent, and Dally has been proposed to explain the observed scaling of the Dpp distribution the wing disc (Ben-Zvi et al. 2011). In the model Dally and Pent serve as modulators of App activity, affecting both the diffusion coefficient of Dpp and the on-rate of Dpp to Tkv to different extents, depending on the postulated molecular function of Pent. In the model, Pent interacts with Dally and the combination of Dally and Dally–Pent increases the diffusion coefficient and decreases the rate of Dpp–Tkv binding (which leads to endocytosis and ligand destruction). Under the assumption of a uniform spatial distribution of Pent, the mechanism produces good scaling of the morphogen distribution with normalized concentration as reported (Ben-Zvi et al. 2011). However, the amplitude of the morphogen–receptor complex decreases, and this mechanism alone cannot account for the observed amplitude increases in the distribution and activity of Dpp–GFP. Thus, a comprehensive model to explain scale-invariance of AP patterning remains to be formulated.
4.4 Modeling to Bridge the In Vitro–In Vivo Gap: The Role of Cv-2 in Wing Vein Patterning
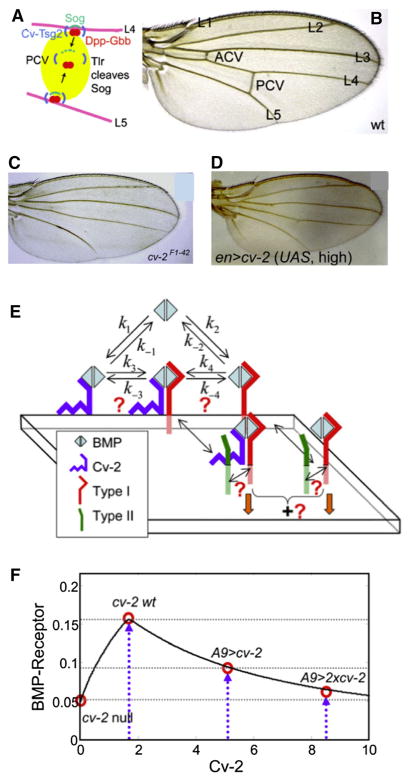
In addition to providing a means to identify mechanisms that contribute to scaling and robustness, models serve a very practical purpose in testing experiments and experimental conditions to learn new things. One example of the feedback between modeling and experiment occurred while identifying the mechanisms of Cv-2 action in the developing pupal wing in Drosophila. Adult wings display a stereotypical pattern of veins, the longitudinal veins (LV), and the anterior and posterior crossveins (ACV and PCV) (Fig. 12a). The spatial positioning of the veins involves several interacting signaling pathways that determine two alternative cell fates, vein and intervein (Celis and Diaz-Benjumea 2003). The LVs are specified by activation of MAPK signaling, mediated through the Egf receptor, and localized inhibition via the Notch/Delta pathway, beginning at third instar and continuing beyond pupariation (Blair 2007). Ectopic Dpp signaling can also induce vein formation in regions lacking high MAPK activity (Conley et al. 2000). Adjacent longitudinal veins are separated by broader intervein, and later during pupal wing development, the PCV forms between L4 and L5 LVs (Fig. 12a, b) (Serpe et al. 2008).
Fig. 12.
a A diagram of the PCV region between L4 and L5 during pupal wing development. b Wild-type wing. c Loss of cv-2 leads to no PCV formation. d Excess cv-2 blocks PCV formation. e The model network for Cv-2 interactions. f A typical output with kinetic parameters for Gbb leads to a biphasic dependence on the amount of Cv-2 present. From Serpe et al. (2008) with permission
The Dpp regulator acting in the wing to specify the posterior crossvein (PCV) is Cv-2. Intriguingly, in vivo evidence strongly supported a dual role for Cv-2 action in which Cv-2 is needed cell autonomously for high levels of BMP signaling. Loss of Cv-2 in the PCV region resulted in loss of crossvein formation, and over-expression of Cv-2 also led to a loss of the PCV (Fig. 12c, d). However, the same response could not be repeated in Drosophila S2 cell culture. In the cell-based signaling assays, Cv-2 was found to only inhibit Dpp signaling—loss of Cv-2 resulted in the greatest amount of signal. While the focus is typically on Dpp in the wing disc, another BMP ligand, Gbb, is also required for development and patterning. The biophysical rates of Dpp binding lead to very tight binding, whereas Gbb has somewhat lower affinity for the receptors.
To understand how interactions between Cv-2, BMPs and BMP receptors could generate a biphasic Cv-2 dose–response curve, we constructed a model that incorporates Cv-2 as a cell surface BMP binding molecule that participates in binding reactions with BMP ligands and receptors. The local dynamics for the general Cv-2 model incorporates BMP (B) binding to Cv-2 (C), BMP binding to receptor (R), and the transfer of bound BMP between the Cv-2 complex (BC) and the BMP-receptor complex (BR) through a transient BMP/Cv-2/receptor complex (BCR). We assume that all complexes are internalized at the same rate (Umulis et al. 2006). By analyzing the model response over a large range of parameter values, it was found that models with a lower affinity ligand, such as Gbb, were able to exhibit biphasic signaling behavior, whereas tight binding produced only inhibitory behavior (Serpe et al. 2008) (Fig. 12e, f). This suggested that if the in vitro experiments were carried out using Gbb instead of Dpp, it would be more likely to produce a biphasic signal response as the levels of Cv-2 were increased from zero. This was precisely what happened in cell culture and led to the unification of the mechanism for Cv-2 action that was consistent with both in vitro and in vivo data. In this case, the theoretical predictions pointed directly to the type of experiment that should be done.
5 Conclusions
5.1 The Utility of Mathematical Models in Biology
A common criticism encountered by those who develop mathematical models of biological systems is that because a model is incomplete in that it does not include all the factors at work, the results have little value. Of course, this is valid in some cases and silly in others. A blanket assumption that the lack of model completeness limits its value is akin to suggesting that all we learned from genetics was suddenly invalidated with the discoveries of miRNAs and epigenetic regulation. Clearly, it is worthwhile to carry out confirmatory experiments, and our study of genetics prior to the discoveries of more complex regulation continues to be very valuable. Moreover, the idea that a model is only valuable if it is correct in all aspects is clearly inconsistent with how similarly limited data in the rest of science is treated. In judging the value of a model and the mathematics underpinning it, one has to consider how the model was used initially: i.e., what question was the model built to address? If the questions are well constructed, the answers to those questions will likely not change, even if new components and interactions are added to our understanding at a later date. A beautiful example of how an ’incorrect’ model dramatically affected the way scientists think about pattern formation in development is the Turing model described earlier.
5.2 Directions for Future Modeling: How Mathematical Analysis can Point to New Experiments
As we described earlier for the wing disc, the mechanisms that persist as organisms evolve are usually robust and must function well in uncertain environments, and this frequently leads to complexity in the regulatory networks. One goal of genetic studies is to break networks piecewise to resolve the interactions between molecular species, but to resolve the roles of the complex network shown earlier that regulates wing disc patterning, multiple gene alterations must be made simultaneously. In light of the number of genes and the complexity of their interactions, one cannot rely on intuition alone in the design of experiments—rigorous methods based on mathematical models have to be applied to identify experiments that will have the greatest impact on our understanding of the regulatory network. For instance, if we considered a relatively simple disc growth and patterning model with eight components, each of which can have up to four different states: wilds type, over-expression, heterozygous loss of function, and homozygous loss of function, then a complete factorial design requires 48 or 65,536 experiments. This illustrates where models can be used to make predictions supporting experimental design to identify the regulatory components that drive network behavior.
Model-based optimal design of experiments (MBODE) is a rigorous approach to identify the best experiments within the limits on the types of experiments that are feasible. The rigorous mathematical approach of MBODE specifies which data should be collected to most effectively characterize the biological system under study (Kreutz and Timmer 2009; Bazil et al. 2012). To date, this quantitative approach has not been broadly applied in life science research, but we suggest that biologists should take advantage of these new tools and techniques. Specification of experimental variables that can be manipulated and their ranges as described above, and an indication of possible measurements for the algorithm to select among. Figure 13 illustrates the general algorithm and indicates the iterative process. That is, the newest MBODE is informed by all existing data including the most recently collected data. The MBODE strategy evolves by first reducing the number of models that differ in network structure (the core mechanisms) and then focuses on identifying the optimal parameters for model/data correspondence (Dinh et al. 2014; Donahue et al. 2010). Regardless of the objective, the MBODE algorithm specifies optimal experimental conditions that generates the “most informative” data. Experiments specifically addressing the comparison of multiple different hypotheses tested by MBODE will help to decipher the mechanisms of the system of interest and provide an informed roadmap for the experimental biologist to hone in on mechanism. Of course, the output of the MBODE algorithm should be used to guide experiments and should not be followed blindly. The old adage of “Garbage-In = Garbage-Out” also applies to the situation, wherein there is a tight link between the level and certainty of the information being provided the MBODE approach and the expectations for the output.
Fig. 13.
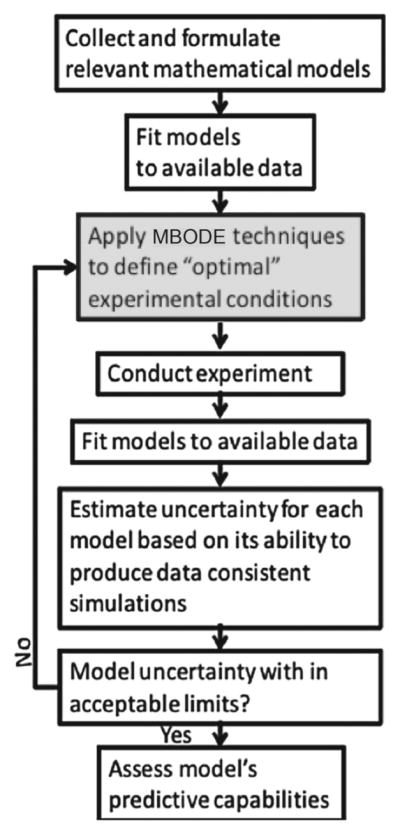
The sequence of steps in the application of the MBODE methodology
While the MBODE strategy has not yet been applied to the aforementioned systems, it has been applied to a related patterning event in the Drosophila germarium, which highlights the potential for this to impact other patterning studies. Pargett et al. put this approach into practice to identify the next set of information-rich experiments that should be conducted to determine the mechanisms of stem cell differentiation versus self-renewal decision making after cell division (Pargett et al. 2014). In this work, multiobjective optimization was first used to reduce the number of possible networks from 65,000 to 6 parsimonious networks that contained the core regulatory steps seen in the other networks. Following this, other interactions were included for untested components and MBODE was applied to identify the best experiments that would discriminate between the equivalent core networks. The output of this work provides a hierarchical list of the specific genetic crosses in Drosophila that should be carried out, as well as which components should be measured in dissected ovaries.
It is clear that modeling is leading to new discoveries and mathematical thinking has had tremendous impact in developmental biology for decades. As the networks continue to expand and the questions become more complex, biologists with additional training in mathematics will have a definitive advantage when it comes to addressing problems to delineate mechanism. While classical approaches will always be valuable to experimental inquiry, we propose that mathematical modeling is an equally important tool to drive experimental discovery.
Acknowledgments
Research supported in part by Grant # GM 29123 and HD 73156 from the National Institutes of Health.
Contributor Information
David M. Umulis, Agricultural and Biological Engineering, Weldon School of Biomedical Engineering, Purdue University, West Lafayette, IN 47907, USA
Hans G. Othmer, Email: othmer@math.umn.edu, School of Mathematics and Digital Technology Center, University of Minnesota, Minneapolis, MN 55455, USA
References
- Aegerter-Wilmsen T, Aegerter CM, Hafen E, Basler K. Model for the regulation of size in the wing imaginal disc of Drosophila. Mech Dev. 2007;124(4):318–326. doi: 10.1016/j.mod.2006.12.005. [DOI] [PubMed] [Google Scholar]
- Aegerter-Wilmsen T, Smith AC, Christen AJ, Aegerter CM, Hafen E, Basler K. Exploring the effects of mechanical feedback on epithelial topology. Development. 2010;137(3):499–506. doi: 10.1242/dev.041731. [DOI] [PubMed] [Google Scholar]
- Albert Réka, Othmer HG. The topology of the regulatory interactions predicts the expression pattern of the segment polarity genes in Drosophila melanogaster. J Theor Biol. 2003;223:1–18. doi: 10.1016/s0022-5193(03)00035-3. [DOI] [PMC free article] [PubMed] [Google Scholar]
- Bazil JN, Buzzard GT, Rundell AE. A global parallel model based design of experiments method to minimize model output uncertainty. Bull Math Biol. 2012;74(3):688–716. doi: 10.1007/s11538-011-9686-9. [DOI] [PubMed] [Google Scholar]
- Belenkaya TY, Han C, Standley HJ, Lin X, Houston DW, Heasman J, Lin X. pygopus Encodes a nuclear protein essential for wingless/Wnt signaling. Development. 2002;129(17):4089–4101. doi: 10.1242/dev.129.17.4089. [DOI] [PubMed] [Google Scholar]
- Ben-Zvi D, Shilo BZ, Fainsod A, Barkai N. Scaling of the BMP activation gradient in Xenopus embryos. Nature. 2008;453(7199):1205–1211. doi: 10.1038/nature07059. [DOI] [PubMed] [Google Scholar]
- Ben-Zvi D, Pyrowolakis G, Barkai N, Shilo BZ. Expansion–repression mechanism for scaling the Dpp activation gradient in Drosophila wing imaginal discs. Curr Biol. 2011;21:1391–1396. doi: 10.1016/j.cub.2011.07.015. [DOI] [PubMed] [Google Scholar]
- Bergmann S, Sandler O, Sberro H, Shnider S, Schejter E, BZ, Shilo BZ, Barkai N. Pre-steady-state decoding of the Bicoid morphogen gradient. PLoS Biol. 2007;5(2):e46. doi: 10.1371/journal.pbio.0050046. [DOI] [PMC free article] [PubMed] [Google Scholar]
- Blair SS. Wing vein patterning in Drosophila and the analysis of intercellular signaling. Ann Rev Cell Dev Biol. 2007;23:293–319. doi: 10.1146/annurev.cellbio.23.090506.123606. [DOI] [PubMed] [Google Scholar]
- Bollenbach T, Kruse K, Pantazis P, Gonzalez-Gaitan M, Julicher F. Robust formation of morphogen gradients. Phys Rev Lett. 2005;94(1):018103. doi: 10.1103/PhysRevLett.94.018103. [DOI] [PubMed] [Google Scholar]
- Child CM. Patterns and problems of development. University of Chicago press; Chicago: 1941. [Google Scholar]
- Conley CA, Silburn R, Singer MA, Ralston A, Rohwer-Nutter D, Olson DJ, Gelbart W, Blair SS. Crossveinless 2 contains cysteine-rich domains and is required for high levels of BMP-like activity during the formation of the cross veins in Drosophila. Development. 2000;127(18):3947–3959. doi: 10.1242/dev.127.18.3947. [DOI] [PubMed] [Google Scholar]
- de Celis JF, Diaz-Benjumea FJ. Developmental basis for vein pattern variations in insect wings. Int J Dev Biol. 2003;47(7–8):653–663. [PubMed] [Google Scholar]
- Dinh V, Rundell AE, Buzzard GT. Experimental design for dynamics identification of cellular processes. Bull Math Biol. 2014;76(3):597–626. doi: 10.1007/s11538-014-9935-9. [DOI] [PubMed] [Google Scholar]
- Donahue MM, Buzzard GT, Rundell AE. Experiment design through dynamical characterisation of non-linear systems biology models utilising sparse grids. IET Syst Biol. 2010;4(4):249–262. doi: 10.1049/iet-syb.2009.0031. [DOI] [PubMed] [Google Scholar]
- Driever W, Nüsslein-Volhard C. The bicoid protein determines position in the Drosophila embryo in a concentration-dependent manner. Cell. 1988;54(1):95–104. doi: 10.1016/0092-8674(88)90183-3. [DOI] [PubMed] [Google Scholar]
- Eldar A, Dorfman R, Weiss D, Ashe H, Shilo BZ, Barkai N. Robustness of the BMP morphogen gradient in Drosophila embryonic patterning. Nature. 2002;419(6904):304–308. doi: 10.1038/nature01061. [DOI] [PubMed] [Google Scholar]
- Entchev EV, Gonzalez-Gaitan MA. Morphogen gradient formation and vesicular trafficking. Traffic. 2002;3(2):98–109. doi: 10.1034/j.1600-0854.2002.030203.x. [DOI] [PubMed] [Google Scholar]
- Entchev EV, Schwabedissen A, Gonzalez-Gaitan M. Gradient formation of the TGF-beta homolog Dpp. Cell. 2000;103(6):981–91. doi: 10.1016/s0092-8674(00)00200-2. [DOI] [PubMed] [Google Scholar]
- Gavin-Smyth J, Wang YC, Butler I, Ferguson EL. A genetic network conferring canalization to a bistable patterning system in Drosophila. Curr Biol. 2013;23(22):2296–2302. doi: 10.1016/j.cub.2013.09.055. [DOI] [PMC free article] [PubMed] [Google Scholar]
- Gibson MC, Lehman DA, Schubiger G. Lumenal transmission of decapentaplegic in Drosophila imaginal discs. Dev Cell. 2002;3(3):451–60. doi: 10.1016/s1534-5807(02)00264-2. [DOI] [PubMed] [Google Scholar]
- Gregor T, Wieschaus EF, McGregor AP, Bialek W, Tank DW. Stability and nuclear dynamics of the bicoid morphogen gradient. Cell. 2007;130(1):141–152. doi: 10.1016/j.cell.2007.05.026. [DOI] [PMC free article] [PubMed] [Google Scholar]
- Hamaratoglu F, de Lachapelle AM, Pyrowolakis G, Bergmann S, Affolter M. Dpp signaling activity requires pentagone to scale with tissue size in the growing Drosophila wing imaginal disc. PLoS Biol. 2011;9(10):e1001182. doi: 10.1371/journal.pbio.1001182. [DOI] [PMC free article] [PubMed] [Google Scholar]
- Harris RE, Pargett M, Sutcliffe C, Umulis D, Ashe HL. Brat promotes stem cell differentiation via control of a bistable switch that restricts BMP signaling. Dev Cell. 2011;20(1):72–83. doi: 10.1016/j.devcel.2010.11.019. [DOI] [PMC free article] [PubMed] [Google Scholar]
- Held LI. Imaginal discs: the genetic and cellular logic of pattern formation. Cambridge University Press; Cambridge: 2002. [Google Scholar]
- Irish VF, Gelbart WM. The decapentaplegic gene is required for dorsal-ventral patterning of the Drosophila embryo. Genes Dev. 1987;1(8):868–879. doi: 10.1101/gad.1.8.868. [DOI] [PubMed] [Google Scholar]
- Jaeger J, Surkova S, Blagov M, Janssens H, Kosman D, Kozlov KN, Myasnikova E, Vanario-Alonso CE, Samsonova M, Sharp DH, Reinitz J. Dynamic control of positional information in the early Drosophila embryo. Nature. 2004;430(6997):368–371. doi: 10.1038/nature02678. [DOI] [PubMed] [Google Scholar]
- Janssens H, Hou S, Jaeger J, Kim A-R, Myasnikova E, Sharp D, Reinitz J. Quantitative and predictive model of transcriptional control of the Drosophila melanogaster even skipped gene. Nat Genet. 2006;38(10):1159–1165. doi: 10.1038/ng1886. (Epub 2006 Sep 17) [DOI] [PubMed] [Google Scholar]
- Kang HW, Zheng L, Othmer HG. The effect of the signalling scheme on the robustness of pattern formation in development. Interface Focus. 2012;2(4):465–486. doi: 10.1098/rsfs.2011.0116. [DOI] [PMC free article] [PubMed] [Google Scholar]
- Karim MS, Buzzard GT, Umulis DM. Secreted, receptor-associated bone morphogenetic protein regulators reduce stochastic noise intrinsic to many extracellular morphogen distributions. J R Soc Interface. 2012;9(70):1073–1083. doi: 10.1098/rsif.2011.0547. [DOI] [PMC free article] [PubMed] [Google Scholar]
- Kerszberg M, Wolpert L. Mechanisms for positional signalling by morphogen transport: a theoretical study. J Theor Biol. 1998;191:103–114. doi: 10.1006/jtbi.1997.0575. [DOI] [PubMed] [Google Scholar]
- Anna Kicheva, Periklis Pantazis, Tobias Bollenbach, Yannis Kalaidzidis, Thomas Bittig, Frank Julicher, Marcos Gonzalez-Gaitan. Kinetics of morphogen gradient formation. Science. 2007;315(5811):521–525. doi: 10.1126/science.1135774. [DOI] [PubMed] [Google Scholar]
- Kreutz C, Timmer J. Systems biology: experimental design. FEBS J. 2009;276(4):923–942. doi: 10.1111/j.1742-4658.2008.06843.x. [DOI] [PubMed] [Google Scholar]
- Lander AD, Nie Q, Wan FY. Do morphogen gradients arise by diffusion? Dev Cell. 2002;2(6):785–96. doi: 10.1016/s1534-5807(02)00179-x. [DOI] [PubMed] [Google Scholar]
- Lander AD, Lo W-C, Nie Q, Wan FYM. The measure of success: constraints, objectives, and tradeoffs in morphogen-mediated patterning. Cold Spring Harbor Perspect Biol. 2009;1(1):a002022. doi: 10.1101/cshperspect.a002022. [DOI] [PMC free article] [PubMed] [Google Scholar]
- Lou Y, Nie Q, Wan FYM. Effects of sog on Dpp-receptor binding. SIAM J Appl Math. 2005;65(5):1748–1771. doi: 10.1137/S0036139903433219. [DOI] [PMC free article] [PubMed] [Google Scholar]
- Maini PK. The impact of Turing’s work on pattern formation in biology. Math Today. 2004;40(4):140–141. [Google Scholar]
- Mizutani N, Watanabe T, Yoshida Y, Okabe N. Extraction of contour lines by identification of neighbor relationships on a Voronoi line graph. Syst Comput Jpn. 1993;24(1):57. [Google Scholar]
- Murray JD. Mathematical biology. 2. Springer; Berlin: 1993. [Google Scholar]
- Nahmad M, Stathopoulos A. Dynamic interpretation of hedgehog signaling in the Drosophila wing disc. PLoS Biol. 2009;7(9):e1000202. doi: 10.1371/journal.pbio.1000202. [DOI] [PMC free article] [PubMed] [Google Scholar]
- Nellen D, Affolter M, Basler K. Receptor serine/threonine kinases implicated in the control of Drosophila body pattern by decapentaplegic. Cell. 1994;78(2):225–237. doi: 10.1016/0092-8674(94)90293-3. [DOI] [PubMed] [Google Scholar]
- O’Connor MB, Umulis D, Othmer HG, Blair SS. Shaping BMP morphogen gradients in the Drosophila embryo and pupal wing. Development. 2006;133(2):183–193. doi: 10.1242/dev.02214. [DOI] [PMC free article] [PubMed] [Google Scholar]
- Othmer HG, Pate EF. Scale invariance in reaction–diffusion models of spatial pattern formation. Proc Natl Acad Sci. 1980;77:4180–4184. doi: 10.1073/pnas.77.7.4180. [DOI] [PMC free article] [PubMed] [Google Scholar]
- Othmer HG, Painter K, Umulis DM, Xue C. Mathematical models of pattern formation in biology. MMNP Morphog. 2009;4:3–79. doi: 10.1051/mmnp/20094401. [DOI] [PMC free article] [PubMed] [Google Scholar]
- Pantalacci S, Sémon M, Martin A, Chevret P, Laudet V. Heterochronic shifts explain variations in a sequentially developing repeated pattern: palatal ridges of muroid rodents. Evol Dev. 2009;11(4):422–433. doi: 10.1111/j.1525-142X.2009.00348.x. [DOI] [PubMed] [Google Scholar]
- Pargett M, Rundell AE, Buzzard GT, Umulis DM. Model-based analysis for qualitative data: an application in Drosophila germline stem cell regulation. PLoS Comput Biol. 2014;10(3):e1003498. doi: 10.1371/journal.pcbi.1003498. [DOI] [PMC free article] [PubMed] [Google Scholar]
- Perkins TJ, Jaeger J, Reinitz J, Glass L. Reverse engineering the gap gene network of Drosophila melanogaster. PLoS Comput Biol. 2006;2(5):0417–0428. doi: 10.1371/journal.pcbi.0020051. [DOI] [PMC free article] [PubMed] [Google Scholar]
- Serpe M, Umulis D, Ralston A, Chen J, Olson DJ, Avanesov A, Othmer H, O’Connor MB, Blair SS. The BMP-binding protein Crossveinless 2 is a short-range, concentration-dependent, biphasic modulator of BMP signaling in Drosophila. Dev Cell. 2008;14(June):940–953. doi: 10.1016/j.devcel.2008.03.023. [DOI] [PMC free article] [PubMed] [Google Scholar]
- Shimmi O, Umulis D, Othmer HG, O’Connor MB. Facilitated transport of a Dpp/Scw heterodimer by Sog/Tsg leads to robust patterning of the Drosophila blastoderm embryo. Cell. 2005;120(6):873–886. doi: 10.1016/j.cell.2005.02.009. [DOI] [PMC free article] [PubMed] [Google Scholar]
- Shingleton AW, Frankino WA, Flatt T, Nijhout HF, Emlen DJ. Size and shape: the developmental regulation of static allometry in insects. Bioessays. 2007;29(6):536–548. doi: 10.1002/bies.20584. [DOI] [PubMed] [Google Scholar]
- Teleman AU, Cohen SM. Dpp gradient formation in the Drosophila wing imaginal disc. Cell. 2000;103(6):971–980. doi: 10.1016/s0092-8674(00)00199-9. [DOI] [PubMed] [Google Scholar]
- Thompson D’AW. On growth and form. 2. Vol. 2. Cambridge University Press; Cambridge: 1942. [Google Scholar]
- Tucker JA, Mintzer KA, Mullins MC. The BMP signaling gradient patterns dorsoventral tissues in a temporally progressive manner along the anteroposterior axis. Dev Cell. 2008;14(1):108–119. doi: 10.1016/j.devcel.2007.11.004. [DOI] [PMC free article] [PubMed] [Google Scholar]
- Turing AM. The chemical basis of morphogenesis. Philos Trans R Soc Lond B. 1952;237:37–72. doi: 10.1098/rstb.2014.0218. [DOI] [PMC free article] [PubMed] [Google Scholar]
- Umulis D, O’Connor MB, Othmer HG. Robustness of embryonic spatial patterning in Drosophila melanogaster. Curr Top Dev Biol. 2008;81:65–111. doi: 10.1016/S0070-2153(07)81002-7. [DOI] [PMC free article] [PubMed] [Google Scholar]
- Umulis D, O’Connor MB, Blair SS. The extracellular regulation of bone morphogenetic protein signaling. Development. 2009;136(22):3715–3728. doi: 10.1242/dev.031534. [DOI] [PMC free article] [PubMed] [Google Scholar]
- Umulis DM. Analysis of dynamic morphogen scale-invariance. J R Soc Interface. 2009;6:1179–1191. doi: 10.1098/rsif.2009.0015. [DOI] [PMC free article] [PubMed] [Google Scholar]
- Umulis DM, Serpe M, O’Connor MB, Othmer HG. Robust, bistable patterning of the dorsal surface of the Drosophila embryo. Proc Natl Acad Sci USA. 2006;103(31):11613–11618. doi: 10.1073/pnas.0510398103. [DOI] [PMC free article] [PubMed] [Google Scholar]
- Umulis DM, Shimmi O, O’Connor MB, Othmer HG. Organism-scale modeling of early Drosophila patterning via bone morphogenetic proteins. Dev Cell. 2010;18(2):260–274. doi: 10.1016/j.devcel.2010.01.006. [DOI] [PMC free article] [PubMed] [Google Scholar]
- Umulis DM, Othmer HG. The importance of geometry in mathematical models of developing systems. Curr Opin Gen Dev. 2012;22(6):547–552. doi: 10.1016/j.gde.2012.09.007. [DOI] [PMC free article] [PubMed] [Google Scholar]
- Umulis DM, Othmer HG. Mechanisms of scaling in pattern formation. Development. 2013;140(24):4830–4843. doi: 10.1242/dev.100511. [DOI] [PMC free article] [PubMed] [Google Scholar]
- Vincent JP, Dubois L. Morphogen transport along epithelia, an integrated trafficking problem. Dev Cell. 2002;3(5):615–623. doi: 10.1016/s1534-5807(02)00323-4. [DOI] [PubMed] [Google Scholar]
- Vuilleumier R, Springhorn A, Patterson L, Koidl S, Hammerschmidt M, Affolter M, Pyrowolakis G. Control of Dpp morphogen signalling by a secreted feedback regulator. Nat Cell Biol. 2010;12(6):611–617. doi: 10.1038/ncb2064. [DOI] [PubMed] [Google Scholar]
- Waddington CH. Canalization of development and the inheritance of acquired characters. Nature. 1942;150(3811):563–565. [Google Scholar]
- Waddington CH. Letter from Waddington to Turing. The Turing Digital Archive. 1952 Sep AMT/D/5: 1TLS. [Google Scholar]
- Wang L, Xin J, Nie Q. A critical quantity for noise attenuation in feedback systems. PLoS Comput Biol. 2010;6(4):e1000764. doi: 10.1371/journal.pcbi.1000764. [DOI] [PMC free article] [PubMed] [Google Scholar]
- Wang YC, Ferguson EL. Spatial bistability of Dpp-receptor interactions during Drosophila dorsal–ventral patterning. Nature. 2005;434(7030):229–234. doi: 10.1038/nature03318. [DOI] [PubMed] [Google Scholar]
- Wartlick O, González-Gaitán M. The missing link: implementation of morphogenetic growth control on the cellular and molecular level. Curr Opin Genet Dev. 2011;21(6):690–695. doi: 10.1016/j.gde.2011.09.002. [DOI] [PubMed] [Google Scholar]
- Wartlick O, Mumcu P, Kicheva A, Bittig T, Seum C, Jülicher F, González-Gaitán M. Dynamics of Dpp signaling and proliferation control. Science. 2011a;331(6021):1154. doi: 10.1126/science.1200037. [DOI] [PubMed] [Google Scholar]
- Wartlick O, Mumcu P, Jülicher F, Gonzalez-Gaitan M. Understanding morphogenetic growth control—lessons from flies. Nat Rev Mol Cell Biol. 2011b;12(9):594–604. doi: 10.1038/nrm3169. [DOI] [PubMed] [Google Scholar]
- Widmann TJ, Dahmann C. Wingless signaling and the control of cell shape in Drosophila wing imaginal discs. Dev Biol. 2009;334(1):161–173. doi: 10.1016/j.ydbio.2009.07.013. [DOI] [PubMed] [Google Scholar]
- Wilson EO, Frenkel E. Opinion: two views: how much math do scientists need? Notices Am Math Soc. 2013;60(7):837–838. [Google Scholar]
- Wolpert L. Positional information and the spatial pattern of cellular differentiation. J Theor Biol. 1969;25:1–47. doi: 10.1016/s0022-5193(69)80016-0. [DOI] [PubMed] [Google Scholar]


