

Summary
Immunoglobulin E‐mediated allergy and certain autoimmune diseases are characterized by the presence of a T helper type 2 (Th2) immune response and allergen‐specific or self‐reactive IgE. Soluble CD23 (sCD23) is a B‐cell factor that fosters IgE class‐switching and synthesis, suggesting that sCD23 may be a therapeutic target for these pathologies. We produced a recombinant protein, CTLA4Fcε, by fusing the ectodomain of the immunoregulatory molecule cytotoxic T‐lymphocyte antigen 4 (CTLA‐4) with a fragment of the IgE H‐chain constant region. In SDS–PAGE/inmunoblot analyses, CTLA4Fcε appeared as a 70 000 MW polypeptide that forms homodimers. Flow cytometry showed that CTLA4Fcε binds to IgE receptors Fcε RI and Fcε RII/CD23, as well as to CTLA‐4 counter‐receptors CD80 and CD86. Binding of CTLA4Fcε to Fcε RII/CD23 appeared stronger than that of IgE. Since the cells used to study CD23 binding express CD80 and CD86, simultaneous binding of CTLA4Fcε to CD23 and CD80/CD86 seems to occur and would explain this difference. As measured by a human CD23‐specific ELISA, CTLA4Fcε – but not IgE – induced a concentration‐dependent reduction of sCD23 in culture supernatants of RPMI‐8866 cells. Our results suggest that the simultaneous binding of CTLA4Fcɛ to CD23‐CD80/CD86 may cause the formation of multi‐molecular complexes that are either internalized or pose a steric hindrance to enzymatic proteolysis, so blocking sCD23 generation. CTLA4Fcε caused a concentration‐dependent reduction of lymphocyte proliferation in human peripheral blood mononuclear cell samples stimulated in vitro with concanavalin A. The ability to bind IgE receptors on effector cells, to regulate the production of sCD23 and to inhibit lymphocyte proliferation suggests that CTLA4Fcɛ has immunomodulatory properties on human Th2 responses.
Keywords: CD23, CTLA‐4, fusion protein, IgE, T helper type 2 response
Abbreviations
- ADAM10
A disintegrin and metalloproteinase domain‐containing protein 10
- CD
cluster of differentiation
- CFSE
carboxyfluorescein succinimidyl ester
- CH
immunoglobulin heavy chain constant domain
- Con A
concanavalin A
- CTLA‐4
cytotoxic T‐lymphocyte antigen 4
- Ec
ectodomain
- Fc
fragment crystallizable
- FcεRI
IgE receptor type I
- FcεRII
IgE receptor type II
- H‐chain
immunoglobulin heavy chain
- HRPO
horseradish peroxidase
- Ig L
immunoglobulin light chain
- IL
interleukin
- mAb
monoclonal antibody
- MFI
mean fluorescence intensity
- PE
phycoerythrin
- PBMCs
peripheral blood mononuclear cell(s)
- mCD23
membrane CD23
- sCD23
soluble CD23
- Th1
T helper type 1
Introduction
T helper type 1 (Th1) and Th2 are the main effector responses of the adaptive immune system. Each one displays a distinct profile of cytokines, effector cells and immunoglobulin isotypes. Typically, during a human Th2 response, T helper cells secrete interleukin‐4 (IL‐4), IL‐5 and IL‐13; mast cells, eosinophils and basophils are the main effector cells; and IgE is the most prominent antibody produced. Th2 responses have been classically associated with protection against certain parasitic infections and with IgE‐mediated allergy. Recently, it has become clear that elements of the Th2 response may also be involved in the onset and/or maintenance of some autoimmune diseases.1, 2
The pathogenic role of IgE in allergy is well established.3, 4 Accumulating evidence favours the notion that the same applies to self‐reactive IgE in certain Th2‐related autoimmune diseases.5, 6 Increased levels of circulating (total and/or specific) IgE are found in patients afflicted with these immune‐related disorders.5, 7, 8 Hence, controlling IgE levels has become a recognized target for therapeutic development. For instance, omalizumab4 and the recently developed ligelizumab9 are humanized monoclonal antibodies (mAbs) that bind IgE and prevent IgE from binding to Fcɛ receptors, reducing blood levels of free and total IgE. Omalizumab is currently indicated for the treatment of patients suffering from moderate to severe allergic asthma.4, 10
IgE is secreted by plasma cells instructed by Th2 lymphocytes, mainly through IL‐4 and CD40 ligand signalling on cognate, antigen‐stimulated, plasma cell‐precursor B cells.11, 12 Under the influence of these stimuli, activated B lymphocytes up‐regulate membrane CD23 (mCD23),13, 14 which is then enzymatically processed into soluble CD23 (sCD23).15 In humans, sCD23 acts as a stimulator of B‐cell proliferation,16 and induces IgE class switching17, 18 and synthesis.19, 20 Conversely, mCD23 influences IgE production in a negative fashion.21 Therefore, mCD23 and sCD23 are considered components of a complex molecular network that regulates IgE synthesis and homeostasis.21 Several findings suggest that targeting of CD23 may result in clinical benefit.22 For example, a sustained and dose‐dependent decline in plasma levels of IgE was observed in patients with allergic asthma treated with lumiliximab, a primatized anti‐human CD23 mAb.23 Solid proof of the positive influence that sCD23 has on human IgE synthesis was obtained by uncoupling the effects of mCD23 and sCD23 in an in vitro B‐cell system.24 Blocking of sCD23 production therefore emerges as a possible additional way to control IgE levels. Several approaches have been experimentally tested to inhibit sCD23 generation. For instance, binding of IgE25 or IgE–antigen complexes26 to mCD23, treatment of CD23+ cells with certain anti‐CD23 mAbs,25 or blocking of the proteolytic activity of the metalloprotease A disintegrin and metalloproteinase domain‐containing protein 10 (ADAM10),27 the main CD23‐sheddase, all inhibit sCD23 production.
Cytotoxic T‐lymphocyte antigen 4 (CTLA‐4/CD152) is a type I membrane protein constitutively expressed at the surface of CD4+ CD25+ Foxp3+ regulatory T cells.28 CTLA‐4 is induced upon helper/effector T‐cell activation,29 and is one of the two known ligands of CD80 (B7‐1) and CD86 (B7‐2).30 The importance of B7 molecules as providers of co‐stimulatory signals to T cells during MHC‐restricted antigen presentation is well‐recognized. A large body of evidence also indicates that CTLA‐4 – through its interaction with B7 – serves important regulatory functions under physiological conditions, down‐regulating the immune response29 and preventing the recognition of self.31 Abatacept (Orencia®) and Belatacept (Nulojix®) are two fusion proteins containing the ectodomain of CTLA‐4 joined to the Fc fragment of IgG1. They effectively bind B7 molecules, block B7/CD28‐mediated signalling, and are currently used as ‘T‐cell co‐stimulation blockers’ to treat patients with rheumatoid arthritis that is unresponsive to conventional treatment32 and to prevent kidney allograft rejection.33
We hypothesized that a soluble fusion protein in which the CD80/CD86‐binding domain of CTLA‐4 and the FcεR‐binding domain of IgE are combined will benefit the management of immune disorders associated with the Th2 response. Here we report on the construction and expression of a DNA encoding the extracellular domain of murine CTLA‐4 joined to the constant domains CH2, CH3 and CH4 of the human Ig ɛ heavy (H) chain. The derived soluble fusion protein, CTLA4Fcε, was produced and purified, and its molecular structure was partially characterized. The binding of CTLA4Fcε to CD80, CD86 and IgE receptors (FcɛRI and FcɛRII/CD23) was also examined. Furthermore, the effect of CTLA4Fcε on the accumulation of sCD23 in tissue culture was evaluated and compared with the effect of IgE. Finally, the proliferation of human peripheral blood lymphocytes stimulated in vitro with concanavalin A (Con A) was studied in the presence of CTLA4Fcε. The results are discussed in the context of the relevance of these various molecular interactions to intervention at the onset of Th2 responses, and to the control of IgE levels under pathological conditions.
Materials and methods
Cells, antibodies and recombinant proteins
TAZZ – a Chinese Hamster Ovary (CHO) ‐derived transfectoma cell line secreting human immunoglobulin λ light (L) chains – was produced in our laboratory as previously reported.34 FcεRI+ RBL‐SX38 and FcεRI‐α + CHO‐3D10 cells were gifts from Drs J.‐P. Kinet and M. Penichet, respectively. CD23+ CD80+ CD86+ RPMI‐8866 cells were obtained from ECACC/Sigma‐Aldrich (St Louis, MO). The human IgE‐secreting cell line U266 was obtained from ATCC (Manassas, VA). These cell lines were all maintained in supplemented RPMI‐1640 or Iscove's modified Dulbecco's medium (IMDM) containing 5–10% fetal calf serum, 2 mm l‐glutamine, 100 U/ml penicillin, 100 µg/ml streptomycin, 0·25 µg/ml amphotericin B.
Human peripheral blood was obtained from healthy members of our scientific staff who participated in this project and agreed voluntarily. Venous blood samples (5–10 ml) were obtained aseptically in anticoagulant (3·8% sodium citrate). Some samples were used as whole blood during studies on basophils, and others were processed by density‐gradient centrifugation35 on Histopaque®‐1077 (Sigma‐Aldrich) to obtain peripheral blood mononuclear cells (PBMCs) to be used in the lymphocyte proliferation assays. The study was approved by the bioethics committee of the Instituto Venezolano de Investigaciones Científicas.
Polyclonal antibodies used were anti‐human IgE, horseradish peroxidase (HRPO)‐conjugated anti‐human IgE, biotin‐conjugated anti‐mouse CTLA‐4, and biotin‐conjugated anti‐human Ig L (λ) chain from Sigma‐Aldrich. Goat anti‐human IgE and HRPO‐conjugated anti‐goat immunoglobulin were from Pierce Biotechnology (Rockford, IL). The following mAbs were used: anti‐mouse CTLA‐4 from R&D Systems (Minneapolis, MN); phycoerythrin (PE)‐labelled anti‐human CD23 (anti‐CD23/PE; clone M‐L233), PE‐labelled anti‐human CD80 (anti‐CD80/PE; clone L‐307.4) and FITC‐labelled anti‐human CD86 (anti‐CD86/FITC; clones FUN‐1 or IT2.2) from BD Pharmingen (San Jose, CA); FITC‐labelled anti‐human FcεRI (anti‐FcεRI/FITC, clone CRA2) from COSMO BIO CO (Tokyo, Japan); and PE‐labelled anti‐human CD203c (anti‐CD203c/PE) from Biolegend (San Diego, CA). The recombinant fusion protein CTLA4Ig was obtained from R&D Systems and abatacept (an Fc‐mutated version of CTLA4Ig) was from Bristol‐Myers Squibb (New York, NY).
CTLA4Fcɛ DNA. Cloning, construction, and stable expression
A cDNA fragment encoding the human Ig ε chain constant domains CH1 to CH4 (Cε1–Cε4) was cloned by RT‐PCR. The poly‐A+ fraction of total RNA isolated from U266 cells was converted to cDNA by reverse transcription using oligo‐dT.36, 37 U266 cDNA and oligonucleotides A and B (Table 1) were used to amplify the DNA encoding Cε1–Cε4 by PCR. The amplified DNA was cloned into a commercial blunt vector (Life Technologies, Grand Island, NY). Restriction endonuclease analysis and automated sequencing of several clones confirmed the identity of the cloned Cɛ1–Cɛ4 DNA. Previous reports have implicated domains Cɛ2, Cɛ3 and Cɛ4 in the IgE binding to FcεR.38, 39 Therefore, only the DNA sequence encoding domains Cε2, Cε3 and Cε4 (Cε2–Cε4) was used for construction of the CTLA4Fcε DNA.
Table 1.
Sets of primers used for cloning the constant region of the human ε heavy chain gene and for joining it to EcCTLA4
| Name | (Id)a | Sequence | Target region in template |
|---|---|---|---|
| Primers used for cloning the sequence encoding the constant region of the human immunoglobulin ε gene | |||
| Cε1–Cε4 sense | (A) | 5′d[GCCTCCACACAGAGCCCATCC] | 5′‐end of Cε1 (the first seven codons) |
| Cε1–Cε4 antisense | (B) | 5′d[TCATTTACCGGGATTTACAGA] | 3′‐end of Cε4 (the last six amino acids codons plus the stop codon) |
| Primers used to modify and join EcCTLA4 and Cε2–Cε4 DNA sequences | |||
| CTLA4‐Cε2 sense | (C)b | 5′d[CCATGCCCGGATTCTGACTTC GGTGGCGGTGGCTCGGTCTGCTCCAGGGACTTCAC] | 5′‐end of Cε2 |
| Oncostatin M signal peptide sense | (D)c | 5′d[GGGGGATCC CACCATGGGTGTACTGCTCACACAG] | 5′‐end of Oncostatin M signal peptide (the first seven codons) |
| Cε4 antisense | (E)d | 5′d[GGGCTCGAC TCATTTACCGGGATTTACAGA] | 3′‐end of Cε4 (the last six amino acids codons plus the stop codon) |
Id = primer identification.
Primer C was designed to amplify a modified Cε2–Cε4 DNA that contains the sequence coding for the last seven C‐terminal amino acids of EcCTLA4 (underlined), joined to the 5′‐end of Cε2‐4 by a pentapeptide linker‐coding sequence (bold).
Primer D corresponds to the first seven amino acids of the human Oncostatin M signal peptide, preceded by a ribosome‐binding site (italics) and a protected (GGG) BamHI‐cloning site (underlined).
Primer E corresponds to the last six amino acids of Cε4 plus the stop codon (italics) followed by a protected (GGG) XhoI‐cloning site (underlined).
A cDNA sequence encoding the extracellular domain of murine CTLA‐4 (EcCTLA4) was obtained from plasmid pcCTLA4HA (a gift from Dr Pedro Rivas‐Vetencourt. Universidad Central de Venezuela). A short DNA sequence encoding the human Oncostatin M signal peptide40 precedes EcCTLA4 in pcCTLA4HA, and it was preserved for the proper expression of the recombinant CTLA4Fcε DNA construct.
Cε2–Cε4 and EcCTLA4 sequences were joined using a two‐step gene Gene Splicing by Overlap Extension PCR strategy,41 which was simplified by using one overlapping primer. Copies of the DNA coding for Cε2–Cε4 were first made using the cloned Cε1–Cε4 DNA as template and oligonucleotide C (Table 1) as a primer. The PCR product of this reaction is a Cε2–Cε4 DNA modified at its 5′‐end to encode the last seven C‐terminal amino acids of EcCTLA4, joined to Cε2 by the coding sequence of a pentapeptide linker.42 The second PCR was set by adding, to the first PCR product, the pcCTLA4HA plasmid DNA and oligonucleotides D (which encodes the first seven amino acids of the human Oncostatin M signal peptide) and E (which encodes the last six amino acids of Cε4 plus a stop codon) (Table 1). During this second PCR, the 3′‐end of the EcCTLA4 sequence in pcCTLA4HA and the 5′‐end of the modified Cε2–Cε4 cDNA overlap, and were used to produce a DNA construct containing the EcCTLA4 and Cε2–Cε4 fragments joined by the peptide linker‐coding sequence. The PCR product showing the expected size in the agarose gel electrophoretic analysis was cloned, and its identity was confirmed as indicated above. Finally, the construct EcCTLA4Fcε was transferred as a BamHI–XhoI fragment into the expression vector pcDNA3.1Zeo(–) (Life Technologies) to generate a recombinant plasmid here designated pAZ‐Ec‐CTLA4Fcε.
Ten micrograms of pAZ‐Ec‐CTLA4Fcε DNA were transferred into TAZZ cells by liposome‐mediated transfection using Lipofectin (Life Technologies) and following the manufacturer's instructions. Stable transfectomas were selected in supplemented IMDM containing 10 mg/ml zeocine (Life Technologies), and screened by IgE‐specific or CTLA4‐specific sandwich ELISA. Briefly, polystyrene 96‐well ELISA plates (Greiner BIO‐ONE. Frickenhausen, Germany) were coated with anti‐human IgE or anti‐mouse CTLA‐4, samples were added, and the protein bound was detected with anti‐human IgE/HRPO or anti‐mouse CTLA‐4/biotin plus avidin/HRPO (Sigma‐Aldrich), respectively. For the identification of clones secreting recombinant molecules that preserve both CTLA‐4 and IgE moieties, the IgE‐specific ELISA outlined above was modified, so that protein bound to the anti‐IgE‐coated ELISA plate was detected using anti‐mouse CTLA‐4/biotin plus avidin/HRPO. Selected IgE+ CTLA‐4+ transfectomas were cloned by limiting dilution in supplemented IMDM in the presence of 10 mg/ml zeocine. Culture supernatants from zeocine‐resistant clones were screened as indicated above. Supernatant harvested from cultures of the IgE+ CTLA‐4+ transfectoma named G1E10 was used for further studies.
CTLA4Fcε fusion protein: production and characterization
G1E10 and U266 cells were grown in supplemented IMDM in roller bottles. The protein in both G1E10 (CTLA4Fcɛ) and U266 (IgE) culture supernatants was purified by affinity chromatography using anti‐human IgE (Xolair®, Novartis, NJ) coupled to Sepharose 4B (Sigma‐Aldrich). The concentration of purified CTLA4Fcɛ and IgE was estimated using a quantitative IgE‐specific ELISA (DRG International Inc., Springfield, NJ). An aliquot of purified IgE was labelled with FITC (Sigma‐Aldrich) following the supplier's instructions.
ELISA, SDS–PAGE, and immunoblotting were used for the structural characterization of the CTLA4Fcε fusion protein. The IgE‐specific ELISA outlined in the previous section was modified to study whether immunoglobulin L chains associate with CTLA4Fcε. Protein bound to the anti‐IgE/coated ELISA plate was detected using anti‐human Ig L(λ) chain/biotin plus avidin/HRPO. SDS–PAGE analyses were performed to estimate the apparent molecular size of CTLA4Fcε, and to rule out its eventual association with immunoglobulin L chains, using molecular weight protein standards (Sigma‐Aldrich or Life Technologies) and laboratory‐made recombinant chimeric IgG1 and IgG334 for molecular size estimation. Standard immunoblot protocols43 were followed to transfer PAGE‐resolved proteins to nitrocellulose. The polypeptides of interest were specifically detected using goat anti‐human IgE/HRPO or biotin‐conjugated anti‐human immuno‐globulin L (λ) chain, followed by streptavidin/HRPO (BD Biosciences, Mountain View, CA) and luminol (SuperSignal™; Life Technologies).
CTLA4Fcε binding to B7 molecules and FcεR
Flow cytometry was used to study whether CTLA4Fcε binds to cells displaying CTLA‐4 counter‐receptors (CD80/B7‐1 and CD86/B7‐2) and IgE receptors (FcεRI and FcεRII/CD23). FcεRI+ RBL‐SX38 and CD23+ CD80+ CD86+ RPMI‐8866 cells were incubated at 4° with CTLA4Fcε‐containing culture supernatant (G1E10) and examined for cell‐bound CTLA4Fcε using anti‐human IgE/PE or anti‐mouse CTLA‐4/PE. U266 (IgE‐secreting cells) and TAZZ (the cell line used for expression of the EcCTLA4Fcε DNA) cell culture supernatants were used as positive and negative controls, respectively. Samples were analysed using a Facscalibur flow cytometer (BD Biosciences) to estimate the fluorescence intensity of select events gated according to size (FSC‐H) and granularity (SSC‐H).
Specific binding of CTLA4Fcε to B7 molecules or Fcε receptors was studied using flow cytometry‐based binding inhibition assays. In these assays, CTLA4Fcε competed with fluorochrome‐labelled, blocking mAbs for binding to FcεRI displayed on the surface of FcεRI+ RBL‐SX38 or FcεRI‐α + CHO‐3D10 cells; or for binding to CD80, CD86 and FcεRII/CD23 on RPMI‐8866 cells. RBL‐SX38 and CHO‐3D10 cells were incubated at 4° with purified CTLA4Fcε or IgE, and subsequently stained with anti‐FcεRI/FITC. In experiments where FITC‐labelled IgE (IgE/FITC) – instead of anti‐FcεRI/FITC – was used as a probe, CTLA4Fcε or unlabelled IgE (cold IgE) was added simultaneously with IgE/FITC to the cells. Similar experiments were also performed with basophils from human peripheral blood. Aliquots of freshly collected whole blood samples were briefly treated with acid elution buffer (20 mm glycine, 1 mg/ml BSA, 130 mm NaCl, 2 mm CaCl2; pH 2·5) to detach the IgE bound to FcεR44 and subsequently stained with IgE/FITC, in the presence of different concentrations of CTLA4Fcε or cold IgE. RPMI‐8866 cells were similarly stained with anti‐CD23/PE, anti‐CD80/PE, anti‐CD86/FITC, or a mixture of anti‐CD80/PE plus anti‐CD86/FITC in the presence of or after incubation with CTLA4Fcε‐containing supernatant, or purified CTLA4Fcε or IgE. In some experiments, CTLA4Fcɛ binding to CD23 was assayed in the presence of the fusion protein CTLA4Ig, which was used to block CTLA‐4‐binding sites on B7 molecules. Mean fluorescence intensity (MFI) was estimated for each condition and the percentage of inhibition/blockade was calculated assuming an MFI equal to that of the isotype sample (when fluorescent antibodies were used as a probe) or the autofluorescence sample (when fluorescent IgE was used as a probe) as a 100% inhibition.
sCD23 estimation
RPMI‐8866 cells producing sCD23 were suspended in supplemented RPMI‐1640 medium (2·2 × 106 cells/ml), seeded on 48‐well plates, and cultured for 4 hr at 37°. Similar cultures were performed in the presence of different concentrations of purified CTLA4Fcε or human IgE. Culture supernatants were harvested and the sCD23 content was determined using a CD23‐specific ELISA. Absorbance data were averaged and converted to percentages using the mean value of a set of samples where no protein (CTLA4Fcε or IgE) was added as a 100%.
Lymphocyte proliferation assay
Human PBMCs were labelled with carboxyfluorescein diacetate succinimidyl ester (Life Technologies) at 5 μm in RPMI‐1640 medium, placed in 96‐well microculture plates, and stimulated for 5 days with Con A (Sigma‐Aldrich) at 1·25 μg/ml. Cultured cells were harvested and analysed in a Facscalibur flow cytometer to determine the carboxyfluorescein succinimidyl ester (CFSE) content per cell. The extent of proliferation was calculated as the percentage of cells showing a reduction by half or more of its CFSE content compared with CFSE‐labelled non‐stimulated cells. The data collected from these samples were also analysed as previously described45 to group the cells according to the number of divisions they experienced. Cell groups were defined according to the CFSE content distribution in histograms for stimulated cells and presented as the percentage of cells experiencing zero, one, two, three or four rounds of cell division. Similar lymphoproliferative assays were performed in the presence of different concentrations of purified CTLA4Fcε or abatacept. Proliferation and the percentage of cells experiencing zero, one, two, three or four cycles of cell division were calculated as indicated above, and relevant comparisons were made.
Data processing and statistics
Flow cytometry data were processed using BD cellquest ™ pro (BD Biosciences). Statistical analyses were performed using prism 5.0 (Graph‐Pad Software, Inc., San Diego, CA, USA) or IBM SPSS Statistics 15.0 (IBM Corp., Chicago, IL, USA). The square root of the proportions calculated with the sCD23 ELISA data were transformed to Arc‐sin values and analysed by two‐way analysis of variance followed by multiple comparisons using the Bonferroni test. The results from Con A‐induced proliferation assays (the percentages of proliferating cells and of cells experiencing a number of divisions) were analysed by one‐way analysis of variance followed by multiple comparisons using a Fisher's least significant difference test.
Results
Production of recombinant CTLA4Fcε
The cloned Cε1–Cε4 DNA fragment shown in Fig. 1(a) was sequenced and proved identical to the previously reported cDNA encoding the human ε heavy chain constant domains46 (not shown).
Figure 1.

Recombinant CTLA4Fcε: DNA construction, expression, and protein structure characterization. (a) Cloning of the human immunoglobulin ε heavy (H) chain. Using total RNA from U266 cells, a ~1·3‐kb amplicon, putatively encoding the constant part (from Cε1 to Cε4) of the ε H chain, was cloned by RT‐PCR and identified by agarose gel electrophoresis and ethidium bromide staining (AGE‐EB). Subsequent DNA sequencing confirmed the amplicon identity as human Cε1–Cε4. (b) Using a recombinant PCR strategy, the DNA encoding the extracellular portion of mouse CTLA‐4 (EcCTLA4) was fused to the Cε2–Cε4 DNA through a pentapeptide linker‐coding sequence. The PCR product of the expected size (~1·47 kb) was identified by AGE‐EB. (c) The EcCTLA4Fcε DNA construct was inserted into an expression vector to generate the plasmid pAZ‐Ec‐CTLA4Fcε. The expected amino acid sequence at the CTLA4/Fcε junction is shown in one‐letter code. (d) After CTLA4Fcε expression, protein from a select transfectant (G1E10) was analysed by SDS–PAGE/Coomassie blue staining under non‐reducing (NR) and reducing (R) conditions. (e, f) CTLA4Fcε identity was confirmed by Western blot analyses. In (e), culture supernatants from transfectoma G1E10 and myeloma U266 were probed with anti‐IgE. In (f), purified CTLA4Fcε was probed with anti‐IgE (left and centre) whereas purified IgG1, probed with anti‐IgG1 (right), was used as a control. MSM, molecular size marker; bp, base pair; Ampr, Ampicillin resistance gene; Zeor, Zeocin resistance gene; pCMV, cytomegalovirus enhancer/promoter region; BGHpA, bovine growth hormone poly‐adenylation signal; OMsp, Oncostatin M signal peptide sequence; XhoI and BamHI: endonuclease restriction enzyme sites used for EcCTLA4Fcε cloning.
A CTLA4Fcε chimeric DNA (Fig. 1b) was created by PCR‐mediated recombination of the cDNA sequences encoding human Cε1–Cε4 and the extracellular domain of mouse CTLA‐4 (EcCTLA4). A pentapeptide linker‐coding sequence was added to, and the Cε1‐encoding sequence was excluded from, the recombinant DNA product. DNA sequencing confirmed that EcCTLA4 and Igε Cε2–Cε4 reading frames were preserved in the chimera, which was thereupon cloned into an expression vector. Figure 1(c) shows the features of the EcCTLA4Fcε construct, the respective expression plasmid, and the predicted amino acid sequence at the site of the CTLA‐4/Igε fusion.
After transfection and selection, culture supernatants were screened for the presence of CTLA4Fcε protein by IgE‐ and CTLA‐4‐specific ELISA. A number of supernatants giving an IgE signal tested negative for CTLA‐4 or vice versa (not shown). Hence, a CTLA‐4/IgE double‐specific ELISA was used to detect supernatants containing molecules carrying both protein moieties (Table 2, column 1). Supernatant harvested from cultures of the IgE+ CTLA‐4+ transfectoma G1E10 was used to purify and further characterize CTLA4Fcε.
Table 2.
Anti‐CTLA‐4 and anti‐IgE, but not anti‐immunoglobulin L chain, reagents recognize CTLA4Fcε
| Sample | Optical density (450 nm) | |||
|---|---|---|---|---|
| 1a(ε/CTLA4‐specific) | 2 (λ‐specific) | 3 (ε/λ‐specific) | 4 (IgE‐specific) | |
| Capture | ||||
| Anti‐ε | Anti‐λ | Anti‐ε | Anti‐ε | |
| Detection | ||||
| Anti‐CTLA4 | Anti‐λ | Anti‐λ | Anti‐ε | |
| IMDMb | 0·063 ± 0·002 | 0·143 ± 0·027 | 0·064 ± 0·002 | 0·123 ± 0·002 |
| TAZZ | 0·058 ± 0·000 | 1·455 ± 0·049 | 0·071 ± 0·012 | 0·095 ± 0·002 |
| U266 | 0·062 ± 0·002 | NTc | 0·437 ± 0·018 | 1·087 ± 0·004 |
| G1 | 0·750 ± 0·004 | 1·483 ± 0·118 | 0·055 ± 0·002 | 0·562 ± 0·038 |
| D10 | 1·026 ± 0·018 | 1·677 ± 0·034 | 0·061 ± 0·004 | 0·600 ± 0·035 |
| G1E10 | 1·729 ± 0·026 | 1·090 ± 0·014 | 0·055 ± 0·002 | 1·142 ± 0·024 |
Four different sandwich ELISAs (identified as 1, 2, 3 and 4) were used to detect CTLA‐4 and Fcε moieties in CTLA4Fcε or to determine whether Ig L (λ) chains assembled with the chimeric protein. Cell culture supernatants harvested from transfectants G1, D10 and G1E10, and the cell lines TAZZ (the recipient cells used for transfection) and U266 (a human IgE‐secreting myeloma cell line), were all tested in triplicates. Results shown are the mean ± SD of the optical density at a wavelength of 450 nm. This assay was repeated three times obtaining similar results.
Iscove's modified Dulbecco's medium (IMDM; the medium in which transfectants and cell lines were cultured) supplemented as indicated in the Materials and methods.
Not tested.
CTLA4Fcε is a 145 000–150 000 MW homodimer
During preliminary experiments, attempts to express CTLA4Fcε DNA in CHO cells were unsuccessful. Proper in vitro cell secretion of immunoglobulin heavy chains has been reported to depend upon the concomitant expression of an immunoglobulin light (L) chain.47 Hence, transfection was tested in TAZZ cells, a CHO‐derived transfectoma secreting human Ig L (λ) chains. Several CTLA4Fcε‐secreting transfectants were produced in this way. However, in these cultures, the possibility of the CTLA4Fcε fusion protein forming immunoglobulin‐like molecules with the L chain had to be ruled out. Table 2 summarizes ELISA results suggesting that even though L chains (column 2) and CTLA4Fcε (columns 1 and 4) are present in culture supernatants harvested from the transfectants studied, they do not interact to form immunoglobulin‐like molecules but stay separately (column 3). These results were confirmed by SDS–PAGE/immunoblot analyses of purified CTLA4Fcε electrophoresed under non‐reducing conditions. No L chain was detected in association with the fusion protein (not shown). Under non‐reducing conditions, SDS–PAGE (Fig. 1d) and Western blotting (Fig. 1e and f) analyses showed CTLA4Fcε with an apparent molecular size of 145 000–150 000. Under reducing conditions, CTLA4Fcε migrated as a sharp band around 70 000 (Fig. 1d–f).
CTLA4Fcε binds to cells expressing CTLA‐4 counter‐receptors and Fcε receptors
Flow cytometric analysis revealed a significant fluorescence signal when FcεRI+ RBL‐SX38 cells were incubated with CTLA4Fcε‐containing culture supernatant (G1E10) followed by fluorescent labelling with anti‐human IgE (fluorescent anti‐IgE) or fluorescent anti‐CTLA‐4 (Fig. 2, upper panels). Efficient labelling was also observed when CD23+ CD80+ CD86+ RPMI‐8866 cells were incubated with G1E10 supernatant, followed by fluorescent anti‐IgE or fluorescent anti‐CTLA‐4 (Fig. 2, lower panels). In both cell lines, incubation with a human IgE‐containing supernatant (U266) followed by fluorescent anti‐IgE led to significant labelling (Fig. 2).
Figure 2.
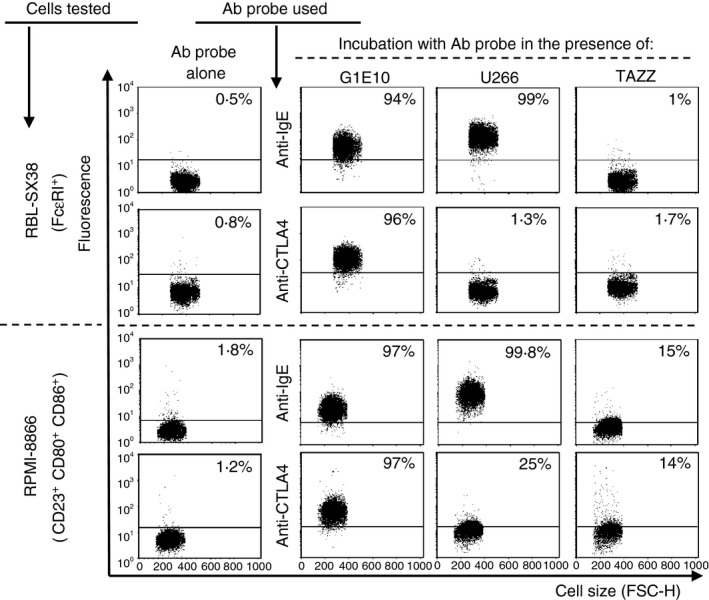
CTLA4Fcε binds to cells displaying CTLA‐4 counter‐receptors and Fcε receptors. Human Fcε RI + RBL‐SX38 or CD23+ CD80+ CD86+ RPMI‐8866 cells were suspended in culture supernatant harvested from: (i) the cell line used for CTLA4Fcε DNA expression (TAZZ), (ii) the transfectoma producing CTLA4Fcε (G1E10), or (iii) a human IgE‐producing cell line (U266), in the presence of phycoerythrin (PE) ‐labelled anti‐human IgE or anti‐mouse CTLA‐4. Samples were analysed by flow cytometry and results are shown as representative dot plots of cell size (FCS‐H) versus signal in the relevant fluorescence channel. Binding of CTLA4Fcε (or IgE) was estimated as the change in fluorescence intensity (FI) of events analysed under each experimental condition compared with the basal FI value offered by a sample incubated with the antibody probe alone. This change was expressed as a percentage of positive events (inset values in each dot plot) defined as those found above an arbitrary cut‐off line. The results shown come from a single experiment and are representative of at least three independent experiments, each performed in duplicate.
CTLA4Fcε binds to FcεRI
Specific binding of CTLA4Fcε to the high‐affinity receptor for IgE, FcɛRI, was documented using a fluorescent mAb that recognizes the IgE‐binding site on the FcɛRIα chain (fluorescent anti‐FcɛRIα).48 Flow cytometric analysis shown in Fig. 3(a) revealed that incubation of FcɛRI+ RBL‐SX38 or FcɛRIα + CHO‐3D10 cells with fluorescent anti‐FcɛRIα resulted in a fourfold to sixfold increase in the MFI of the cell population examined. More importantly, it also revealed that the previous incubation of these cells with CTLA4Fcε led to a concentration‐dependent reduction in the MFI for both cell types, suggesting that CTLA4Fcε specifically blocks the binding of the fluorochome‐labelled mAb to FcɛRI. A reduction in the MFI was also observed when IgE, instead of CTLA4Fcε, was used. Comparison of the MFI obtained with matching concentrations of CTLA4Fcε and IgE suggested that both proteins bind to FcεRI with similar efficacy (Fig. 3a).
Figure 3.
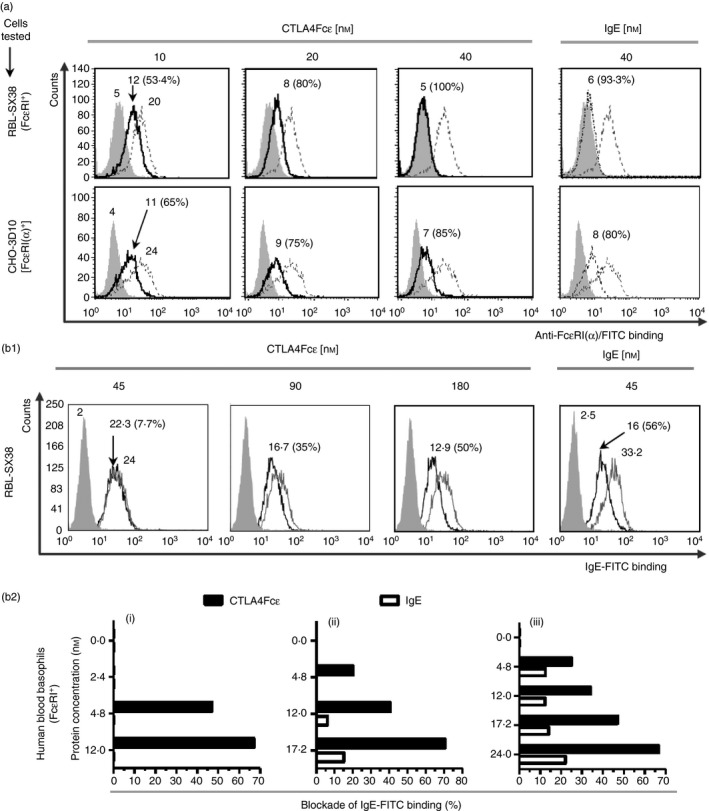
CTLA4Fcε binds to Fcε RI. (a) Flow cytometric analysis of Fcε RI + RBL‐SX38 or Fcε RI α + CHO‐3D10 cells incubated with CTLA4Fcε or IgE at the indicated concentrations, and subsequently stained with an FITC‐labelled anti‐human Fcε RI α monoclonal antibody (mAb) (clone CRA2, which recognizes the IgE‐binding site of Fcε RI). Binding of CTLA4Fcε or IgE to Fcε RI was estimated as the reduction in the anti‐Fcε RI α‐related mean fluorescence intensity (MFI). Grey‐filled histograms show the fluorescence of the sample incubated with the antibody isotype; empty grey‐lined histograms, the fluorescence of the sample incubated with anti‐Fcε RI α/FITC; and empty black‐lined histograms, the fluorescence of the sample incubated with anti‐Fcε RI α/FITC in the presence of CTLA4Fcε or IgE. Inset numbers shown within select histograms are MFI values or percentage of inhibition. (b1) CTLA4Fcε blocks the binding of IgE to Fcε RI on RBL‐SX38 cells. Cells were incubated in culture media containing IgE/FITC at a fixed concentration (45 nm of IgE), mixed with either CTLA4Fcε at different concentrations or ‘cold’ IgE at a fixed concentration (45 nm). Samples were analysed by flow cytometry and a reduction of the IgE/FITC‐related MFI was assumed to be the result of the occupancy of Fcε RI sites by CTLA4Fcε or ‘cold IgE’. The percentage of inhibition was calculated. Grey‐filled histograms show the autofluorescence of the control sample; empty grey‐lined histograms, the fluorescence of the sample incubated with IgE/FITC; and empty black‐lined histograms, the fluorescence of the sample incubated with IgE/FITC in the presence of CTLA4Fcε or ‘cold’ IgE. Inset numbers represent the same values indicated in (a). The results shown in (a) and (b1) come from a single experiment and are representative of at least three independent experiments, each performed in duplicate. (b2) CTLA4Fcε blocks IgE binding to Fcε RI on human peripheral blood basophils. Blood samples (i, ii, iii) were processed to elute endogenous IgE and treated as outlined in (b1). Basophils present in these samples were hierarchically gated according to their relative size (FSC‐H) versus granularity (SSC‐H), followed by CD203c/Fcε RI expression. Then, they were analysed to determine the IgE/FITC‐related fluorescence, and the percentage of blockade was calculated.
The binding of CTLA4Fcε to FcɛRI on RBL‐SX38 cells was studied further using IgE/FITC as a probe, instead of fluorescent anti‐FcɛRIα. In these experiments, RBL‐SX38 cells were incubated simultaneously with a fixed, FcɛRI‐saturating concentration of IgE/FITC and different concentrations of CTLA4Fcε or unlabelled IgE (‘cold’ IgE). Under these conditions, a fourfold higher concentration of CTLA4Fcε than ‘cold’ IgE was needed to inhibit ~ 50% of the IgE/FITC‐related MFI (Fig. 3b1).
The IgE/FITC was also used to analyse CTLA4Fcε's binding to FcɛRI on human peripheral blood basophils. For these assays, whole blood samples from three different donors were treated to elute endogenous IgE from the cell membrane and were subsequently exposed to a fixed, non‐saturating concentration of fluorescent IgE and different concentrations of CTLA4Fcε or ‘cold’ IgE. The fluorescent IgE‐related MFI was established by flow cytometric analysis for each experimental condition. For all three blood samples studied, CTLA4Fcε consistently reduced the fluorescent IgE‐related MFI in FcεRI+ cells in a concentration‐dependent fashion (Fig. 3b2). Under these experimental conditions, ‘cold’ IgE produced only a mild reduction in the IgE/FITC‐related MFI (Fig. 3b2).
Binding of CTLA4Fcε to FcεRII/CD23 and B7
Flow cytometric data shown in Fig. 2 documented that both CTLA4Fcɛ in G1E10 and IgE in U266 culture supernatants bind to CD23+ CD80+ CD86+ RPMI‐8866 cells, suggesting that binding of CTLA4Fcɛ to these cells occurs through CD23, the low‐affinity receptor for IgE. Interestingly, when these cells were incubated with various concentrations of purified CTLA4Fcɛ or IgE and subsequently labelled with fluorescent anti‐IgE, it was possible to detect CTLA4Fcɛ bound to the cell surface at 1·4 nm. This was the lowest concentration of protein tested, and it was clearly above the CTLA4Fcɛ's limit of detection (Fig. 4a, middle column histograms series). For IgE, however, the limit of detection was determined at 11·25 nm, a concentration about 10 times higher (Fig. 4a, left column histograms series). In addition, at every concentration tested, the CTLA4Fcɛ‐related MFI was several times higher (up to 37 times at 5·6 nm) than the IgE‐related MFI (Fig. 4a, middle column histograms series); and the pattern of reduction of the fluorescence signal that accompanied the dilution of each protein suggested a near‐to‐saturation situation for CTLA4Fcɛ, but not for IgE (Fig. 4a, left and middle column histograms series).
Figure 4.

Differential binding of CTLA4Fcε and IgE to RPMI‐8866 cells. (a) Left and middle column histogram series show representative flow cytometric analyses of RPMI‐8866 cells incubated with six different concentrations (from 1·4 to 45 nm) of IgE or CTLA4Fcε, respectively, and subsequently stained with phycoerythrin‐labelled anti‐human IgE (anti‐IgE/PE). The right column histogram series contains data from a similar experience in which RPMI‐8866 cells were pretreated with 200 nm CTLA4‐Ig (to block CD80 and CD86 sites), incubated with CTLA4Fcε, and finally stained with anti‐IgE/PE. Mean fluorescence intensity (MFI) values of the control condition (no protein) and of each protein concentration assayed are included for comparisons (inset numbers shown at the right upper corner of each histogram). Also included for comparisons are values that represent, for each protein concentration assayed, the number of times the CTLA4Fcε‐related MFI was higher than the IgE‐related MFI (inset underlined numbers shown below MFI values in the middle and right column histogram series) The results shown come from a single experiment and are representative of seven independent experiments, each performed in duplicate. (b) RPMI‐8866 cells were stained with fluorescent anti‐human CD80 and anti‐human CD86 in the presence of two different concentrations of CTLA4‐Ig and analysed by flow cytometry. The results shown come from a single experiment and are representative of at least two independent experiments, each performed in duplicate.
Altogether, these results clearly indicate that CTLA4Fcɛ and IgE bind to RPMI‐8866 cells in a different manner. Furthermore, they suggest that CTLA4Fcɛ may have other binding sites in addition to the IgE‐related ones, most likely CD80 and CD86. To test this hypothesis, similar experiments were performed with RPMI‐8866 cells that were previously treated with CTLA4‐Ig at a protein concentration (200 nm) that blocks all the available CD80 and CD86 sites on these cells (Fig. 4b), and represents more than a fourfold excess compared with the highest concentration of CTLA4Fcɛ tested. For every concentration of CTLA4Fcɛ studied under these conditions, a substantial reduction of the MFI was observed (Fig. 4a, right column histograms series), indicating that occupancy of the CD80 and CD86 sites conditioned CTLA4Fcɛ's binding to RPMI‐8866 cells. A similar blockade of CD80/CD86 using CTLA4‐Ig did not modify IgE's binding to RPMI‐8866 cells (not shown).
To further confirm that CTLA4Fcε binds RPMI‐8866 cells through B7 molecules, fluorochrome‐labelled mAbs against CD80 and CD86 were used to stain these cells. Previous studies reported that the mAb clones used recognize the main binding region for CTLA‐4/CD28 in CD80 and CD86.49, 50 Flow cytometric analysis showed that the CTLA4Fcε‐containing culture supernatant (G1E10) blocked mAb binding to CD80 and CD86 molecules (Fig. 5a). Furthermore, double staining of RPMI‐8866 cells with anti‐CD80 plus anti‐CD86 was almost completely blocked in the presence of G1E10 supernatant (Fig. 5b). Additional support for the assumption that the other sites for CTLA4Fcε's binding are CTLA‐4‐related was obtained by incubating RPMI‐8866 cells with purified CTLA4Fcɛ or IgE at various concentrations and subsequent staining with the fluorescent anti‐CD86 reagent. CTLA4Fcε, but not IgE, blocked the binding of anti‐CD86 in a concentration‐dependent fashion (Fig. 5c).
Figure 5.
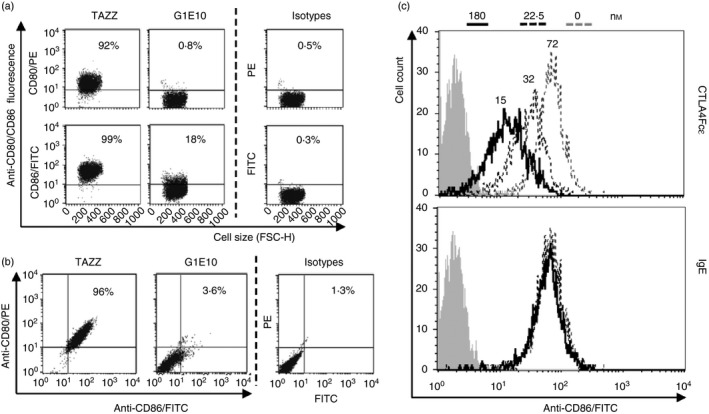
CTLA4Fcε binds to B7 molecules. (a) Aliquots of CD23+ CD80+ CD86+ RPMI‐8866 cells were incubated in mixes containing supernatant harvested from TAZZ or G1E10 cell cultures and fluorescent anti‐CD80 or anti‐CD86 blocking monoclonal antibodies (mAbs), and analysed by flow cytometry. Representative dot plots show that the vast majority of cells suspended in TAZZ supernatant were labelled with anti‐CD80 or anti‐CD86 (92% and 99% of the events analysed, respectively). Conversely, the samples suspended in G1E10 supernatant were only marginally labelled (anti‐CD80, 0·8%; anti‐CD86, 18%). (b) Aliquots of RPMI‐8866 cells were treated as indicated in (a), but adding both fluorescent anti‐CD80 and anti‐CD86 reagents to TAZZ and G1E10 supernatants. Samples were analysed by flow cytometry and results are shown in representative dot plots. Incubation of the cells under these conditions led to an almost complete reduction of the CD80‐ and CD86‐specific labelling in the case of the supernatant G1E10. (c) Overlaid histograms show representative flow cytometric analysis of samples of RPMI‐8866 cells incubated with anti‐human CD86/FITC mixed with two different concentrations (as indicated in the legend at the top of the figure) of purified CTLA4Fcε or IgE. CTLA4Fcε, but not IgE, was able to reduce anti‐CD86/FITC‐related fluorescence in a concentration‐dependent manner. Inset numbers in the top histogram are mean fluorescence intensity (MFI) values obtained for each condition tested. The results shown in (a) and (b) come from a single experiment and are representative of three independent experiments, each performed in duplicate.
The nature and consequence of CTLA4Fcε binding to CD23 and B7 on RPMI‐8866 cells: multi‐molecular binding and inhibition of sCD23 accumulation
To further characterize the differences observed in the binding of CTLA4Fcε and IgE to RPMI‐8866 cells, a flow cytometry‐based binding inhibition assay was carried out using a fluorochrome‐labelled anti‐CD23 mAb that recognizes the IgE‐binding site of CD23.51 Purified CTLA4Fcε mediated a concentration‐dependent blockade of anti‐CD23's binding to RPMI‐8866 cells (Fig. 6a, upper histogram). Interestingly, the same concentrations of IgE were only marginally effective at preventing anti‐CD23 binding to these cells (Fig. 6a, lower histogram). These results clearly show that CTLA4Fcε competes with the anti‐CD23 mAb more effectively than IgE for binding to CD23. We speculate that this enhanced ability is probably related to the capacity of CTLA4Fcε molecules to bind simultaneously to CD23 and B7 on the surface of RPMI‐8866 cells.
Figure 6.
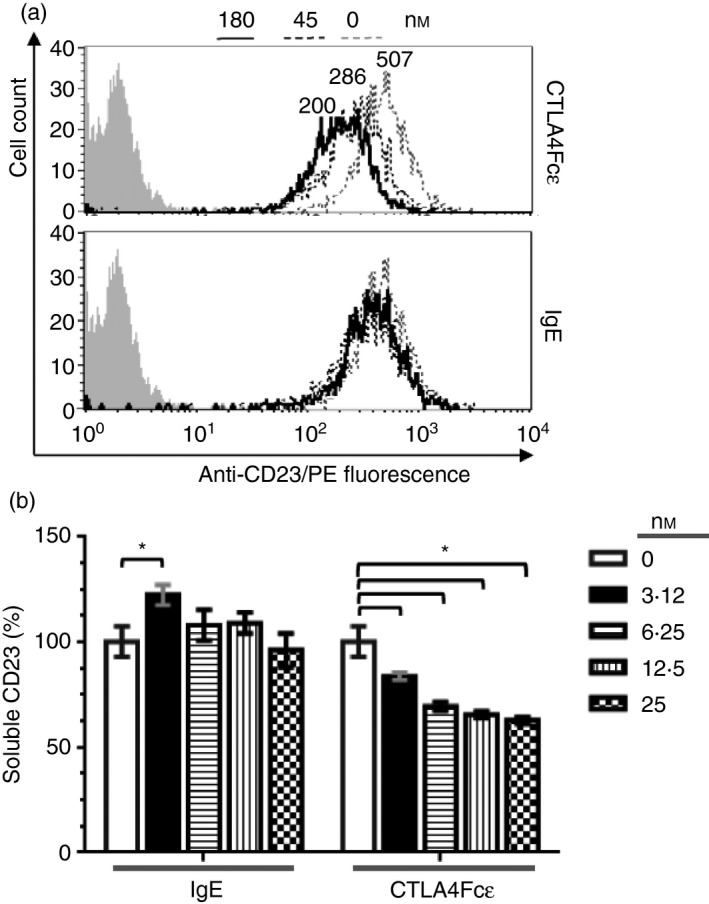
CTLA4Fcε and IgE bind to CD23 differently and CTLA4Fcε reduces sCD23 release from the cell membrane. (a) Binding of CTLA4Fcε and IgE to CD23 was studied using the CD23+ CD80+ CD86+ human B‐lymphoblastoid cell line RPMI‐8866. A fluorescent anti‐CD23 probe [phycoerythrin‐labelled anti‐CD23 (anti‐CD23/PE] that binds to the IgE‐binding site of CD23 was used to stain aliquots of 5 × 10⁴ cells in the presence of CTLA4Fcε or IgE at the indicated concentrations. Samples were analysed by flow cytometry. Representative overlaid histograms show the binding of CTLA4Fcε (top) or IgE (bottom) to CD23, measured as the reduction in the anti‐CD23/PE‐related fluorescence. Inset numbers shown above the select histograms are mean fluorescence intensity (MFI) values. In contrast to the marginal influence of IgE, CTLA4Fcε exerted a clear inhibitory effect on anti‐CD23/PE binding to CD23. The results shown come from a single experiment and are representative of three independent experiments, each performed in duplicate. (b) RPMI‐8866 cells were cultured in the presence or absence of CTLA4Fcε or IgE, and the sCD23 content in supernatants was determined by a CD23‐specific ELISA (no IgE/CTLA4Fcɛ: 100%; IgE at 3·12 nm: 122·4 ± 4·8%; CTLA4Fcε at 3·12 nm: 83·7 ± 1·8%; CTLA4Fcε at 6·25 nm: 69·5 ± 2%; CTLA4Fcε at 12·5 nm: 65·5 ± 1·7%; CTLA4Fcε at 25 nm: 62·8 ± 1·7%). Results shown are the arithmetic means ± SD of duplicates combined from four independent experiments. *P < 0·001.
Previous reports have documented that soluble CD23 (sCD23) accumulates in RPMI‐8866 cell cultures,15 so we asked whether the presence of CTLA4Fcε could modify the sCD23 content of supernatants harvested from these cultures. Therefore, RPMI‐8866 cells were incubated in the presence of increasing amounts of CTLA4Fcε or IgE, and the content of sCD23 in the culture supernatants was determined by a CD23‐specific ELISA. In the presence of IgE (Fig. 6b), the content of sCD23 in culture supernatants increased slightly but significantly at the lowest concentration of IgE tested. At all other concentrations, no difference with the control condition was observed. These results are consistent with the previously reported regulation of IgE production by sCD23 in humans.21, 24 By contrast, CTLA4Fcε induced a significant, concentration‐dependent reduction of the sCD23 content in the analysed supernatants (Fig. 6b).
CTLA4Fcε suppresses Con A‐induced proliferation of human PBMCs
A significant reduction in the Con A‐induced lymphocyte proliferation rate was observed (Fig. 7a) in samples of human PBMCs from four different donors at the highest concentration of CTLA4Fcε tested (10 nm). A reduction in proliferation, though not statistically significant, was also observed at 1 nm of CTLA4Fcε. The CTLA4‐Ig fusion protein abatacept – used as a control – also exerted a blocking effect on Con A‐induced proliferation starting at 10 nm. An analysis of these samples with regard to the number of cell divisions confirmed these results and revealed that both CTLA4Fcε and abatacept mainly reduced the proportion of cells experiencing three rounds of cell division, leading to the accumulation of cells in the non‐dividing fraction (Fig. 7b).
Figure 7.
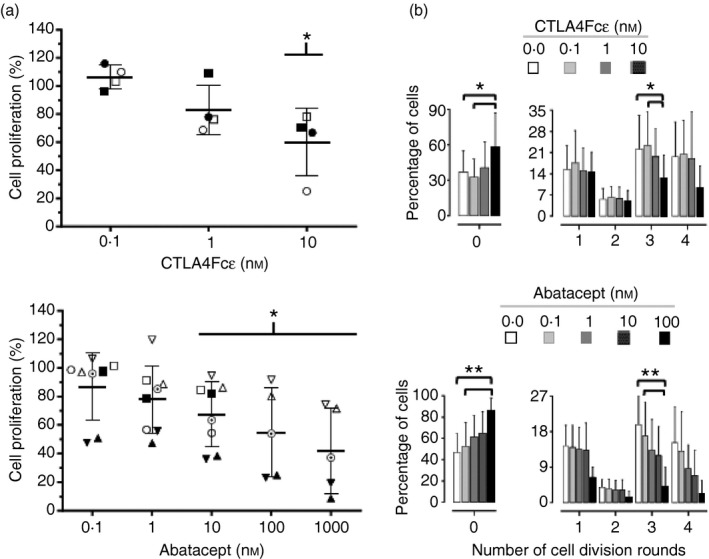
CTLA4Fcε inhibits concanavalin A (Con A) ‐induced human lymphocyte proliferation. Peripheral blood mononuclear cells (PBMCs) were isolated from human blood samples, labelled with CFDA‐SE, and cultured for 5 days in the presence of Con A and the indicated concentrations of purified CTLA4Fcε or abatacept (CTLA4Ig). Afterwards, the cells were harvested and analysed by flow cytometry to estimate CFSE content per cell. (a) The percentage of proliferating cells was determined on the basis of the cellular CFSE content for each experimental condition tested. Results shown are the arithmetic means ± SD of the normalized values obtained from several independent experiments, which are also individually identified with symbols in the figure (CTLA4Fcε experiments: n = 4; abatacept experiments: n = 5 to n = 8). Statistically significant differences compared to the control condition (a sample in which no protein – CTLA4Fcε or abatacept – was added, 100% proliferation) were observed with CTLA4Fcε at 10 nm (60 ± 23·8%; P < 0·05) and with abatacept at 10 nm (67·5 ± 22·7%; P < 0·05), 100 nm (54·7 ± 31·2%; P < 0·05), and 1000 nm (42 ± 29·9%; P < 0·05). (b) The percent of cells experiencing zero, one, two, three or four rounds of cell division were defined according to the CFSE content as described in the Materials and methods section. Statistically significant differences were found for the CTLA4Fcε treatment in the group of non‐dividing cells (labelled as ‘0’) [0·0 nm (37·1 ± 17·7%) and 0·1 nm (32·5 ± 15·3%) versus 10 nm (58·4 ± 28·7%)], and in the group of cells experiencing three rounds of cell division [0·0 nm (22·2 ± 11·4%) and 0·1 nm (23·3 ± 11·2%) versus 10 nm (12·6 ± 7·5%)]. For the abatacept treatment, statistically significant differences were also found in the group of non‐dividing cells [0·0 nm (46·9 ± 17·7%) and 0·1 nm (52·6 ± 22·5%) versus 100 nm (85·8 ± 12·1%)], as well as in the group of cells experiencing three rounds of cell division [0·0 nm (19·7 ± 7·2%) and 0·1 nm (16·9 ± 8·6%) versus 100 nm (4·2 ± 4·8%)]. All of the CTLA4Fcε experiments – and abatacept experiments ■, ○, ▲, ▵, ʘ, and ▼ – shown in (a) were included for the analysis. *P < 0·05; **P < 0·1.
Discussion
Here we report on the production and characterization of a soluble fusion protein, CTLA4Fcε, consisting of the extracellular domain of mouse CTLA‐4 fused to a human immunoglobulin ε chain‐constant region lacking Cε1. CTLA4Fcε is synthesized by a stably transfected mammalian cell line, and secreted into the culture medium as a disulphide‐linked homodimer with an apparent MW of ~145 000–150 000. Treatment of CTLA4Fcε with a thiol reducing agent rendered polypeptide monomers of ~70 000. The apparent molecular size of CTLA4Fcε monomers is about 20 000 higher than it would be expected according to the estimate from its DNA sequence (~50 000). As the cell line used for production of CTL4Fcε also secretes human immunoglobulin λ L chains, attempts were made to investigate an eventual association between CTL4Fcε and immunoglobulin λ chains. Evidence of such interaction was not found by either ELISA or immunoblotting. No further studies were implemented to clarify this discrepancy, but several glycosylation sites exist in the fragment of the constant portion of the immunoglobulin ε chain52 and one in the extracellular domain of CTLA‐453 present in the chimera. Carbohydrate chains attached to these sites could partially explain the difference between the expected and observed CTLA4Fcε molecular sizes. At present, it is not clear whether CTL4Fcε is glycosylated.
According to our current knowledge most, if not all, of the documented pathophysiological properties of IgE stem from interactions with its cellular receptors, FcεRI and FcεRII (CD23). Here we showed that CTLA4Fcε binds specifically to FcεRI, expressed on the surface of two different cell lines as well as on basophils present in human peripheral blood. Our results indicate that CTLA4Fcε binding occurs via the α subunit of FcεRI, where the IgE‐binding sites are located. Moreover, the evidence presented shows that CTLA4Fcε blocks the binding of IgE to FcεRI in a concentration‐dependent manner. Interestingly, this blocking effect is particularly efficient when CTLA4Fcε is tested on human peripheral blood basophils under non‐saturating conditions of the receptor. The efficient blockade of the IgE binding to FcεRI on human basophils by CTLA4Fcε may be related to the previously reported expression of CD80/CD86 on these cells,54 which perhaps allows for a dual binding of CTLA4Fcε to FcεRI and these co‐stimulatory molecules on the cell surface.
Taken together, these results strongly support the notion that CTLA4Fcε specifically associates with the IgE‐binding site(s) in human FcεRI. By binding to FcεRI on mast cells and basophils, CTLA4Fcε may prevent or reduce allergen‐specific or self‐reactive IgE sensitization and degranulation of effector cells during pathological situations associated with the Th2 immune response.
Our results also indicate that CTLA4Fcε associates specifically with the low‐affinity receptor for IgE, FcεRII/CD23, at the IgE‐binding site, and with the CD28/CTLA‐4‐binding sites on human CD80 and CD86. Furthermore, during competitive assays CTLA4Fcε, but not IgE, efficiently blocked the association of a fluorescent anti‐CD23 probe to CD23 displayed on the surface of CD80‐ and CD86‐expressing human B‐lymphoblastoid cells. This observation led us to propose that probably each CTLA4Fcε molecule binds simultaneously to CD23 and to CD80 and/or CD86 on the cell surface. Hence, CTLA4Fcε binding to CD23 appears stronger than that of IgE in flow cytometric analyses. Interestingly, CTLA4Fcε – but not IgE – reduced the accumulation of sCD23 in supernatants harvested from cultures of these lymphoblastoid cells in a concentration‐dependent manner. Therefore, CTLA4Fcɛ might form simultaneous associations with CD80/CD86 and CD23, leading to the formation of multi‐molecular complexes that are either internalized or pose a steric hindrance to proteolytic cleavage by ADAM10, blocking CD23 shedding. Alternatively, mCD23 may still be cleaved, but its association with CD80/CD86‐bound CTLA4Fcε may keep CD23 attached to the cell membrane, resulting in a reduction of sCD23 content at the soluble phase. Oligomeric organization of CD80/CD86 leading to multivalent binding has previously been suggested to explain the high avidity binding of CTLA4Ig to antigen‐presenting cells.55 A similar situation, involving CD23, can occur with CTLA4Fcε in the model presented here. Regardless of the veracity of any of these interpretations, it is tempting to speculate on the effect(s) of CTLA4Fcε in a more physiological or pathophysiological context, i.e. during the events that lead to IgE class‐switching in activated B cells. Increased expression of mCD23 has been documented in IL‐4‐, CD40L‐ or IL‐4/CD40L‐stimulated B cells.56, 57, 58 The mCD23 can be enzymatically converted into sCD23, which in humans acts – in concert with IL‐4 and CD40L – as a proliferation stimulating B‐cell factor, inducing IgE class‐switching and synthesis. Hence, by preventing or reducing the production of sCD23 under conditions of B‐cell activation biased to the generation of IgE‐producing plasma cells, CTLA4Fcε might stop/reduce B‐cell proliferation and/or IgE class switch and synthesis. In this way, CTLA4Fcε could indirectly diminish the IgE levels, which are frequently increased in Th2‐related pathologies.
Another possible point of immunomodulation by CTLA4Fcε would be during the activation, proliferation and differentiation of T cells. Here, we provide evidence that CTLA4Fcε suppresses the lymphocyte proliferation occurring in human PBMCs stimulated in vitro with Con A, at levels similar to those reached using the structurally related molecule abatacept. Under the experimental conditions used, both CTLA4Fcε and abatacept significantly reduced the proportions of cells that experienced three rounds of cell division and, concomitantly, produced an accumulation of cells in the non‐dividing fraction. A large body of evidence supports the idea that abatacept's mode of action occurs mainly through blocking CD28–CD80/CD86 co‐stimulatory interactions, which hampers subsequent T‐cell activation.59, 60 Through its CTLA‐4 portion, CTLA4Fcε probably acts in a similar fashion. However, as we have shown, the Fcε portion provides CTLA4Fcε with novel properties not present in the structurally related molecules abatacept or belatacept.
In summary, we succeeded in producing a soluble recombinant fusion protein, CTLA4Fcε, which interferes with the in vitro proliferation of human peripheral blood lymphocytes, as well as with IgE–FcεR interactions, leading to a significant reduction in the accumulation of soluble CD23. As these processes are all of fundamental importance for the generation of IgE‐secreting plasma cells and for the regulation of IgE levels, CTLA4Fcε may prove useful in the clinical setting for the control of IgE‐mediated immune disorders and related pathologies.
Authors’ contributions
NS did the molecular biology work. MAMG carried out DNA expression, immunoassays and participated in parts of the study design. DPW produced and purified the proteins, carried out immunoassays, participated in parts of the study design and drafted the manuscript. RB, VP, MAMG and DPW carried out receptor‐binding studies. KD and DPW carried out lymphoproliferation assays and performed statistical analyses. JF participated in parts of the study design and drafted the manuscript. RMA conceived the study, participated in its design and coordination, and drafted the manuscript. All authors read and approved the final manuscript.
Disclosures
The authors declare no competing interests.
Acknowledgements
We thank Doneyla Duque for biostatistical advice and analyses, Dr Pedro Rivas‐Vetencourt (Universidad Central de Venezuela) for giving plasmid pcCTLA4HA, Drs Jean‐Pierre Kinet and Manuel Penichet (UCLA) for giving FcεRIα‐humanized cell lines, Drs Pierre Deglesne and Maria Elena Marquez (IVIC) for advice on CFSE‐proliferation assays, and Drs Birgit Scheel and Diana Perez‐Witzke for linguistic assistance. We also thank assistants Margot Romero and Joel Piñango for their secretarial and laboratory work. Financial support was granted by the Instituto Venezolano de Investigaciones Científicas (IVIC). MAMG was supported by a Fondo Nacional de Ciencia, Innovación y Tecnología (FONACIT) scholarship.
References
- 1. Forsthuber TG, Ji N. Quo vadis Th1 and Th2 cells in autoimmunity and infectious diseases: Th17 cells, the new kid on the block. Exp Rev Clin Immunol 2007; 3:251–4. [DOI] [PubMed] [Google Scholar]
- 2. Charles N, Hardwick D, Daugas E, Illei GG, Rivera J. Basophils and the T helper 2 environment can promote the development of lupus nephritis. Nat Med 2010; 16:701–7. [DOI] [PMC free article] [PubMed] [Google Scholar]
- 3. Galli SJ, Tsai M. IgE and mast cells in allergic disease. Nat Med 2012; 18:693–704. [DOI] [PMC free article] [PubMed] [Google Scholar]
- 4. Holgate S, Casale T, Wenzel S, Bousquet J, Deniz Y, Reisner C. The anti‐inflammatory effects of omalizumab confirm the central role of IgE in allergic inflammation. J Allergy Clin Immunol 2005; 115:459–65. [DOI] [PubMed] [Google Scholar]
- 5. Nagel A, Lang A, Engel D, Podstawa E, Hunzelmann N, de Pita O et al Clinical activity of pemphigus vulgaris relates to IgE autoantibodies against desmoglein 3. Clin Immunol 2010; 134:320–30. [DOI] [PubMed] [Google Scholar]
- 6. Charles N, Rivera J. Basophils and autoreactive IgE in the pathogenesis of Systemic Lupus Erythematosus. Curr Allergy Asthma Rep 2011; 11:378–87. [DOI] [PMC free article] [PubMed] [Google Scholar]
- 7. Söderström L, Kober A, Ahlstedt S, de Groot H, Lange CE, Paganelli R et al A further evaluation of the clinical use of specific IgE antibody testing in allergic diseases. Allergy 2003; 58:921–8. [DOI] [PubMed] [Google Scholar]
- 8. Borish L, Chipps B, Deniz Y, Gujrathi S, Zheng B, Dolan CM. Total serum IgE levels in a large cohort of patients with severe or difficult‐to‐treat asthma. Ann Allergy Asthma Immunol 2005; 95:247–53. [DOI] [PubMed] [Google Scholar]
- 9. Arm JP, Bottoli L, Skerjanec A, Floch D, Groenewegen A, Maahs S et al Pharmacokinetics, pharmacodynamics and safety of QGE031 (ligelizumab), a novel high‐affinity anti‐IgE antibody, in atopic subjects. Clin Exp Allergy 2014; 44:1371–85. [DOI] [PMC free article] [PubMed] [Google Scholar]
- 10. Stokes JR, Casale TB. Allergic rhinitis and asthma: celebrating 100 years of immunotherapy. Curr Opin Immunol 2011; 23:808–13. [DOI] [PubMed] [Google Scholar]
- 11. Gould HJ, Takhar P, Harries HE, Durham SR, Corrigan CJ. Germinal‐centre reactions in allergic inflammation. Trends Immunol 2006; 27:446–52. [DOI] [PubMed] [Google Scholar]
- 12. Eckl‐Dorna J, Niedelberger V. What is the source of serum allergen‐specific IgE? Curr Allergy Asthma Rep 2013; 13:281–7. [DOI] [PubMed] [Google Scholar]
- 13. Kikutani H, Suemura M, Owaki H, Nakamura H, Sato R, Yamasaki K et al Fcε receptor, a specific differentiation marker transiently expressed on mature B cells before isotype switching. J Exp Med 1986; 164:1455–69. [DOI] [PMC free article] [PubMed] [Google Scholar]
- 14. Yokota A, Kikutani H, Tanka T, Sato R, Barsumian EL, Suemura M et al Two species of human Fcε receptor II (FcεRII/CD23): tissue‐specific and IL‐4 specific regulation of gene expression. Cell 1988; 55:611–18. [DOI] [PubMed] [Google Scholar]
- 15. Lemieux GA, Blumenkron F, Yeung N, Zhou P, Williams J, Grammer AC et al The low‐affinity IgE receptor (CD23) is cleaved by the metalloproteinase ADAM10. J Biol Chem 2007; 282:1436–44. [DOI] [PMC free article] [PubMed] [Google Scholar]
- 16. Gordon J, Cairns JA, Milsum MJ, Guy GR. Interleukin‐4 and soluble CD23 as progression factors for human B‐lymphocytes: analysis of their interactions with agonists of the phosphoinositide ‘dual pathway’ of signalling. Eur J Immunol 1988; 18:1561–5. [DOI] [PubMed] [Google Scholar]
- 17. Jeannin P, Delneste Y, Lecoanet‐Henchoz S, Gretener D, Bonnefoy J‐Y. Interleukin‐7 (IL‐7) enhances class switching to IgE and IgG4 in the presence of T cells via IL‐9 and sCD23. J Immunol 1998; 91:1355–61. [PubMed] [Google Scholar]
- 18. Saxon A, Ke Z, Bahati L, Stevens RH. Soluble CD23 containing B cell supernatants induce IgE from peripheral blood B‐lymphocytes and costimulate with IL‐4 in induction of IgE. J Allergy Clin Immunol 1990; 86:333–44. [DOI] [PubMed] [Google Scholar]
- 19. Aubry JP, Pochon S, Graber P, Jansen KU, Bonnefoy JY. CD21 is a ligand for CD23 and regulates IgE production. Nature 1992; 358:505–7. [DOI] [PubMed] [Google Scholar]
- 20. Christie G, Barton A, Bolognese B, Buckle DR, Cook RM, Hansbury MJ et al IgE secretion is attenuated by an inhibitor of proteolytic processing of CD23 (FcɛRII). Eur J Immunol 1997; 27:3228–35. [DOI] [PubMed] [Google Scholar]
- 21. Gould HJ, Sutton BJ. IgE in allergy and asthma today. Nat Rev Immunol 2008; 8:205–17. [DOI] [PubMed] [Google Scholar]
- 22. Conrad DH, Ford JW, Sturgill JL, Gibb DR. CD23: an overlooked regulator of allergic disease. Curr Allergy Asthma Rep 2007; 7:331–7. [DOI] [PubMed] [Google Scholar]
- 23. Rosenwasser LJ, Busse WW, Lizambri RG, Olejnik TA, Totoritis MC. Allergic asthma and an anti‐CD23 mAb (IDEC‐152): results of a phase I, single‐dose, dose‐escalating clinical trial. J Allergy Clin Immunol 2003; 112:563–70. [DOI] [PubMed] [Google Scholar]
- 24. Cooper AM, Hobson PS, Jutton MR, Kao MW, Drung B, Schmidt B et al Soluble CD23 controls IgE synthesis and homeostasis in human B cells. J Immunol 2012; 188:3199–207. [DOI] [PMC free article] [PubMed] [Google Scholar]
- 25. Munoz O, Brignone C, Grenier‐Brossette N, Bonnefoy J‐Y, Cousin J‐L. Binding of anti‐CD23 monoclonal antibody to the leucine zipper motif of FcɛRI/CD23 on B cell membrane promotes its proteolytic cleavage. J Biol Chem 1998; 273:31795–800. [DOI] [PubMed] [Google Scholar]
- 26. Hibbert R, Teriete P, Grundy G, Beavil RL, Reljic R, Holers VM et al The structure of human CD23 and its interactions with IgE and CD21. J Exp Med 2005; 202:751–60. [DOI] [PMC free article] [PubMed] [Google Scholar]
- 27. Mathews JA, Ford J, Norton S, Kang D, Dellinger A, Gibb DR et al A potential new target for asthma therapy: a Disintegrin and Metalloprotease 10 (ADAM10) involvement in murine experimental asthma. Allergy 2011; 66:1193–200. [DOI] [PMC free article] [PubMed] [Google Scholar]
- 28. Takahashi T, Tagami T, Yamazaki S, Uede T, Shimizu J, Sakaguchi N et al Immunologic self‐tolerance maintained by CD25+CD4+ regulatory T cells constitutively expressing cytotoxic T lymphocyte‐associated antigen 4. J Exp Med 2000; 192:303–9. [DOI] [PMC free article] [PubMed] [Google Scholar]
- 29. Thompson CB, Allison JP. The emerging role of CTLA‐4 as an immune attenuator. Immunity 1997; 7:445–50. [DOI] [PubMed] [Google Scholar]
- 30. Leung HT. Bradshaw, Cleveland JS, Linsley PS. Cytotoxic T lymphocyte‐associated molecule‐4, a high avidity receptor for CD80 and CD86, contains an intracellular localization motif in its cytoplasmic tail. J Biol Chem 1995; 270:25107–14. [DOI] [PubMed] [Google Scholar]
- 31. Wing K, Yamaguchi T, Sakaguchi S. Cell‐autonomous and non‐autonomous roles of CTLA‐4 in immune regulation. Trends Immunol 2011; 32:428–33. [DOI] [PubMed] [Google Scholar]
- 32. Weinblatt ME, Schiff M, Valente R, van der Heijde D, Citera G, Zhao C et al Head‐to‐head comparison of subcutaneous abatacept versus adalimumab for rheumatoid arthritis: findings of a phase IIIb, multinational, prospective, randomized study. Arthritis Rheum 2013; 65:28–38. [DOI] [PMC free article] [PubMed] [Google Scholar]
- 33. Durrbach A, Pestana JM, Pearson T, Vincenti F, Garcia VD, Campistol J et al A phase III study of Belatacept versus Cyclosporine in Kidney transplants from extended criteria donors (BENEFIT‐EXT Study). Am J Transplant 2010; 10:547–57. [DOI] [PubMed] [Google Scholar]
- 34. Montano RF, Penichet ML, Blackall DP, Morrison SL, Chintalacharuvu KR. Recombinant polymeric IgG anti‐Rh: a novel strategy for development of direct agglutinating reagents. J Immunol Methods 2009; 340:1–10. [DOI] [PubMed] [Google Scholar]
- 35. Romano EL, Montano RF, Brito B, Apitz R, Alonso J, Romano M et al Effects of AjoN on lymphocyte and macrophage membrane‐dependent functions. Immunopharmacol Immunotoxicol 1997; 19:15–36. [DOI] [PubMed] [Google Scholar]
- 36. Chomczynski P, Sacchi N. Single‐step method of RNA isolation by acid guanidinium thiocyanate‐phenol‐chloroform extraction. Anal Biochem 1987; 162:156–9. [DOI] [PubMed] [Google Scholar]
- 37. Sambrook J, Russell DW, eds. Molecular Cloning: A Laboratory Manual, 3rd edn New York: Cold Spring Harbor Laboratory Press, 2001. [Google Scholar]
- 38. Wan T, Beavil RL, Fabiane SM, Beavil AJ, Sohi MK, Keown M et al The crystal structure of IgE Fc reveals an asymmetrically bent conformation. Nat Immunol 2002; 3:681–6. [DOI] [PubMed] [Google Scholar]
- 39. McCloskey N, Hunt J, Beavil RL, Jutton MR, Grundy GJ, Girardi E et al Soluble CD23 monomers inhibit and oligomers stimulate IgE synthesis in human B cells. J Biol Chem 2007; 282:24083–91. [DOI] [PubMed] [Google Scholar]
- 40. Mallik N, Kallestad JC, Gunderson NL, Austin SD, Neubauer MG, Ochs V et al Molecular cloning, sequence analysis, and functional expression of a novel growth regulator, Oncostatin M. Mol Cell Biol 1989; 9:2847–53. [DOI] [PMC free article] [PubMed] [Google Scholar]
- 41. Horton RM. In vitro recombination and mutagenesis of DNA. SOEing together tailor‐made Genes In: White BA, ed. PCR Cloning Protocols. From Molecular Cloning to Genetic Engineering. Volume 67 of “Methods in Molecular Biology”. Totowa, NJ: Humana Press, 1997:141–9. [DOI] [PubMed] [Google Scholar]
- 42. Bird RE, Hardman KD, Jacobson JW, Johnson S, Kaufman BM, Lee SM et al Single‐chain antigen binding proteins. Science 1988; 242:423–6. [DOI] [PubMed] [Google Scholar]
- 43. Kurien BT, Scofield RH. Western Blotting. Methods 2006; 38:283–93. [DOI] [PubMed] [Google Scholar]
- 44. Ioan‐Facsinay A, de Kimpe SJ, Hellwig SMM, van Lent PL, Hofhuiss FMA, van Ojik HH et al FcγRI (CD64) contributes substantially to severity of arthritis, hypersensitivity responses, and protection from bacterial infection. Immunity 2002; 16:391–402. [DOI] [PubMed] [Google Scholar]
- 45. Parish CR, Warren HS. Use of the intracellular fluorescent dye CFSE to monitor lymphocyte migration and proliferation. Curr Protoc Immunol 2001; 49:4.9.1–9.10. [DOI] [PubMed] [Google Scholar]
- 46. Max EE, Battey J, Ney R, Kirsch I, Leder P. Duplication and deletion in the human immunoglobulin ε genes. Cell 1982; 29:691–9. [DOI] [PubMed] [Google Scholar]
- 47. Leitzgen K, Knittler MR, Haas IG. Assembly of immunoglobulin light chains as a prerequisite for secretion. J Biol Chem 1997; 272:3117–23. [DOI] [PubMed] [Google Scholar]
- 48. Takai T, Yuuki T, Iwamoto‐Yasue N, Okimura K, Ra C. Epitope analysis and primary structures of variable regions of anti‐human FcεRI monoclonal antibodies, and expression of the chimeric antibodies fused with human constant regions. Biosci Biotechnol Biochem 2000; 64:1856–67. [DOI] [PubMed] [Google Scholar]
- 49. Azuma M, Yssel H, Phillips JH, Spits H, Lanier LL. Functional expression of B7/BB1 on activated T lymphocytes. J Exp Med 1993; 177:845–50. [DOI] [PMC free article] [PubMed] [Google Scholar]
- 50. Engel P, Gribben JG, Freeman GJ, Zhou LJ, Nozawa Y, Abe M et al The B7‐2 (B70) costimulatory molecule expressed by monocytes and activated B lymphocytes is the CD86 differentiation antigen. Blood 1994; 84:1402–7. [PubMed] [Google Scholar]
- 51. Pirron U, Schlunck T, Prinz JC, Rieber EP. IgE‐dependent antigen focusing by human B lymphocytes is mediated by the low‐affinity receptor for IgE. Eur J Immunol 1990; 20:1547–51. [DOI] [PubMed] [Google Scholar]
- 52. Arnold JN, Wormald MR, Sim RB, Rudd PM, Dwek RA. The impact of glycosylation on the biological function and structure of human immunoglobulins. Annu Rev Immunol 2007; 25:21–50. [DOI] [PubMed] [Google Scholar]
- 53. Teft WA, Kirchhof MG, Madrenas J. A molecular perspective of CTLA‐4 function. Annu Rev Immunol 2006; 24:65–97. [DOI] [PubMed] [Google Scholar]
- 54. Voskamp AL, Prickett SR, Mackay F, Rolland JM, O'Hehir RE. MHC class II expression in human basophils: induction and lack of functional significance. PLoS ONE 2013; 8:e81777. [DOI] [PMC free article] [PubMed] [Google Scholar]
- 55. Greene JL, Leytze GM, Emswiler J, Peach R, Bajorath J, Cosand W et al Covalent dimerization of CD28/CTLA‐4 and oligomerization of CD80/CD86 regulate T cell costimulatory interactions. J Biol Chem 1996; 271:26762–71. [DOI] [PubMed] [Google Scholar]
- 56. Kim S‐H, Lee C‐E. Counter‐regulation mechanism of IL‐4 and IFN‐α signal transduction through cytosolic retention of the pY‐STAT6:pYSTAT2:p48 complex. Eur J Immunol 2011; 41:461–72. [DOI] [PubMed] [Google Scholar]
- 57. Saeland S, Duvert V, Moreau I, Banchereau J. Human B‐cell precursors proliferate and express CD23 after CD40 ligation. J Exp Med 1993; 178:113–20. [DOI] [PMC free article] [PubMed] [Google Scholar]
- 58. Paterson RLK, Lack G, Domenico JM, Delespesse G, Leung DYM, Finkel TH et al Triggering through CD40 promotes interleukin‐4‐induced CD23 production and enhanced soluble CD23 release in atopic disease. Eur J Immunol 1996; 26:1979–84. [DOI] [PubMed] [Google Scholar]
- 59. Weisman MH, Durez P, Hallegua D, Aranda R, Becker JC, Nuamah I et al Reduction of inflammatory biomarker response by abatacept in treatment of rheumatoid arthritis. J Rheumatol 2006; 33:2162–6. [PubMed] [Google Scholar]
- 60. von Kempis J, Dudler J, Hasler P, Kyburz D, Tyndall A, Zufferey P et al Use of abatacept in rheumatoid arthritis. Swiss Med Wkly 2012; 142:w13581. [DOI] [PubMed] [Google Scholar]