

Abstract
Obstructive sleep apnea (OSA) is a common sleep disorder found in 24% of adult men and 9% of adult women. Although continuous positive airway pressure (CPAP) has emerged as a standard therapy for OSA, a majority of patients are not tolerant to this treatment, largely because of the uncomfortable nasal air delivery during their sleep. Recent advances in wireless communication and advanced (“bigdata”) preditive analytics technologies offer radically new point-of-care treatment approaches for OSA episodes with unprecedented comfort and afforadability. We introduce a Dirichlet process-based mixture Gaussian process (DPMG) model to predict the onset of sleep apnea episodes based on analyzing complex cardiorespiratory signals gathered from a custom-designed wireless wearable multisensory suite. Extensive testing with signals from the multisensory suite as well as PhysioNet's OSA database suggests that the accuracy of offline OSA classification is 88%, and accuracy for predicting an OSA episode 1-min ahead is 83% and 3-min ahead is 77%. Such accurate prediction of an impending OSA episode can be used to adaptively adjust CPAP airflow (toward improving the patient's adherence) or the torso posture (e.g., minor chin adjustments to maintain steady levels of the airflow).
Keywords: Sleep apnea, Gaussian mixture model, Nonlinear dynamical systems, Biomedical telemetry
I. Introduction
Obstructive sleep apnea (OSA) is a common sleep disorder that affects 24% of adult men and 9% of adult women [1], and is symptomatic in a third of that population. An OSA episode is marked by the obstruction of pharyngeal airways resulting in interruption of the airflow during sleep. It is known to reduce sleep quality and affect allied physiological processes vital for the cognitive and restorative functions of sleep [2]. Furthermore, due to irregular sympathetic stimulation at the end of the obstructive phase, untreated OSA patients are also at increased risk for developing cardiovascular disorders, such as hypertension, coronary artery diseases, and stroke [3].
Noninvasive ventilation therapies, such as continuous positive airway pressure (CPAP), which are based on delivering air at a pre-determined pressure into the pharynx, and other oral appliances designed to prevent throat constrictions and deliver oxygen to the lungs continuously are used to treat OSA. Such treatments can minimize the severity of sleep apnea (measured in terms of an apnea-hypoapnea index AHI) and thereby improve sleep quality, subjective wellness, and mental health, and reduce stroke risk [4].
Despite its wide use, an estimated 46–83% of patients with OSA have been reported to be nonadherent to the use of CPAP beyond four hours. The main reason is that CPAP devices often over-treat air supply to accommodate the differences in respiration patterns during the different sleep stages (e.g., REM, N1, N2) [5], and such excessive unconditioned airflow often leads to extreme nasal dryness and congestion [6], [7]. As an improvement over conventional CPAP, auto-adjustable CPAP, also referred to as APAP devices, can automatically adjust the pressure level based on the patterns gleaned from the sensor measurements of physiological factors such as sleep stage, snoring severity, oxygen saturation, and respiratory impedance. However, the therapeutic effectiveness of APAP's rather reactive, intermittent adjustment of pressures based on the measurements has been questioned [8], [9]. Also, due to the costs associated with the sensors for measuring multiple physiological variables, as well as the need (for an expensive pump) to effect sudden changes in the pressures and flow rates in response to sensor measurements, APAP devices tend oftentimes to be prohibitively expensive. The forecasting of OSA events using the information gathered from one channel of ECG signal for effecting proactive adjustments of airflow and body positions would provide a cost-effective means to mitigate OSA and improve the adherence of the patient to the CPAP therapy. Such a prediction-based approach requires a wearable multisensory suite for continuous data acquisition during sleep and methods to track and forecast the evolution of cardiorespiratory dynamics from measured signals. While some advances in wearable sensors for sleep monitoring have been reported, little, if any, work has been reported towards using signals acquired from these units for the prediction of OSA episodes.
In this paper, we introduce a method based on using data gathered from a wireless wearable multisensory suite to predict the occurrence of sleep apnea events. A preliminary version of this paper was presented at an earlier conference [10]. A unique wireless wearable multisensory suite has been developed to continuously collect cardiac and respiratory signals in real-time during sleep. Quantifiers of the coupled nonlinear and nonstationary cardiorespiratory dynamics underlying the measured signals [11] are used as the inputs to predict the onset of sleep apnea events. We developed a novel Dirichlet process based mixture Gaussian process (DPMG) model to predict the complex evolution of the OSA signatures. As mentioned above, these predictions can be timely for automatic adjustment of airway pressure patterns in CPAP, supplemental oxygen devices, or to change the body posture, such as a slight adjustment of torso or chin position to avert the collapse of the airways, which precedes an OSA episode. Continuous OSA monitoring and prediction using the wireless wearable multisensory suite can thus improve the efficiency of OSA treatment, especially in out-of-hospital, point-of-care settings.
II. Background and Literature Review
The field of medicine is on the verge of transformation, where healthcare will be provided on a personal basis to prevent an illness rather than treat it post-trauma. This systems approach to personalized healthcare is based on integrating concepts of systems biology and medicine known as P4: personalized, predictive, preventive, and participatory medicine [12]. Much of the current P4 emphasis is on collecting physiological data from ECG, CAT scan, genomic data, diet, etc., into large data warehouses and using advanced information infrastructures for predicting and monitoring chronic non-communicable diseases [12], [13]. It has also been noted that early detection of acute disease episodes through noninvasive monitoring is effective for patients with chronic disorders because treatment costs escalate exponentially with delay in detection [14].
Among chronic conditions, OSA and sleep-related breathing disorders affect one-fourth of the US population [15]. Several OSA detection and prediction approaches based on correlating the statistical patterns of heart rate, respiration rate, and oxygen saturation (SpO2) signals during OSA episodes have been attempted [16]. for example, spectral energy of intrinsic mode functions was extracted from the empirical mode decomposition of flow rate signals (from a CPAP machine) to estimate the likelihood of OSA episodes [17]. Similarly, discrete wavelet transformation coefficients of the thoracic effort signals have been used as the inputs for neural network to identify subjects with OSA [18]. Although considerable attention has been given to OSA detection methods, prediction (forecast) of an impending OSA episode, necessary for calibrating CPAP therapy, has not been reported in the literature. The few currently reported (e.g., dynamic belief networks [19], [20]) use limited data from OSA patients to predict OSA episodes  ahead or just to predict the evolution of the physiological signals (i.e., heart rate, chest volume, blood oxygen saturation). These methods do not capture variations in the nonlinear and nonstationary dynamics of the cardiorespiratory system responsible for the onset of OSA or sleep-related breathing disorder events. Also, the development of a wearable multisensory unit that would facilitate gathering the signals necessary for prediction without causing palpable discomfort remains elusive. The present work is aimed at addressing these gaps.
The present approach uses a wearable multisensory wireless unit customizable to the specific conditions of the patient such as age, gender, BMI, and diseases for continuous monitoring and prediction of OSA episodes. Also, since the underlying cardiorespiratory dynamics are nonlinear, signal analysis, and prediction methods based on the nonlinear and nonstationary characteristics were investigated to establish these relationships.
III. Research Approach
The key contributions of the present research are in (a) the development of an economical, wearable wireless multisensory unit capable of measuring signals essential for sleep monitoring, including ECG, heart sound, respiration, and SPO2, synchronously without posing significant discomfort or constraints on motion, and (b) a method to provide accurate prediction of an impending OSA episode by considering the nonlinear and nonstationary cardiorespiratory dynamics underlying the measured signals and the features extracted therefrom. As summarized in Fig. 1, we use data from Apnea-ECG database (from Physionet.org) as well as signals gathered from our wearable multisensory unit for training and testing of the predictor and classifier. While the Apnea-ECG database consists of signals gathered from chronic OSA patients, the signals from the wearable multisensory unit were gathered from mostly healthy subjects (to assess false positive rates). Various quantifiers of the topology of the nonlinear attractor of cardiorespiratory dynamics reconstructed from the measured signals were extracted as features  to identify an OSA event using a support vector machine (SVM) classifier. The evolution of
  was tracked using a nonparametric Dirichlet process based mixture Gaussian process (DPMG) prediction method that effectively captures nonlinear nonstationary dynamics. The
  -step (minutes) look-ahead predictions
  of feature values were used to detect an impending OSA episode 1–3 minutes before the event takes place with an accuracy of 70–90%. Such predictions can be vital to initiate adjustments or therapeutic interventions to avert an impending OSA episode [21]. The remainder of this section describes the two main contributions of this paper, namely the multisensory suite and the OSA prediction method.
Fig. 1.
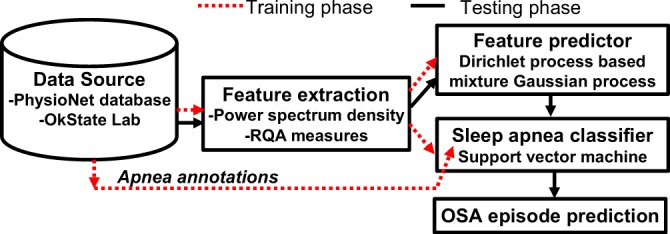
Overview of the approach for OSA episode prediction.
A. Wireless Wearable Multisensory Platform
We have developed a multisensory platform capable of synchronously gathering multiple heterogeneous signals, including VCG, ECG, sound, and respiration (see Fig. 2 for screenshot of real-time streaming VCG, 3-D color coded VCG, and a standard display of 12-lead derived ECG), and wirelessly transmitting the data to a host computer for online OSA prediction and subsequent therapeutic decision support. Such multi-channel data is necessary to track the dynamic decouplings known to precede the state transitions that lead to the onset of OSA episodes. Novel aspects of the proposed multi-sensor unit are as follows. (1) The sensors are judiciously chosen to capture the complementary aspects of the heart operation, viz. electrical (ECG), acoustic (sound), and mechanical (respiration). (2) Due to the use of MEMS technology, the total footprint of the wireless unit is highly adjustable and remains lightweight, and hence highly wearable. (3) The hardware platform in this context contributes towards affordable, yet powerful, and early warning (prognostic) systems for sleep apnea treatment. (4) The wireless (Bluetooth) platform along with the sensors and microprocessor components are integrated into a customized garment to continuously monitor and predict sleep apnea episodes [22]. The wireless design utilizes a Class I Bluetooth device with response frequency range of 0.176–90 Hz, sampling rate of up to 2 kHz, and 16 bit resolution.
Fig. 2.
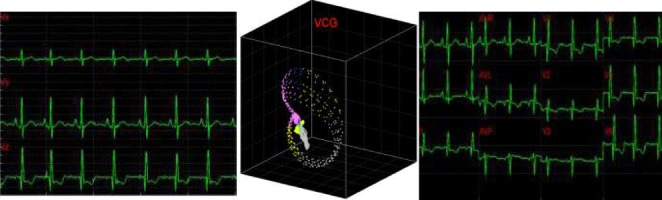
Screenshot of 3-channel streaming VCG, 3-D color coded dynamic VCG, and 12-lead transformed ECG signals.
We have embedded the multisensory platform as part of a sleepwear shirt (see Fig. 3) to enhance the wearability of the sensor suite. The fusion of information from VCG, heart sound, and respiration provide adequate information to track variations and detect transitions in cardiorespiratory dynamics during sleep.
Fig. 3.

A prototype of the wireless wearable multisensory suite.
B. Prediction Model
Among nonparametric prediction models, Gaussian process (GP) can simplify the modeling efforts, but the computational overhead with covariance matrix inversion scales as a cube of the signal length and the assumption of a stationary covariance function impede its wide applications. In our previous work [23], we used local Gaussian process (LGP) to address the nonstationarity issue. We used local topological characteristics including recurrence properties of dynamics reconstructed from a signal to partition the signal into near-stationary segments. While prior investigations suggest that LGP can be effective in predicting the evolution of nonlinear nonstationary processes, one needs to specify the threshold of a correlation index to determine the boundaries in the state space. Furthermore, estimation of the topological characteristics (in the form of recurrence maps) can be computationally intensive and somewhat sensitive to parameters such as the threshold. Towards addressing this limitation, we have investigated a Dirichlet process based Gaussian process mixture (DPMG) model to predict the evolution of the signal features.
In the DPMG model, the state space reconstructed from a signal feature is partitioned into various clusters using a Dirichlet process [24], such that each cluster follows a multivariate Gaussian distribution. A local GP expert  can be fitted for each cluster. A GP expert model [23] seeks a mapping
  where
where  is the input vector for the prediction model comprised of historic realizations of an extracted feature,
  is the output (“future feature”), and
  . In DP, the symmetric prior assignment probability for
  clusters can be given as [24]
 |
where  is a concentration parameter. This is conjugate to the multinomial distribution of cluster indicators of
  data points,
  (where
  is the number of data points in each cluster,
  ). The following holds for the posterior distribution:
 , and
, and
 |
That said,  , and as
  , we can update the posterior indicator distribution using Gibbs sampling
 |
where  is the number of data points in cluster
  before the assignment of data point
  . The distribution for a new input within a mixture clusteris
  . Here, the parameters
  and
and  are the mean and the covariance for cluster
  , with Gaussian distribution and an inverse Wishart distribution prior, respectively. We can obtain the weight for each cluster as
 |
for a realized signal feature (i.e., input)  , we can obtain local predictions
  from each local GP expert
 |
Here,  and
and  , are the observation samples (input and output) in cluster
  , and
, and  is the covariance matrix defined in terms of a covariance function [23]. Then the prediction for input
  can be expressed as a weighted sum
 |
For multi-step predictions, after the first step, the input to the DPMG model is a Gaussian random vector, as obtained from previous-step prediction. We assume the new input  , where
  and
and  can be estimated from (4). The output distribution in each cluster is given by
 |
The integration in (6) is a complicated function of  , a closed form expression for the output distribution was not sought, and we used a Monte Carlo approach to approximate the expression at the right side of (6) as
 |
where  is the total number of random samples. The expert function is evaluated with samples from the random input distribution
  , and the average is used as the predicted feature value. The performance of the DPMG model for multi-step ahead prediction of sleep apnea was compared as part of the following validation study with that from the Autoregressive Moving Average (ARMA) and Empirical Mode Decomposition (EMD) prediction techniques [25].
C. Clinical Validation
The two sources of data used in this research are collected from the Apnea-ECG Database–Physionet.org and from the wireless multisensory platform developed by COMMSENS (OkState) lab as reported in the foregoing. The first source of data consists of 20 recordings that include an ECG signal sampled at 100 Hz, 16 bit resolution, synchronized with a set of minute-wide apnea annotations. The annotations of sleep apnea are made by a human expert and are based on supplementary signals including chest and abdominal respiratory effort, oronasal airflow, and oxygen saturation signals. The second source of data was collected from six healthy male subjects and two subjects with suspected sleep apnea (age range of 25–40) using the wireless wearable multisensory suite. The subjects participating in this research were trained with professional technicians at the COMMSENS lab to use the devices and the accompanying software. However, because of the nature of the sleep testing procedure, the data collection processes were performed entirely at the subject's home. In addition to the suite, a portable sleep recording device (from Zeo) with automated algorithms to distinguish between sleep and wakefulness stages [26], was used to record the sleep stages and rate the sleep quality using an average sleep score. Both the multisensory suite and the portable sleep monitoring device wirelessly record sleep stages and provide sleep and wakefulness patterns that are quantified into four stages of sleep: wakefulness, rapid eye movement (REM) sleep, light sleep (combined Stages 1 and 2 of sleep), and deep sleep (combined Stages 3 and 4 of sleep) [27]. The portable sleep recording device with a subject wearing the multisensory suite is shown in Fig. 4. Software with an appropriate graphical user interface was provided to assist subjects with data collection.
Fig. 4.
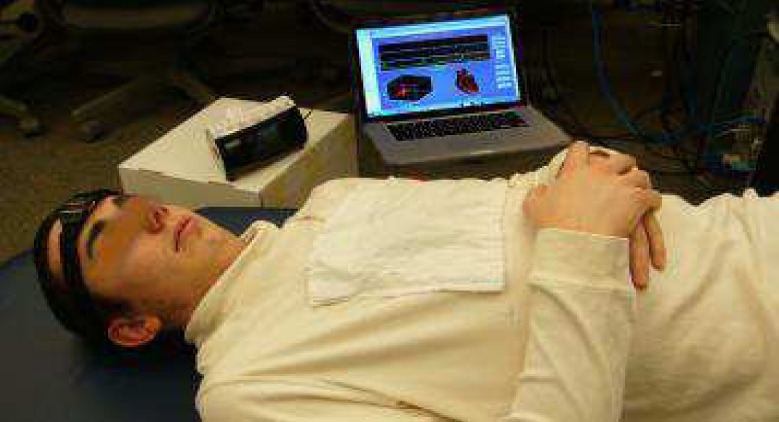
A multisensory suite with portable sleep monitoring device.
The procedure for clinical validation in this paper consists of collecting signals from the multisensory suite and the portable sleep device for two consecutive nights from each subject. for the first experimental epoch (sleep through one night), each subject was requested to use only the sleep device (from Zeo) during sleep. The sleep pattern and quality score from the sleep device were collected. The purpose of this experiment is to collect the sleep quality score of subjects without wearing the multisensory suite, for validation purposes. for the second experimental epoch (i.e., the second night), the subject(s) donned the multisensory suite and used the sleep device. The signals from both devices were collected in real-time and saved in a secure location in a computer accessible via a relational database management system. The purpose of this experiment was to validate the effect of wearing the wireless multisensory suite on sleep quality, as well as to glean circumstantial estimates of the accuracy (sensitivity and specificity) of the predictions compared against the sleep stage transitions recorded by the sleep device and the signals picked up by the sound sensor.
IV. Implementation Details and Results
A. Feature Extraction
First, a band-pass filter with a pass band in the range of 0.06–40 Hz was employed to remove the noise, artifacts, and base-line wandering and retain the critical features for the R peak extraction from the VCG signals. After de-noising, the R peaks of the ECG signal are detected by using wavelet transformation [28]. The heart rate time series known as RR intervals is calculated as the time difference between consecutive R peaks. Abnormal heart rates characterized by at least 80% increase over the previous beats are eliminated. The power spectral density (PSD) of the RR intervals in a low frequency band (0.04 to 0.12 Hz) is used to capture the heart rate variability in OSA patients. The PSD time series is formulated such that each point is the average power spectral density of one minute of the RR interval time series. The normalized PSD (NPSD) feature is considered to account for inter-subject variability.
Recurrence quantification analysis (RQA) is employed to capture the nonlinear and nonstationary characteristics of the RR interval signals. The time delay  , which is determined based on the mutual information test [29], and the embedding dimension
  , based on the false nearest neighbors test [30], were used to reconstruct the phase space. The threshold of the recurrent plot is identified as 10% of the maximum phase space diameters [31]. The RQA features are extracted based on a sliding window concept with a window size of 600 data points and a sliding step of 60 data points corresponding to a 10 min length and a 1 min step of the RR interval time series, respectively. The 10 min length for the sliding window was selected to accommodate the longest likely sleep apnea episode a subject may experience. The sliding step of 60 sec is sufficient to characterize the cyclic variance of the heart rate which ranges from 20 to 60 sec. The recurrence features of each sliding window extracted from the recurrence plot of the 10 min RR interval in the phase space qualify for the recurrent characteristics of heart rate variability in OSA patients. The features extracted from the recurrence plot are the recurrence rate (RR), determinism (DET), average length of the diagonal lines (DIA), length of the longest diagonal line (LMAX), entropy (ENT), laminarity (LAM), trapping time (TT), length of longest vertical line (LVM), recurrence time of 1st type (RT1), recurrence time of 2nd type (RT2), recurrence period entropy density (RENT), and transitivity (TRAN). Further details of these quantifiers are described in Appendix.
B. Classification Model for OSA Identification
We employed a nonlinear support vector machine (SVM) classification model to discern sleep apnea events based on the extracted PSD and RQA features. An SVM classifier separates a set of binary labeled training data with a maximal margin hyper-plane, i.e., it is oriented as far away as possible from the closest members of both classes (known as the support vectors) [32]. If no linear separation exists, the original input space of features  is transformed to another isomorphic space where the training set becomes linearly separable or mostly linearly separable. We need not compute the transform
  explicitly; instead we only need to estimate the inner product of the mapped patterns,
  where
where  denotes the inner product. The inner product is expressed as a linear combination of specified kernel functions. Based on the kernel function used, SVMs are categorized into linear, (Gaussian) radial basis function (RBF), polynomial, and multilayer perceptron classifiers. In the present work, we selected the Gaussian RBF kernel based on its superior performance over other classifiers in K-fold cross validation studies.
To reduce the high dimensionality of the input space (14 features), the features that most effectively classify the input space into sleep apnea and non-apnea groups were selected based on the Kolmogorov-Smirnov (KS) statistic. Fig. 5 shows the KS statistic values of 14 features. The two significant features with the highest KS statistic—NPSD and LVM—were selected as the inputs of the classifier. Fig. 6(a) shows the distribution of the sleep apnea and nonapnea events in the 2D feature space of NPSD and LVM and Fig. 6(b) the classification boundary using Gaussian RBF. It may be noted that the nonapnea feature values are clustered in the green dot circle with low NPSD and LVM values. Table I summarizes the sensitivity and specificity of the classification with different percentages of training data. It is noted that the average sensitivity and specificity for all classification cases are above 75% with standard deviation  even with 10% of the data for training. with 90% of data used for training, the sensitivity and specificity increased remarkably to 92.56% and 86.92%, respectively. The high classification accuracies possible from the SVM model allows the use of the feature values predicted from the DPMG model to forecast the onset of an impending apneic event.
Fig. 5.
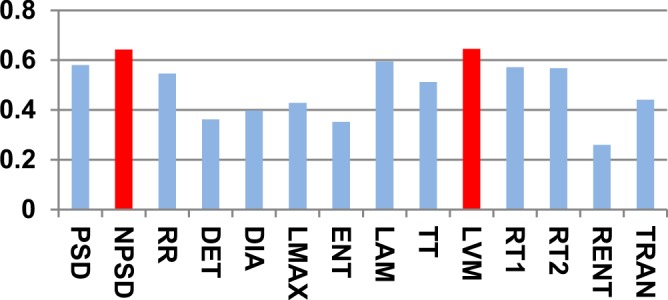
KS statistic variations of extracted features. KS statistic indicates the maximal feature distribution differences between sleep apnea and non-apnea groups.
Fig. 6.
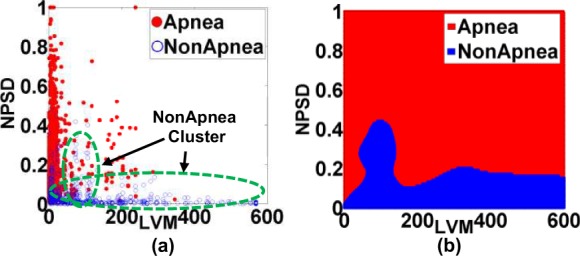
(a) Distribution of apnea and nonapnea events in 2D feature space (NPSD and LVM). (b) The classification boundary of the selected Gaussian RBF kernel used as part of the SVM classifier.
Table I. Comparison of the Accuracy (Sensitivity and Specificity) of Support Vector Machine Classification at Different Training Levels.
| Acc. (%) \Training | Apnea | Non Apnea | ||
|---|---|---|---|---|
| Mean | Std. | Mean | Std. | |
| 10% | 80.82 | 5.63 | 75.52 | 4.45 |
| 50% | 86.75 | 3.24 | 82.45 | 3.25 |
| 90% | 92.56 | 2.88 | 86.92 | 2.24 |
C. Prediction Results
Among the prediction methods tested, DPMG yields the highest  and classification accuracy for different prediction horizons as summarized in Table II. Here we quantified the performance of the feature predictions in terms of the
  statistic, and the performance of overall apnea event forecasts in terms of classification accuracy. It is noted that the DPMG model performs better than the classical ARMA and EMD models both in prediction and classification. Furthermore, when the prediction horizon increases, the accuracy of the DPMG model does not drop significantly. Fig. 7 shows the training and prediction data of the LVM, NPSD features and the sleep apnea status with the prediction point started at the 341st min. It is observed that the DPMG model with different prediction horizons can capture the trend and the amplitude of the observation features. Thus it yields reasonably high prediction accuracies of apnea conditions (i.e., 83% for 1 step-ahead prediction and 77% for 3 step-ahead predictions).
Table II. Comparison of the Accuracies for 1 min and 3 min Look-Ahead Predictions of OSA Episodes with Different Models.
| Method |
 (first/last Step) (first/last Step) |
Classification accuracy (first/last step) |
|---|---|---|
| ARMA | 0.37/0.1 | 0.4/0.03 |
| EMD | 0.45/0 | 0.67/0.53 |
| DPMG | 0.92/0.51 | 0.83/0.77 |
Fig. 7.
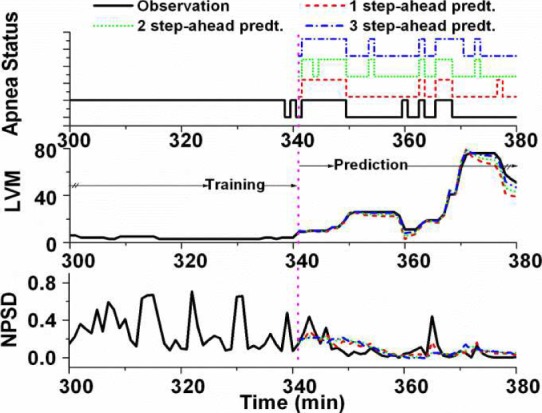
Observation from 300th to 380th min and multiple step-ahead predictions from 341th to 380th min of sleep apnea status, LVM, and NPSD features from patient a05.
Table III summarizes the average percentage of the total sleep time spent in each of the four stages of the sleep, namely, awake, rapid eye movement (REM), light sleep and deep sleep. The average was computed using the recordings of the portable sleep device taken from eight subjects over two nights with and without donning the multisensory suite. It may be noted from the table that no significant changes exist in any of the four sleep stages between the “No Suite” and “With Suite” cases. This indicates that the multisensory suite may not adversely affect the quality of the sleep from a “comfort of wear” standpoint. All the eight subjects who have participated in this paper have also affirmed that they found it comfortable to wear the suite to sleep.
Table III. Comparison of the Average Percentage of Time Durations in Four Stages of Sleep with and Without Donning the Wearable Multisensory Suite.
| Duration(%) | Wake | REM | Light | Deep |
|---|---|---|---|---|
| No suite | 0.49 | 34.75 | 52.36 | 12.39 |
| With suite | 0.74 | 38.29 | 49.80 | 11.17 |
Fig. 8 shows a representative 350 min long signal segments collected from a subject who donned the multisensory suite to sleep for 434 minutes. This subject suspects that he suffers from sleep apnea and showed several signs of sleep apnea including loud snoring and disturbed sleep. The signals shown in the figure include synchronously gathered sound (black), sleep stage (blue) signals along with the online one-minute-ahead sleep apnea predictions (red). The start of the signal strip coincides with the time when the subject begins to sleep, as indicated by the transition from wake to light sleep stage. It may be noted that no apneic episode was predicted during the 25 min long deep sleep, or during the stable light sleep stage in the 200–300 min range. More pertinently, the first apnea event predicted at the 60 min mark precedes the transition from a deep to light sleep. Also the 2nd, 3rd, 4th, 6th, 7th, and 9th apnea events are predicted near the transitions from a deep sleep to a light or REM sleep. Two apparent false positive apnea predictions (events 8th and 10th) occur at 225th min and 336th min marks in REM sleep stage. Offline training epochs to estimate the parameters of the classification and prediction models using the longitudinal data collected from a subject might further improve the sensitivity and specificity of the predictions.
Fig. 8.
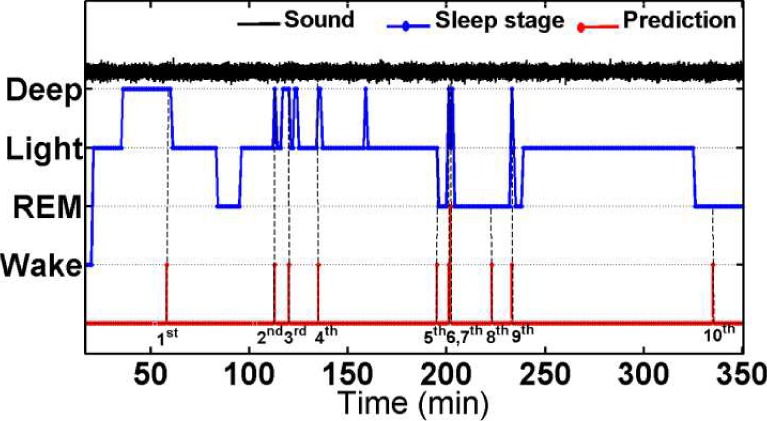
Real-time sound signal, sleep stage pattern, and one-minute ahead prediction of sleep apnea in subject ID008 from the starting of sleep to 350th min.
V. Conclusion
We have developed an approach to provide 1–3 min ahead early warning of an impending sleep apnea episode based on using a wearable wireless multisensory suite and a novel nonlinear nonstationary process prediction method. The wearable wireless multisensory system can serve as a viable platform to continuously and noninvasively acquire physiological signals to track cardiorespiratory dynamics, and quantitatively assess apneic conditions for prediction of OSA episodes. Testing of the wearable sensory suite among eight mostly healthy subjects suggests that our sensory suite does not adversely impede the comfort and quality of sleep. The prediction approach was extensively tested using 20 recordings from the Physionet database and 10 recordings from 8 subjects wearing the multisensory unit. These tests indicate that the classification and prediction accuracies  of 70–90% are possible from the present approach. It was also evident that the longest vertical length (LVM) of the recurrence plot and normalized power spectral density (NPSD) are the most sensitive features for OSA episode prediction with offline OSA classification accuracy of up to 88%. More pertinently, DPMG was shown to provide OSA prediction accuracy of 83% 1 step-ahead and 77% for 3 steps-ahead. This amounts to some 20–40% improvement in prediction accuracy compared to other methods tested. Such early prediction can spur the development of adaptive flow control systems for CPAP devices and may lead to the advent of devices to induce minor adjustments to body positions to mitigate OSA.
The ongoing investigations are focused on testing the approach on additional subjects to extract consistent benchmarks of the performance of the multisensory suite and the prediction method. Also, it may be noted that the predictions reported in the present work are based on the SVM classification model derived from multiple subjects. We are currently investigating the customization of the classification and predictions to subjects, which we believe can further improve the performance of our approach. Additionally, we are pursuing methods to mitigate OSA episodes that take advantage of the early prediction capability.
Biographies

Trung Q. Le (M'08) was born in Da Nang, Vietnam. He received the Ph.D. degree from the School of Industrial Engineering and Management, Oklahoma State University, Stillwater, OK, USA, in 2013. He is a fellow of Vietnam Education Foundation, Arlington, VA, USA. His current research interests include dynamic modeling, real-time prediction and prognostics of physiological state evolution and cardiorespiratory disorders using nonlinear and nonstationary dynamic systems principles, and complex systems and graph theoretic data mining approaches. He is a member of the Institute for Operations Research and Management Science and the Institute of Industrial Engineers.

Changqing Cheng received the B.S. and M.S. degrees in engineering mechanics from Dalian University of Technology, Dalian, China, in 2005 and 2007, respectively, and the Ph.D. degree in industrial engineering and management from Oklahoma State University, Stillwater, OK, USA, in 2013. His current research interests include advanced analytics and quality monitoring of complex systems, applications in ultra-precision nanomanufacturing processes and healthcare systems. He was a recipient of the Oklahoma State University Outstanding Doctoral Student Award, the IIE Research Conference Council of Industrial Engineering Academic Department Heads Best Poster Award, and the NSF-ASME Poster Symposium Scholarship.

Akkarapol Sa-ngasoongsong received the B.S. degree in electrical engineering from Mahidol University, Nakhon Pathom, Thailand. He is currently pursuing the Ph.D. degree in industrial engineering and management, Oklahoma State University, Stillwater, OK, USA. His current research interests include wireless sensors, biomedical informatics, and advanced time series forecasting. He was a recipient of five Best Paper Awards and was awarded Gilbreth Memorial Fellowship from the Institute of Industrial Engineers.

Woranat Wongdhamma received the B.S. degree in electrical engineering from Mahidol University, Nakhon Pathom, Thailand, and the M.S. degree in industrial technology from Texas A&M University, Commerce, TX, USA. He is currently pursuing the Ph.D. degree in industrial engineering and management from Oklahoma State University, Stillwater, OK, USA.

Satish T. S. Bukkapatnam (M'06) was born in Tirupati, India. He received the M.S. and Ph.D. degrees in industrial and manufacturing engineering from Pennsylvania State University, University Park, PA, USA. He serves as an AT&T Professor of engineering with Oklahoma State University (OSU), Stillwater, OK, USA. His current research interests include the harnessing of high-resolution nonlinear dynamic information, wireless MEMS sensors, the monitoring and prognostics of cardiorespiratory processes, complex manufacturing, and lifeline systems. His research has led to 124 peer-reviewed publications (71 in archival journals and 53 in conference proceedings), five pending patents,$4.6 million in grants as PI/Co-PI from the National Science Foundation, Department of Defense, and the private sector, and ten best-paper/poster recognitions. He received the OSU Regents Distinguished Research Award, the Halliburton Outstanding College of Engineering Young and Senior Faculty Awards, the IIE Eldin Outstanding Young Industrial Engineer Award, and the SME Dougherty Outstanding Young Manufacturing Engineer Award.
Appendix.

Funding Statement
This work was supported in part by the National Science Foundation under Grants (CMMI-0700680, 0830023, and 1000978), a grant from the Vietnam Education Foundation, and AT&T Professorship. This article is dedicated to the fond memory of our colleague, advisor and mentor Dr. Ranga Komanduri.
References
- [1].Young T., Palta M., Dempsey J., Skatrud J., Weber S., and Badr S., “The occurrence of sleep-disordered breathing among middle-aged adults,” in New England J. Med., vol. 328, pp. 1230–1235, Apr. 1993. [DOI] [PubMed] [Google Scholar]
- [2].Lavie P., Lavie L., and Herer P., “All-cause mortality in males with sleep apnoea syndrome: Declining mortality rates with age,” in Eur. Respiratory, vol. 25, no. 3, pp. 514–520, Mar. 2005. [DOI] [PubMed] [Google Scholar]
- [3].Doherty L. S., Kiely J. L., Swan V., and McNicholas W. T., “Long-term effects of nasal continuous positive airway pressure therapy on cardiovascular outcomes in sleep apnea syndrome,” in Chest, vol. 127, no. 6, pp. 2076–2084, 2005. [DOI] [PubMed] [Google Scholar]
- [4].Marin J. M., Carrizo S. J., Vicente E., and Agusti A. G. N., “Long-term cardiovascular outcomes in men with obstructive sleep apnoea-hypopnoea with or without treatment with continuous positive airway pressure: An observational study,” in The Lancet, vol. 365, no. 9464, pp. 1046–1053, Mar. 2005. [DOI] [PubMed] [Google Scholar]
- [5].Weaver T. E. and Grunstein R. R., “Adherence to continuous positive airway pressure therapy,” in Proc. Amer. Thoracic Soc., vol. 5, no. 2, pp. 173–178, Feb. 2008. [DOI] [PMC free article] [PubMed] [Google Scholar]
- [6].Sanders M., Gruendl C. A., and Rogers R. M., “Patient compliance with nasal CPAP therapy for sleep apnea,” in Chest, vol. 90, no. 3, pp. 330–333, Sep. 1986. [DOI] [PubMed] [Google Scholar]
- [7].Massie C. A., Hart R. W., Peralez K., and Richards G. N., “Effects of humidification on nasal symptoms and compliance in sleep apnea patients using continuous positive airway pressure,” in Chest, vol. 116, no. 2, pp. 403–408, Aug. 1999. [DOI] [PubMed] [Google Scholar]
- [8].Berry R. B., Parish J. M., and Hartse K. M., “The use of auto-titrating continuous positive airway pressure for treatment of adult obstructive sleep apnea,” in Sleep, vol. 25, no. 2, pp. 148–176, 2002. [PubMed] [Google Scholar]
- [9].Galetke W., Randerath W. J., Stieglitz S., Laumanns C., Anduleit N., Richter K., and Schäfer T., “Comparison of manual titration and automatic titration based on forced oscillation technique, flow and snoring in obstructive sleep apnea,” in Sleep Med., vol. 10, no. 3, pp. 337–343, Mar. 2009. [DOI] [PubMed] [Google Scholar]
- [10].Le T. Q., Cheng C., Sangasoongsong A., and Bukkapatnam S. T. S., “Prediction of sleep apnea episodes from a wireless wearable multisensor suite,” in Proc. IEEE PHT, Jan. 2013, pp. 152–155. [DOI] [PMC free article] [PubMed] [Google Scholar]
- [11].Le T., Bukkapatnam S., Benjamin B., Wilkins B., and Komanduri R., “Topology and random walk network representation of cardiac dynamics for localization of myocardial infarction,” in IEEE Trans. Biomed. Eng., vol. 60, pp. 2325–2331, Apr. 2013. [DOI] [PubMed] [Google Scholar]
- [12].Hood L., Heath J. R., Phelps M. E., and Lin B., “Systems biology and new technologies enable predictive and preventative medicine,” in Science, vol. 306, no. 5696, pp. 640–643, 2004. [DOI] [PubMed] [Google Scholar]
- [13].Tian Q., Price N. D., and Hood L., “Systems cancer medicine: Towards realization of predictive, preventive, personalized, and participatory (P4) medicine,” in J. Int. Med., vol. 271, no. 2, pp. 111–121, Feb. 2012. [DOI] [PMC free article] [PubMed] [Google Scholar]
- [14].Snyderman R. and Yoediono Z., “Prospective care: A personalized, preventative approach to medicine,” in Pharmacogenomics, vol. 7, no. 1, pp. 5–9, 2006. [DOI] [PubMed] [Google Scholar]
- [15].Stahmann J. E., Stahmann J. E., Hatlestad J. D., Ni Q., Hartley J., Daum D. R., Lee K., “Prediction of disordered breathing,” 7 938 782 B2, 2011.
- [16].Penzel T., McNames J., de Chazal P., Raymond B., Murray A., and Moody G., “Systematic comparison of different algorithms for apnoea detection based on electrocardiogram recordings,” in Med. Biol. Eng. Comput., vol. 40, no. 4, pp. 402–407, 2002. [DOI] [PubMed] [Google Scholar]
- [17].Mendez M. O., Corthout J., Van Huffel S., Matteucci M., Penzel T., Cerutti S., and Bianchi A. M., “Automatic screening of obstructive sleep apnea from the ECG based on empirical mode decomposition and wavelet analysis,” in Physiol. Meas., vol. 31, no. 3, pp. 273–289, Mar. 2010. [DOI] [PubMed] [Google Scholar]
- [18].Fontenla-Romero O., Guijarro-Berdiñas B., Alonso-Betanzos A., and Moret-Bonillo V., “A new method for sleep apnea classification using wavelets and feedforward neural networks,” in Artif. Intell. Med., vol. 34, no. 1, pp. 65–76, May 2005. [DOI] [PubMed] [Google Scholar]
- [19].Dagum P. and Galper A., “Time series prediction using belief network models,” in Int. J. Human Comput. Stud., vol. 42, no. 6, pp. 617–632, Jun. 1995. [Google Scholar]
- [20].Bock J. and Gough D. A., “Toward prediction of physiological state signals in sleep apnea,” in IEEE Trans. Biomed. Eng., vol. 45, pp. 1332–1341, Nov. 1998. [DOI] [PubMed] [Google Scholar]
- [21].Weitzman E. D., Weitzman E. D., Kahn E., and Pollak C. P., “Quantitative analysis of sleep and sleep apnea before and after tracheostomy in patients with the hypersomnia-sleep apnea syndrome,” in Sleep, vol. 3, no. 3–4, pp. 407–423, 1980. [DOI] [PubMed] [Google Scholar]
- [22].Bukkapatnam S. T. S., Komanduri R., “Wireless multisensory platform for continuous real-time monitoring of electrocardiogram signals,” Provisional Patent 61 698 117, 2010.
- [23].Bukkapatnam S. T. S. and Cheng C., “Forecasting the evolution of nonlinear and nonstationary systems using recurrence-based local Gaussian process models,” in Phys. Rev. E, vol. 82, no. 5, pp. 056206-1–056206-12, Nov. 2010. [DOI] [PubMed] [Google Scholar]
- [24].Blei D. M. and Jordan M. I., “Variational inference for Dirichlet process mixtures,” in Bayesian Anal., vol. 1, no. 1, pp. 121–144, 2005. [Google Scholar]
- [25].Sa-ngasoongsong A. and Bukkapatnam S. T. S., “Willingness-to-pay prediction based on empirical mode decomposition,” in Proc. IERC, 2011. [Google Scholar]
- [26].Shambroom J. R., Fabregas S. E., and Johnstone J., “Validation of an automated wireless system to monitor sleep in healthy adults,” in Sleep Res., vol. 21, no. 2, pp. 221–230, 2012. [DOI] [PubMed] [Google Scholar]
- [27].Wolpert E. A., “A manual of standardized terminology, techniques and scoring system for sleep stages of human subjects,” in Archives General Psychiatry, vol. 20, no. 2, pp. 246–247, 1969. [Google Scholar]
- [28].Afonso V. X., Tompkins W. J., Nguyen T. Q., and Luo S., “ECG beat detection using filter banks,” in IEEE Trans. Biomed. Eng., vol. 46, pp. 192–202, Feb. 1999. [DOI] [PubMed] [Google Scholar]
- [29].Fraser A. M. and Swinney H. L., “Independent coordinates for strange attractors from mutual information,” in Phys. Rev. A, vol. 33, no. 2, pp. 1134–1140, Feb. 1986. [DOI] [PubMed] [Google Scholar]
- [30].Kennel M. B., Brown R., and Abarbanel H. D. I., “Determining embedding dimension for phase-space reconstruction using a geometrical construction,” in Phys. Rev. A, vol. 45, no. 6, pp. 3403–3411, Mar. 1992. [DOI] [PubMed] [Google Scholar]
- [31].Kantz H. and Schreiber T., Nonlinear Time Series Analysis, Cambridge, U.K.: Cambridge Univ. Press, 1997. [Google Scholar]
- [32].Smola A. J. and Schölkopf B., “A tutorial on support vector regression,” in Stat. Comput., vol. 14, no. 3, pp. 199–222, Aug. 2004. [Google Scholar]
- [33].Gao J., “Recurrence time statistics for chaotic systems and their applications,” in Phys. Rev. Lett., vol. 83, no. 16, pp. 3178–3181, Oct. 1999. [Google Scholar]
- [34].Faure P. and Korn H., “A new method to estimate the Kolmogorov entropy from recurrence plots: Its application to neuronal signals,” in Phys. D, Nonlinear Phenomena, vol. 122, no. 1–4, pp. 265–279, Nov. 1998. [Google Scholar]