Abstract
Homecare is healthcare based on the principle “outpatient before inpatient,” with the aim of moving at least some care-delivery to the home. But reliable determination of vital signs at home requires new, smart sensors, which can be used by the patients themselves. We present a novel pulse oximetry sensor worn in the ear channel. It was previously shown that measurement of heart rate, arterial oxygen saturation and related respiratory information can be performed with reliable accuracy under laboratory conditions. The present study explores the clinical feasibility of the sensor system for cardiovascular monitoring during sleep, with the aim to diagnose sleep apnea. For this, human trials were performed in a sleep laboratory including patients with a clinical suspicion of sleep apnea. Besides a general analysis of the sensor's signal quality during sleep, the evaluation focuses on heart rate dynamics and time-variant oxygen saturation. In addition, several methods to derive respiration rate from photoplethysmographic signals are examined and discussed. Results from the in-ear sensor are compared with standard polysomnography monitoring and demonstrate that this novel system allows long-term nocturnal measurement of heart rate, oxygen saturation and respiratory rate with sufficient accuracy.
Keywords: Photoplethysmography (PPG), pulse oximetry, oxygen saturation, blood volume dynamics, sleep apnea
I. Introduction
Due to an ever-aging society, increasing healthcare costs are today a major challenge in many countries. Hence, the concept of homecare is becoming increasingly important in medical technology and will play an important role in the future. It is expected that outsourcing of healthcare from clinical facilities to home-delivered care will lead to significant reduction of costs. For this purpose, sensor systems are needed which meet specific requirements, since correct application in a home environment may be difficult to control.
Obstructive sleep apnea (OSA) is a sleep disorder in which temporary airway narrowing leads to apnea and a decrease in arterial oxygen saturation  during sleep. In western countries, 2–4% of the adult population suffers from OSA [1]. Diagnosis is usually performed in sequential steps: anamnesis, physical examination, ambulatory cardiorespiratory screening and stationary polysomnography (PSG). Standardized diagnosis of OSA involves many different physiological parameters including EEG, EOG, EMG, blood oxygen saturation, respiration, excursion of thorax and abdomen, ECG, body position, etc. However, because many sensors need to be attached to the patient, the quality of sleep is reduced which, in turn, can affect the results of the examination. This complex diagnostic procedure for OSA is associated with physical stress for the patients and considerable costs for the healthcare system.
Therefore, we developed an unobtrusive single-sensor system which is suitable for homecare screening of sleep, taking into account the special requirements of the homecare setting.
The technique is based on the principle of pulse oximetry, a multi-wavelength version of photoplethymography (PPG) [2], [3]. In contrast to conventional pulse oximeters the sensor is applied to the inner ear.
Since pulse oximetry is mainly used for  and heart rate (HR) measurement in routine clinical care, only a fraction of its capability is used. Advancements in measurement efficiency makes the coincidental measurement of multiple vital signs like HR,
  , respiration rate, vasomotion, THM waves and other possible—with a single sensor which is noninvasive, unobtrusive and cheap. Taking these aspects into account, PPG is probably the best way to a discreet and cost-effective sleep monitoring at home.
Such a sleep-monitoring sensor could allow diagnosis and even treatment of OSA in a familiar environment. This may increase the reliability of the diagnosis, since the quality of sleep is expected to improve due to a significant reduction of sensors, cables and devices. With pre-diagnosis based on nocturnal oximetry, the number of unnecessary PSG screenings in clinical sleep laboratories can be minimized [4] and thereby help to reduce healthcare costs. Combined with telemedicine technology, such a system can also be used for long-term nocturnal monitoring of patients at risk (e.g., those with chronic cardiovascular disease) and of the elderly.
The sensor has been developed in collaboration with the CiS Institute for Microsystems and Photovoltaics (Erfurt, Germany) and was first reported in [5]. During human hypoxia trials, we demonstrated in 2012 that a reliable measurement of arterial oxygen saturation is possible [6]. Based on those results, we now want to evaluate the feasibility of the in-ear sensor for cardiovascular monitoring during sleep. Therefore, trials with the sensor are being performed in patients who suffer from OSA; the results are compared with standard PSG data. Although the studies are not yet completed, the preliminary results presented here demonstrate the potential of the system for pre-diagnosis of OSA patients and/or for nocturnal monitoring of the elderly and patients at risk.
Part of this work has been prepublished in [7].
II. Materials and Methods
A. Sensor System
Photoplethysmography (Greek:  ) is a noninvasive, optical method to visualize sub dermal blood volume. Light is irradiated into the skin and the transmitted and/or reflected light is measured. Blood volume fluctuations cause changes in the intensity of the measured light and several rhythmic vital parameters can be observed (i.e., heart rate). By means of different light wavelengths an additional spectral analysis of the blood can be performed. Since the red and infrared absorption/reflection spectra of reduced and oxygenated hemoglobin distinguish significantly, PPG is also often used for an easy measurement of blood oxygen saturation (e.g., in pulse oximetry).
Especially for long-term monitoring of vital parameters during sleep, conventional pulse oximeters are not the first choice. Since most sensors are attached to finger or earlobe, measurements are often disrupted by motion artifacts like subsultis during the first stage of sleep (drifting into sleep), movements during light sleep or abrupt awakenings from deep sleep. Sensors which are limited to these body parts will always be subject to such problems. Therefore, we developed a reflective sensor type, which is not limited to peripheral body parts but can be placed in the auditory channel for reduced motion artifacts and a high level of wearing comfort (Fig. 1). In addition, the proximity to the brain guarantees stable perfusion conditions, since the tragus is supplied by an arterial network coming from the arteries temporalis superficialis and arteria auricularis posterior. While shock induced centralization (e.g., sepsis, hypothermia) is known to inhibit peripheral pulse oximetry due to a lack of peripheral perfusion ([8]–[10]), the in-ear pulse oximetry is not likely to be affected by this.
Fig. 1.
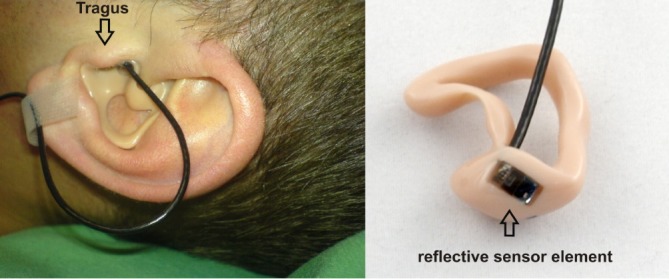
Patient with reflective PPG sensor which is sealed into an individually customized ear mold. The reflective sensor element is placed at the inner tragus. The sensor is connected to the sensor interface device via a cable which is taped for artifact reduction.
The sensor contains two light sources and a detector. Red and infrared diodes ( and
and  ) and a photodiode are placed side by side, with 2 mm of distance. The irradiated light is partly absorbed, transmitted and reflected by tissue components. The major part of the reflected light is attributed to blood cells since the reflection spectrum of hemoglobin predominates the other components for red and near infrared light. Direct light crosstalk (this signal does not carry any information about the local perfusion) is prevented by an optical barrier between sources and detector.
The sensor is sealed into a biocompatible ear mold and measurements are made in the ear channel (at the tragus). The ear mold is individually customized to the patient's ear (Fig. 1). This ensures a good mechanical fit and an exceptionally high level of wearing comfort: this is a prerequisite for continuous monitoring over several hours. A preliminary check with 10 people wearing the sensor (non-stop) for about 40 min resulted in a reported comfort level of (on average) 0.75 on a scale from 0 (imperceptible) to 10 (unbearable). During the study, the patients accepted the sensor for the entire night (5–7 hours) and the overall feedback regarding the wearing comfort was positive. Anyhow, since technical feasibility was the main focus of this work, we did not investigate in detail if the patients prefer the new sensor design over the conventional finger sensor; this should be part of future studies.
Reflective mode PPG is essentially different from transmissive mode PPG. The alternating part (AC) of the PPG signal is up to 10 times smaller than the conventional transmissive measurement method. This requires a high resolution digital conversion of the photocurrent which is converted into a proportional voltage by a transimpedance converter. The developed microcontroller-based sensor interface device (Fig. 2) provides 24-bit analog-to-digital conversion and a sampling rate of 200 samples/s without previous analog filtering (apart from anti-aliasing). A block diagram of the sensor interface device is shown in Fig. 3. The sensor-LED current is regulated by an H-bridge which is combined with two voltage-controlled current sources. The current is regulated by 16 bit D/A outputs of the microcontroller (MSP430F1611, Texas Instruments, Inc.) as a function of the detected light intensity [5], [6], [11].
Fig. 2.
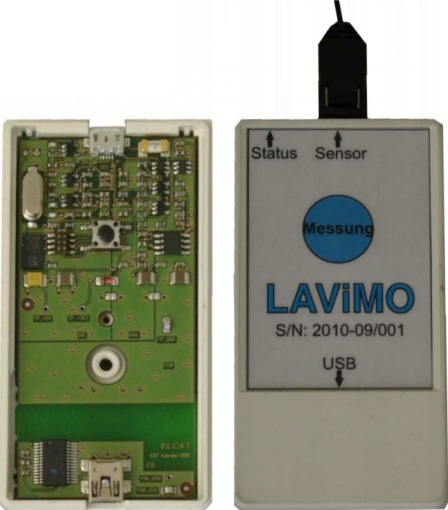
The sensor interface device (height 8.5 cm, width 4.5 cm, depth 2 cm). The microcontroller based sensor-PC interface device provides a USB connection for easy PC connection with an FTDI standard driver.
Fig. 3.
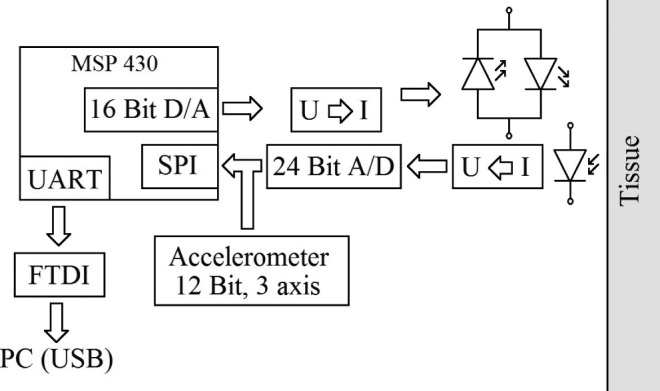
The LED current is regulated by a bidirectional current source. The photocurrent is converted into a proportional voltage and directly digitalized by a 24-bit analog-to-digital converter. A microcontroller (MSP430F1611 Texas Instruments Inc.) provides digital signal processing (adopted from [11]).
B. Arterial Oxygen Saturation
Arterial blood oxygen saturation is calculated in the conventional way [12]. An R-value is defined which takes the alternating (AC) and the static (DC) components of the red  and infrared
  PPG signals into account.
 |
Since  always has a high variance, the R-values are smoothed by a 20-s moving average filter. The correlation between the R-value and
  was determined based on our human hypoxia studies [6].
 |
Although a high correlation was confirmed in [6], global calibration proved to be challenging due to an unexpected effect, which was probably due to the influence of subdermal venous blood [11], [13]: because of a slight shift in the calibration curve every time a measurement starts, only relative  measurements can be made. Nevertheless, this is not a limitation because, with regard to
  , sleep diagnosis focuses on temporary periods of apnea with a related drop in oxygen saturation.
To meet the calibration requirement, an initial  measurement with a reference device can be performed to compensate for the
  offset by the parameter
  in (2). If the offset is compensated for, an in-ear
  measurement with the current sensor design is feasible
  [6].
[6].
C. Study Design
This ongoing study is performed at the Department of Neurology at the RWTH Aachen University Hospital (Aachen, Germany) (ClinicalTrials.gov Identifier: NCT01626274). Twenty patients with suspected OSA will be included.
After patient education and informed consent, ear molding is performed (Kaulard Optik & Akustik, Germany) to fit the sensor for each patient. The sensor is manufactured at the CiS Institute for Microsystems and Photovoltaic GmbH and at Audia Akustik GmbH (Soemmerda, Germany).
The patients spent one night in the sleep laboratory of the RWTH Aachen University Hospital for a standardized polysomnographic checkup (Diamedic GmbH, Germany), including PPG, ECG,  , respiratory flux and other tests. The MedIT in-ear sensor records continuous PPG data in parallel. The sensor is connected to a USB version of the sensor interface device which is connected to a personal computer. PSG annotation (performed by Dr. med. J. Schiefer) and data analysis are performed retrospectively.
The study was approved by the local Ethics Committee (CTC-A 10-016 EK 231/10) and the Federal Institute for Drugs and Medical Devices (BfArM). Written informed consent is obtained from all patients. The study is still in progress and will be completed in 2013. So far, 11 patients (10 males and 1 female: age range 48–59 years) were included in the study. Of these, two patients were excluded due to logistic difficulties during sensor production, another two were excluded due to technical problems, and one patient was physically unable to participate. Therefore, 6 evaluable patients are included in this preliminary feasibility analysis.
III. Results
A. Basic Signal Analysis
The first trials indicate excellent nocturnal performance of the in-ear sensor; this success can probably be attributed to considerably reduced motion and the darkness. The signal quality was quantified by the signal-to-noise ratio (SNR).
 |
The signal quality ranged from 26 dB to 36 dB (average: 30 dB) and was comparable to the SNR achieved under laboratory conditions [6], [7]. This ensures adequate sensitivity of the new system, which is a key issue in the application of Point-of-Care Healthcare Technologies (POCHT).
B. Influence of Snoring
Particularly in OSA patients, very loud snoring (up to 90 dB) is a common accessory symptom due to upper airway obstruction of the respiratory system. With respect to sensitivity to motion artifacts in PPG measurement, snoring must be considered a potential contraindication for pulse oximetric measurement in the ear channel since it causes vibration.
Covering a wide frequency range, the highest signal intensity is usually  [14]. Since a capacity in the back coupling path of the transimpedance converter provides a low-pass characteristic for anti-aliasing, spectral noise power
  is eliminated. However, spectral components of
  may corrupt the PPG signal or can be separated from the cardiac frequency band for indirect determination of snoring.
Microphone signals were used to indicate the noise level of snoring. In Fig. 4, the microphone recording is compared with the respiration signal. Absolute determination of the noise level is not possible with this method due to the high pass characteristic of conventional microphones and the resulting low sensitivity  . Also, no defined distance to the source is given. However, for investigation of the impact of snoring on in-ear PPG measurement, we chose a time span with a maximum intensity of the microphone signal and assumed this to be representative for the lower intensities.
Fig. 4.
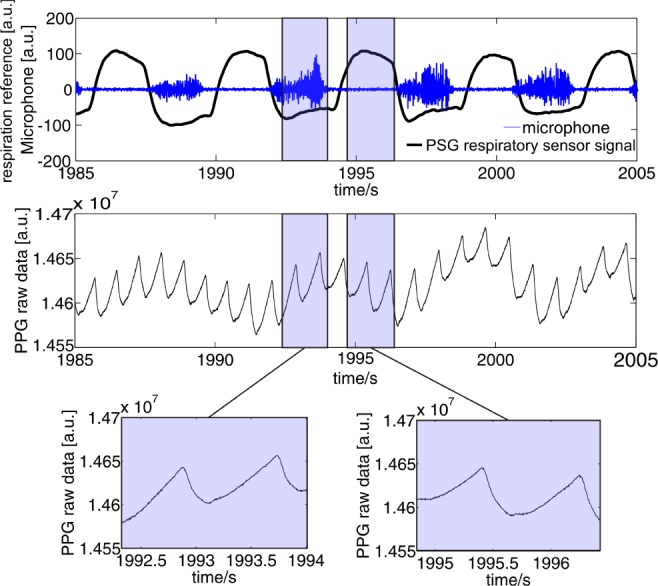
Upper panel: the respiration (black line) and microphone (blue line) signals clearly indicate snoring. Middle and bottom panel: PPG raw data derived from our in-ear pulse oximeter without filtering. The sensor shows excellent measurement performance, independent from the snoring. Despite the proximity of the sensor to the throat and the expected impact of vibrations on the PPG signal, snoring has no influence on the pulse oximetry measurement.
Since snoring is a typical phenomenon in OSA patients, such a contraindication would represent a major limitation for this new technique. In Fig. 4, the selected signal segments contrast the signal quality (unfiltered raw data) with and without snoring. It can be seen that snoring-induced vibration does not have any negative impact on the signal quality of the sensors. Overall, no significant influence on SNR could be found for all patients in this study.
C. Heart Rate
Heart rate (HR) was calculated by means of a 4th order Butterworth filter which was applied to the PPG raw data. The cutoff frequencies were 0.8 Hz and 6 Hz; this is in accordance with physiological heart rates. The lower cutoff frequency ensures a sufficient distance from the respiratory frequency band. The upper cutoff frequency has been chosen to maintain authentic PPG pulse-curve morphology. A threshold was defined at the point of maximal gradient of the pulse curve, and the zero crossings were detected. This approach allows more exact definition of heart beats compared to detection of extreme values, since maximum and minimum values are not always precisely defined (e.g., due to noise). Additional zero crossings caused by the dicrotic notch were automatically ignored.
Fig. 5 shows a comparison between HR derived from the in-ear sensor and from PSG for a representative time segment; there obviously is a high correlation between HR obtained with the in-ear sensor and with the gold standard. With regard to quantization of the reference HR up/down to whole numbers which is due to an internal algorithm of the PSG, a regression analysis was not performed. However, the possibility of HR measurement with high accuracy by in-ear pulse oximeter is evident for nocturnal measurements.
Fig. 5.
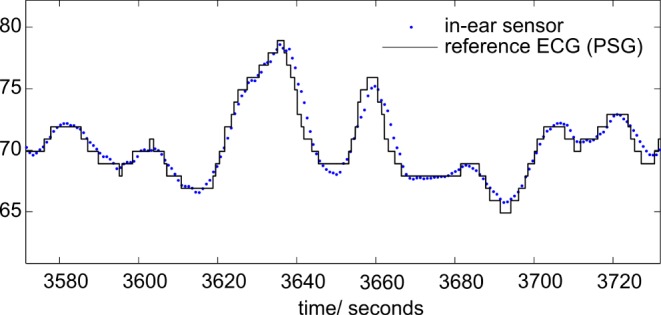
Comparison of heart rate (HR, blue dots) derived from the in-ear PPG sensor and from polysomnography (ECG, black solid line).
D. Arterial Oxygen Saturation 
Because a sudden drop in  serves to identify an apnea phase, a reliable measurement of
  plays a significant role in the diagnosis of OSA. Due to the ongoing trial, the performance of
  measurements by the in-ear sensor is demonstrated by a case study: in Fig. 6, lower panel,
  of both the PSG and the in-ear sensor is compared with respiration shown in Fig. 6, upper panel. The in-ear
  was first calibrated by the reference. The respiration signal shows a pathologic situation: the rhythmic variation in breathing intensity indicates Cheyne-Stokes respiration, including breathing stops of 30 s each. This is a clear indication of sleep apnea. The resulting drops in oxygen saturation are clearly seen in the
  of the PSG and in-ear sensor. In contrast to our system which provides sub-percentage values of
  with a sampling rate of 200 samples/second, the sampling rate of the reference pulse oximeter is down-sampled to
  sample/second and the
  values are rounded up/down to whole numbers. Therefore, as mentioned before, we did not perform a more detailed correlation analysis. Nevertheless, the high correlation demonstrates the feasibility of
  measurement in the human ear channel in a clinical situation.
Fig. 6.
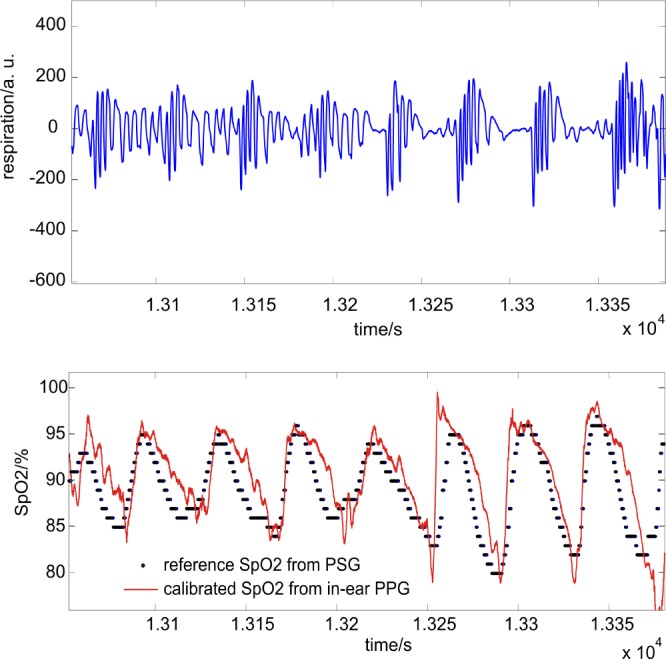
Upper panel: respiration flow (breathing air) obtained by PSG; clearly shown are three successive breathing stops of up to 30 seconds each. Lower panel: comparison of SpO2 derived from the in-ear PPG sensor (red solid line) and polysomnography (for the same time segment, black dots). The drops in oxygen saturation are clearly identified by both sensors.
E. Respiration
In general, all rhythmic physiological processes that cause fluctuations in blood pressure and/or blood volume changes affect the plethysmographic waveform. And it has long been known that respiration effects the PPG as well. Anyhow, a robust determination of respiration rate (RR) still belongs to the most challenging tasks in PPG signal processing since the energy density of corresponding (respiration-related) physiological oscillators is comparatively small. The most prominent way to determine RR is a separation of amplitude fluctuations in PPG signal. We have shown earlier that detection of respiration-related information can be achieved by simple filter segmentation [15]. Here, we chose a 2nd order Butterworth filter with cutoff frequencies 0.1 Hz and 0.33 Hz to meet durations of breathing cycles lasting from 3 to 10 seconds. However, besides respiratory-related spectral power, the PPG signal also contains other (slower) frequencies which are related to slower physiological processes (e.g., Traube-Hering-Mayer waves, thermoregulation) that can interfere with the respiratory frequency band. In this case, a correct attribution to breathing may be challenging. Hence, for an adequate sensitivity regarding clinical purposes this sole method will not be sufficient. Therefore, we suggest a combination of this method with two other signal-processing methods for RR determination which are physiologically (partly) redundant to each other:
-
1)
In contrast to the blood-pressure related measurement technique described above (a result of inhalation of air over time), variations in
 mainly depend on the amount of oxygen in blood over time.
 -
2)
In addition to analysis of the PPG amplitude and
 variation, respiration rate can also be calculated from respiratory sinus arrhythmia (RSA) [16]. RSA describes the effect of an increase in HR due to inspiration and a decrease due to expiration. Although RSA is not yet entirely understood, it is supposedly due to the baroreflex control mechanism [17].
While  variation was separated by Butterworth bandpass filtering, RSA was calculated in three steps:
1) Calculation of HR according to the algorithm described in III-C and interpolation. 2) 2nd order Butterworth filtering with cutoff frequencies of 0.1 Hz and 0.33 Hz. 3) Detection of zero crossings, and calculation of subsequent distances and interpolation.
To quantify the practicability and the diagnostic significance of these three methods for RR determination with the presented in-ear PPG sensor, we performed an initial laboratory experiment with a volunteer (29 yrs healthy male) who breathed with a constant respiration-rate/heart-rate quotient (RR-HR-quotient, 1:8, 1:6, 1:8, 1:10). Fig. 7 shows the results of the experiment. A good correlation for a RR-HR-quotient of 1:8 and 1:6 (according to breathing cycles of 6.5 resp. 4.5 seconds) can clearly be identified for all three methods. At respiration rates that are below the physiological standard (here: RR-HR-quotient of 10, according to 8 seconds respiration cycle) the “inner harmony” is disturbed and the methods show significant differences in variance. Especially RR detection by  variation shows high variation. Although there is a complex mixture of influences, it is supposedly due to desaturation effects. Regardless the variance of the methods makes an identification of apnea/hypopnea events possible since an increase in variance seems to correlate with abnormal respiration events.
Fig. 7.
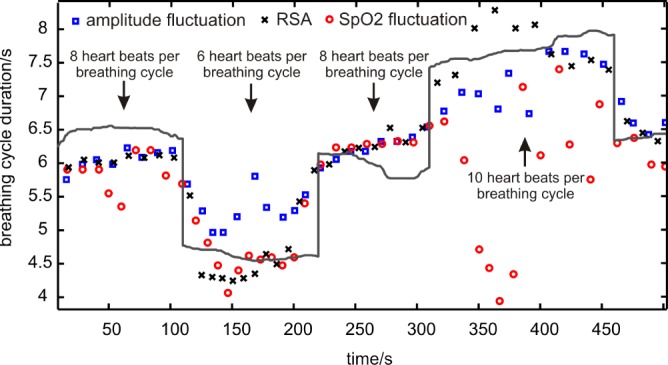
Breathing cycle durations were calculated by three different methods and compared with the reference (grey solid line): variance in PPG amplitude (blue squares), respiratory sinus arrhythmia (black crosses), variation in Spo2 (blue circles). The respiration-rate-to-heart-rate-quotient was fixed to 1:8, 1:6, 1:8, 1:10, 1:8.
These methods are adapted to the patient data. We define the respiration flow derived from the nasal respiration sensor as reference gold standard. The nasal respiration sensor is part of the PSG and is based on a thermistor (temperature sensitive resistor) which is fixed close to the nostril. Since the respiratory flow leads to an increase in temperature during expiration and a decrease during inspiration there is a (almost) linear correlation between respiratory air flux and nasal respiration sensor signal.
In contrast to the methods introduced above which are predominated by tidal volume induced pressure variation effects (e.g., increasing blood pressure due to lung expansion, partial oxygen and carbon dioxide pressure), the nasal respiration sensor signal is predominated by air flux and one must consider a phase shift of 90°. The phase shift is compensated in this analysis.
Fig. 8 illustrates the correlation of the methods with the reference for a representative time segment. Compared to the respiration flow derived from the nasal respiration sensor of the PSG, a clear correlation is seen that demonstrates the high potential of amplitude-related respiration detection for the demonstrated nocturnal setting (Fig. 8, upper panel).
Fig. 8.
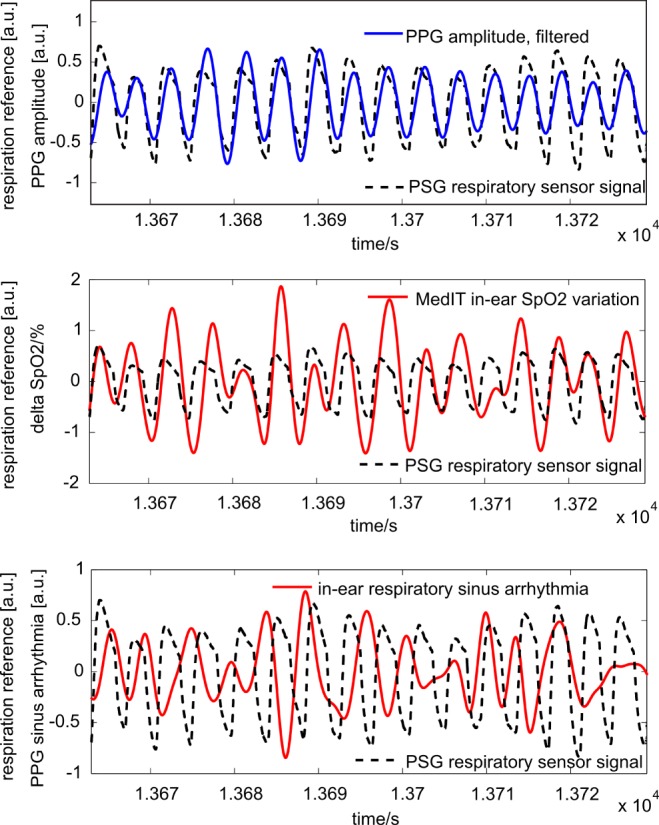
Respiration was calculated by three different methods and compared with respiratory reference sensor signal derived from a PSG nasal sensor (dashed line): segmentation by PPG amplitude (upper panel, solid line), segmentation by  variation (middle panel, solid line) and respiratory sinus arrhythmia (lower panel, solid line). All amplitudes are normalized to enable better comparability. Only
  variation is presented in absolute values (%).
 fluctuates up to 2% in amplitude (middle panel) and a correlation is also evident. Although the compliance is slightly inferior to the amplitude-related detection of respiration, it proved to be a useful redundant alternative.
Comparing the respiratory signal with RSA (Fig. 8, bottom panel), a correlation can hardly be identified for the selected time segment. In fact, the characteristic of the coupling between HR variation and respiration differs between individuals and also intra-individually over time.
There are various parameters influencing RSA in individuals including age and cardiorespiratory disease. Sleep apnea (i.e., central sleep apnea) can also be seen as a cardiorespiratory disease and, thus, RSA may serve as an interesting diagnostic parameter for examination of sleep apnea.
RSA also depends on physiological status and is deemed to be very prominent at relaxation. For this reason, an indication of sleep phases by RSA is an interesting direction for future research, but was not evaluated in this work.
Although these methods are not expected to provide reliable information about the depth of breathing, frequency-related information in the form of a breathing rate (i.e., mean number of breaths/minute) can be supported. For the selected time span in Fig. 8, the breathing rate was calculated by means of zero-crossings detection and a correlation analysis was performed (Table I). As expected, a segmentation of respiration rate by PPG amplitude shows the best correlation. Although the RSA approach provides no reliable determination of the breathing rate for the analyzed situation, a general feasibility is well known.
Table I. The Reference Breathing Rate is Correlated with the Presented Methods: Amplitude Segmentation,  Variation and Respiratory Sinus Arrhythmia.
| method | amplitude modulation |
 variation variation |
RSA |
|---|---|---|---|
| correlation coefficient | 0.89 | 0.12 | -0.09 |
| mean absolute deviation [s] | 0.14 | 0.8 | 1.45 |
| mean error [%] | 3.36 | 19.08 | 36.88 |
| standard deviation [s] | 0.09 | 0.67 | 1.36 |
To quantify the intra-individual reliability we adapted the methods to three time segments (two minutes each) of different patients in different stages of sleep. The specificity and sensitivity of a detection of breathing events is listed in Table II.
Table II. Sensitivity/Specificity [%] of the Proposed Methods for Respiration-Event Detection.
| method | Patient #1 | Patient #3 | Patient #4 |
|---|---|---|---|
| amplitude modulation | 100/ 100 | 81.5/ 85.7 | 84.6/ 80.8 |
 variation variation |
100/ 100 | 95.7/ 95.7 | 88/ 84.6 |
| RSA | 37.5/62.5 | 91.3/95.7 | 92/80.8 |
For a more stable and reliable calculation of respiration rate, we suggest an appropriate combination of the three methods. For a model-based data fusion of those redundant determination strategies several methods exist like Bayes' fusion, Kalman filter, neural networks and others. A similar neural network supported respiration rate monitoring with PPG signal detection with a forehead sensor has been published by Johansson [18].
Although a classification of a pathologic breathing pattern, like the Cheyne-Stokes respiration in Fig. 6 is not realistic at present, we think that a determination of respiration rate and identification of apnea phases with adequate specificity and sensitivity is feasible for most situations with the presented approach.
IV. Conclusion
This work is based on the preliminary analysis of a clinical study and evaluates the potential of a novel in-ear pulse oximetric sensor for cardiovascular monitoring during sleep. Human studies were performed in sleep apnea patients in a sleep laboratory under standard examination conditions. The feasibility of a simultaneous measurement of heart rate,  and respiration could be demonstrated with the presented sensor. This might reduce the amount of necessary sensors, cables and devices in the clinical sleep apnea examination (PSG) which in turn could improve the quality of sleep during PSG and might also enable an easy nocturnal cardiovascular monitoring in a non-clinical environment (homecare) with a single sensor.
The measurement of breathing rate by means of pulse oximetric data is a complex research field. Although the PPG amplitude is considered to fluctuate synchronously with respiration, interference from other oscillating physiological procedures often leads to misinterpretation. Therefore, the possibility of a three-way detection of respiration is discussed: i.e., respiration rate was calculated by means of segmentation by PPG amplitude, segmentation by variation in  , and by respiratory sinus arrhythmia.
The potential of these three methods for respiration measurement was quantified by an initial laboratory human experiment and the sensitivity and the specificity were evaluated by several patients in different sleep stages. We found the best sensitivity and specificity using PPG amplitude and  variation. Regardless, segmentation by respiratory sinus arrhythmia was proved to be a useful alternative. Since these methods offer partial redundancy due to the physiological phenomenon upon which they are based, a combination of these three methods might allow more reliable measurement of respiration rate.
Also, besides HR, respiration rate and  , pulse oximetry may allow the measurement of additional vital parameters in the future (e.g., thermoregulation, blood pressure variation), thereby reducing the number of sensors required.
Snoring, a typical symptom of OSA, was expected to be a potential contraindication. However, we demonstrated that snoring-induced vibration does not affect the signal quality of pulse oximetric measurement in the ear channel. However, motion artifacts caused by subsultis tendinum, or abrupt awakenings, must be taken into account and carefully evaluated since they can decrease the specificity of the system.
However, particularly for POCHT applications, both sensitivity and specificity are essential features for reliable health monitoring in a non-clinical environment. Since PPG is susceptible to movement, identification of motion artifacts and reduction strategies need to be developed. In the future, we will pursue motion detection by means of the integrated 3-axis accelerometer for automatic detection of and compensation for artifacts.
Acknowledgment
The authors also thank Dr. D. Starke and Dr. O. Brodersen from the Institute for Microsystems and Photovoltaics (CiS), Erfurt, Germany, for providing sensor hardware and Dipl.-Biol. Sigrid Gloeggler from the Coordination Center for Cardiological Trials (KKS), RWTH University Hospital Aachen, Germany, for coordinating the study.
Biographies

Boudewijn Venema was born in Amsterdam, The Netherlands, in 1983. He received the Dipl.-Ing. degree in electrical engineering from RWTH Aachen University, Aachen, Germany. Currently, he is pursuing the Dr.-Ing. (Ph.D.) degree with the Philips Chair of Medical Information Technology, RWTH Aachen University, where he is a Research Assistant. His current research interests include the study of photon-tissue interaction and contactless long-term measurement of vital signs using photoplethysmography.

Johannes Schiefer was born in Wuppertal, Germany, in 1964. He received the Medical degree. He has specialized as a Clinical Neurologist. He is currently a Senior Physician with the Department of Neurology, RWTH Aachen University Hospital, Aachen, Germany. He is particularly interested in intensive care medicine and sleep medicine. His current research interests include sleep disorders, neurodegenerative disorders, and media-assisted interactive clinical teaching.

Vladimir Blazek was born in Czechoslovakia in 1945. He received the Dipl.-Ing. degree in electrical engineering from Technical University, Brno, Czech Republic, in 1969, the Dr.-Ing. degree from RWTH Aachen University, Aachen, Germany, in 1979, and the Venia Legendi degree from Czech Technical University, Prague, Czech Republic, in 1993. From 1971 to 2010, he was with the Institute of High Frequency Technology, RWTH Aachen University. Since May 1995, he has been a Professor of measurements and biomedical engineering for both partner universities in Aachen and Prague. Since 2011, he has been with the Philips Chair of Medical Information Technology, RWTH Aachen University. His current research interests include optoelectronics in medicine, biomedical sensors, functional optical imaging techniques, and tissue optics.

Nikolai Blanik was born in Bonn, Germany, in 1977. He received the Dipl.-Ing. degree in electrical engineering from RWTH Aachen University, Aachen, Germany. Currently, he is pursuing the Dr.-Ing. (Ph.D.) degree with the Philips Chair of Medical Information Technology, RWTH Aachen University, where he is a Research Assistant. His current research interests include photon tissue interaction with Monte-Carlo simulation and photoplethysmographic imaging.

Steffen Leonhardt was born in Frankfurt, Germany, in 1961. He received the M.S. degree in computer engineering from SUNY, Buffalo, NY, USA, the Dipl.-Ing. degree in electrical engineering and the Dr.-Ing. degree in control engineering from the Technical University of Darmstadt, Darmstadt, Germany, and the M.D. degree in medicine from J. W. Goethe University, Frankfurt. He has five years of research and development management experience in the medical engineering industry and was appointed a Full Professor and the Head of the Philips Endowed Chair of Medical Information Technology, RWTH Aachen University, Aachen, Germany, in 2003. His current research interests include physiological measurement techniques, personal healthcare systems, and feedback control systems in medicine.
Funding Statement
This work was supported by the German Federal Ministry of Science and Education, the State of North Rhine-Westphalia NRW, Germany, and the European Union (NRW Ziel2 Program).
References
- [1].Young T., Evans L., Finn L., and Palta M., “Estimation of the clinically diagnosed proportion of sleep apnea syndrome in middle-aged men and women,” Sleep, vol. 20, no. 9, pp. 705–706, 1997. [DOI] [PubMed] [Google Scholar]
- [2].Matthes K., “Untersuchungen ber die sauerstoffsattigung des menschlichen arterienblutes,” Arch. Experim. Pathol. Pharmacol., vol. 179, no. 6, pp. 698–711, 1935. [Google Scholar]
- [3].Hertzman A. B., “The blood supply of various skin areas as estimated by the photoelectric plethysmography,” Amer. J. Physiol., vol. 124, no. 2, pp. 323–340, 1938. [Google Scholar]
- [4].Chiner E., Signes-Costa J., Arriero J. M., Marco J., Fuentes I., and Sergado A., “Nocturnal oximetry for the diagnosis of the sleep apnoea hypopnoea syndrome: A method to reduce the number of polysomnographies?,” Thorax, vol. 54, no. 11, pp. 968–971, 1999. [DOI] [PMC free article] [PubMed] [Google Scholar]
- [5].Vogel S., Hulsbusch M., Hennig T., Blazek V., and Leonhardt S., “In-ear vital signs monitoring using a novel microoptic reflective sensor,” IEEE Trans. Inf. Technol. Biomed., vol. 13, no. 6, pp. 882–889, Nov. 2009. [DOI] [PubMed] [Google Scholar]
- [6].Venema B., Blanik N., Blazek V., Gehring H., Opp A., and Leonhardt S., “Advances in reflective oxygen saturation monitoring with a novel in-ear sensor system: Results of a human hypoxia study,” IEEE Trans. Biomed. Eng., vol. 59, pp. 2003–2010, Jul. 2012. [DOI] [PubMed] [Google Scholar]
- [7].Venema B., Blanik N., Blazek V., Schiefer J., and Leonhardt S., “A feasibility study evaluating innovative in-ear pulse oximetry for unobtrusive cardiovascular homecare monitoring during sleep,” in Proc. IEEE PHT, Bangalore, India, Jan. 2013, pp. 124–127. [DOI] [PMC free article] [PubMed] [Google Scholar]
- [8].Hummler H. D., Engelmann A., Pohlandt F., Hogel J., and Franz A. R., “Decreased accuracy of pulse oximetry measurements during low perfusion caused by sepsis: Is the perfusion index of any value?,” Intensive Care Med., vol. 32, no. 9, pp. 1428–1431, 2006. [DOI] [PubMed] [Google Scholar]
- [9].van de Louw A., Cracco C., Cerf C., Harf A., Duvaldestin P., Lemaire F., and Brochard L., “Accuracy of pulse oximetry in the intensive care unit,” Intensive Care Med., vol. 27, no. 10, pp. 1606–1613, 2001. [DOI] [PubMed] [Google Scholar]
- [10].Gehring H., Hornberger C., Matz H., Konecny E., and Schmucker P., “The effects of motion artifact and low perfusion on the performance of a new generation of pulse oximeters in volunteers undergoing hypoxemia,” Respiratory Care, vol. 47, no. 1, pp. 48–60, 2002. [PubMed] [Google Scholar]
- [11].Venema B., Santos S. A., and Leonhardt S., “In-ear monitoring with a novel optoelectronic sensor for long-term conditions,” in Proc. World Congr. Med. Phys. Biomed. Eng., Beijing, China, May 2012, vol. 39, pp. 1358–1361. [Google Scholar]
- [12].Webster J. G., Design of Pulse Oximeters, Bristol, PA, USA: IOP Publishing, 1997. [Google Scholar]
- [13].Kim J., Arakawa K., Benson K., and Fox D., “Pulse oximetry and circulatory kinetics associated with pulse volume amplitude measured by photoelectric plethysmography,” Anesth. Analg., vol. 65, no. 12, pp. 1333–1339, 1986. [PubMed] [Google Scholar]
- [14].Perez-Padilla J. R., Slawinski E., Difrancesco L. M., Feige R. R., Remmers J. E., and Whitelaw W. A., “Characteristics of the snoring noise in patients with and without occlusive sleep apnea,” Amer. Rev. Respirat. Disease, vol. 147, no. 3, pp. 635–644, 1993. [DOI] [PubMed] [Google Scholar]
- [15].Venema B., “Long-term monitoring of cardiac and respiratory activity using optoelectronic sensor,” in Proc. 15th Int. Student Conf., Prague, Czech Republic, 2011. [Google Scholar]
- [16].Yasuma F. and Hayano J., “Respiratory sinus arrhythmia: Why does the heartbeat synchronize with respiratory rhythm?,” Chest, vol. 125, no. 2, pp. 683–690, 2004. [DOI] [PubMed] [Google Scholar]
- [17].Karemaker J. M., “Counterpoint: Respiratory sinus arrhythmia is due to the baroreflex mechanism,” J. Appl. Sci., vol. 27, no. 10, pp. 1742–1743, 2009. [DOI] [PubMed] [Google Scholar]
- [18].Johansson A., “Neural network for photoplethysmographic respiratory rate monitoring,” Med. Biol. Eng. Comput., vol. 41, no. 3, pp. 242–248, 2003. [DOI] [PubMed] [Google Scholar]


