

Abstract
Selection bias is a potential concern in all epidemiologic studies, but it is usually difficult to assess. Recently, concerns have been raised that internet-based prospective cohort studies may be particularly prone to selection bias. Although use of the internet is efficient and facilitates recruitment of subjects that are otherwise difficult to enroll, any compromise in internal validity would be of great concern. Few studies have evaluated selection bias in internet-based prospective cohort studies. Using data from the Danish Medical Birth Registry from 2008 to 2012, we compared six well-known perinatal associations (e.g., smoking and birth weight) in an inter-net-based preconception cohort (Snart Gravid n = 4,801) with the total population of singleton live births in the registry (n = 239,791). We used log-binomial models to estimate risk ratios (RRs) and 95% confidence intervals (CIs) for each association. We found that most results in both populations were very similar. For example, maternal obesity was associated with an increased risk of delivering a macrosomic infant in Snart Gravid (RR = 1.5; 95% CI: 1.2, 1.7) and the total population (RR = 1.5; 95% CI: 1.45, 1.53), and maternal smoking of >10 cigarettes per day was associated with a higher risk of low birth weight (RR = 2.7; 95% CI: 1.2, 5.9 vs. RR = 2.9; 95% CI: 2.6, 3.1) in Snart Gravid and the total population, respectively. We cannot be certain that our results would apply to other associations or different populations. Nevertheless, our results suggest that recruitment of reproductive aged women via the internet may be no more prone to selection bias than traditional methods of recruitment.
In an epidemiologic study focused on etiologic associations, generalizing from the study results is predicated on their internal validity. Selection bias, one threat to internal validity, arises when the association between exposure and outcome differs between study participants and nonparticipants.1 Selection factors that are related to exposure can produce selection bias, but only if these selection factors are also related to the study outcome; a different prevalence of exposure in study participants versus nonparticipants is not sufficient to cause selection bias with respect to effect measures.2
Not every study focuses on etiology, however. In surveillance research, the goal may be to estimate disease incidence or prevalence in a specific population. In this case, generalizing from the study results is less abstract than in etiologic studies; it may require representative sampling or weighted sampling that can be used to construct estimates that describe the state of the source population. The importance of representativeness depends on the goal of the research. Although it is clearly important in surveillance studies, in etiologic studies, representativeness of a source population is arguably not a prerequisite for either internal validity or generalizability,3–5 although there has been some disagreement on this issue.6,7
In prospective cohort studies, there are several major potential sources of selection bias: (1) “self-selection bias,” when factors related to both the exposure and the future outcome affect whether or not someone volunteers for a study; (2) selection bias due to differential loss to follow-up, when loss of study subjects is associated with both exposure and outcome (includes bias from competing risks and from informative censoring); and (3) selection bias introduced by selection criteria imposed by the investigators. Selection bias of any type that results from a common cause being related to both exposure and disease resembles confounding and can be dealt with by adjustment in the analysis, as long as there is sufficient information available.8 Selection bias from differential loss to follow-up occurs when the loss of study subjects is jointly dependent on both exposure and outcome. Hernan et al.8 classified this type of selection bias as a form of “collider-stratification bias” introduced by selection criteria that condition on common effects of exposure and disease. A related type of selection bias is index event bias, a type of collider-stratification bias that occurs in studies of disease recurrence.9
In practice, the existence of selection bias and any impact it might have on measures of effect are difficult to assess because, by definition, the information on those not included is missing. If partial information is available on nonresponders, partial responders, or drop-outs, characteristics of the included and nonincluded study populations can be compared,10–14 and sometimes associations can be measured in both groups.15–19 Quantitative bias analysis is one approach to assess the potential effect of selection bias on a study, but it requires assumptions about selection factors that may be difficult to assess.20 Other approaches include marginal structural models, which may be useful to deal with informative censoring in cases where the censoring can be predicted with measured covariates.21–23
In some settings, features of a study may permit empirical examination of selection bias using external data.15–17 For example, the Norwegian Mother and Child Study24 and the Danish National Birth Cohort25 examined potential selection bias using national birth registry data to compare well-established associations (e.g., smoking and low birth weight) in their study cohorts with the same associations in the source population.15,16 The original cohort studies enrolled their participants during routine prenatal care during the first or early second trimester; participation rates were 43% in Norwegian Mother and Child Study and 31% in the Danish National Birth Cohort. The results of both studies found that the exposure–outcome associations examined were similar for the study cohorts and the entire source population implying little selection bias, although the prevalence of basic characteristics such as age, parity, and smoking differed in the respective populations.15,16
Few prospective cohort studies have used the internet for recruitment and follow-up, despite potentially greater efficiency in data collection, better data quality, lower costs, and easier enrollment of many otherwise hard-to-identify populations (with some notable exceptions such as intravenous drug users or the homeless population).26–32 All questionnaire-based prospective cohort studies (as opposed to registry/database studies) rely on volunteers and thus are theoretically vulnerable to self-selection bias. Nevertheless, many prospective studies, such as the Nurses’ Health Study and the Framingham study, have enumerated the population to be enrolled and thus can calculate response rates. In contrast, internet-based recruitment may raise concerns because the denominator is unknown, baseline participation rates cannot be calculated, and characteristics of responders and nonresponders cannot be compared. To the best of our knowledge, only one internet-based study has evaluated potential selection bias empirically.33 Although confounding patterns in that cohort differed from those in the source population, most exposure–outcome associations were similar in the study and its source population.
Use of the internet for enrollment and follow-up of epidemiologic studies holds great promise.34–36 Nevertheless, any compromise in study validity would be of great concern. We evaluated the presence of selection bias in an internet-based study of pregnancy planners in Denmark, using data from the Danish Medical Birth Registry (Danish Medical Birth Registry) to compare several associations in our study cohort with findings for the total population of Danish women with a live birth recorded in the Danish Medical Birth Registry during the study period.
METHODS
The Snart Gravid study began in June 2007 with the launch of the study website (www.Snart-Gravid.dk). The last participant in Snart Gravid enrolled in August 2011; at that time, we expanded our aims by adding a food frequency questionnaire and more detailed questions on medication use, and by recruiting male partners in addition to females into the successor study, Snart Foraeldre (www.SnartForaeldre.dk). All study recruitment and follow-up is conducted via the internet. Potential participants learn about the study through an advertisement on a popular Danish health-related web site (www.netdoktor.dk), through Facebook, or through publicity in other media. Study methods have been described in detail previously.28,30,37,38 Eligible women are Danish residents, aged 18–40 years, in a stable relationship with a male partner, and not currently using any form of contraception or fertility drugs. Eligibility is assessed via an online screening questionnaire and participants read an online consent form before enrollment. The study was approved by the Boston University Medical Center Institutional Review Board, protocol #H25361, and the Danish Data Protection Board #2013-41-922 and 1-16-02-1-08 for use of Danish birth registry data.
To enroll, women must provide a valid Civil Registration Number and email address. After completing an extensive baseline questionnaire, participants are followed via short bimonthly questionnaires until pregnancy is reported or for up to 1 year.
For the current analysis, we obtained data from the Danish Medical Birth Registry on maternal age at delivery, parity at time of delivery, smoking during pregnancy, body mass index (BMI) at the first prenatal visit, diagnosis of pre-eclampsia (ICD 10 codes O10-O16), mode of delivery and birth weight for all singleton live births in Denmark during 2008–2012 (n = 242,452). Women in Snart Gravid were ages 18–42 at their infant’s birth. As women in the Danish Medical Birth Registry ranged from ages 13 to 54, we restricted their age range to 18–42 for comparability with Snart Gravid women. Less than 2% of non-Snart Gravid population was outside of the 18–42 year range. We also excluded women and infants with implausible data on maternal BMI or infant birth weight (1.1%). After these exclusions, 239,791 births remained, including 4,801 births among Snart Gravid participants and 234,990 births among nonparticipants. All data used in this analysis are from the Danish Medical Birth Registry.
We compared basic frequencies of maternal and infant characteristics of Snart Gravid participants and the total population of Danish women ages 18–42 with a birth recorded in the Danish Medical Birth Registry during 2008–2012. We used log-binomial regression to calculate crude and adjusted risk ratios (RRs) and 95% confidence intervals (CIs) for several well-established associations related to maternal smoking,39 obesity,40 parity,41 and delivery by C-section42 separately for Snart Gravid and the total population in the registry. We estimated the association between maternal smoking in pregnancy (current smoker vs. nonsmoker and quit during pregnancy, 1–10/day, and >10/day vs. nonsmoker) and low birth weight (<2,500 g) and birth weight <3,000 g controlling for maternal age (18–25, 25–29, 30–34, and 35–42 years), parity (nulliparous vs. parous), and BMI (<20, 20–24, 25–29, and ≥30 kg/m2). We estimated the association between nulliparity and pre-eclampsia, controlling for age, BMI, and smoking (current smoker, yes/no). Similarly, we examined the association of history of C-section and risk of C-section delivery in the current birth controlling for maternal age, BMI, and smoking. We examined associations of maternal BMI ≥30 with pre-eclampsia, delivery by C-section, and macrosomia (>4,000 g), adjusting for age, parity, and smoking. We used multivariable linear regression to estimate adjusted mean birth weight differences according to maternal smoking and obesity, adjusting for maternal age and parity.
RESULTS
Women who gave birth following enrollment in Snart Gravid were less likely to be ages <25 or ≥35 than all Danish women giving birth during the same time period. Snart Gravid participants were more likely to be nonsmokers (90% vs. 84%) and to have no previous live births (67% vs. 53%) than the source population. The prevalence of obesity, pre-eclampsia, low birth weight (<2,500 g), birth weight <3,000 g, macrosomia, and C-section delivery were similar in Snart Gravid participants and the source population (Table 1).
TABLE 1.
Maternal and Infant Characteristics of Participants in the Snart Gravid Cohort and All Women Giving Birth in Denmark, Using Data from the Danish Medical Birth Registry 2008–2012
| Snart Gravid (n = 4,801)
|
Danish Medical Birth Registry (n = 239,791)
|
|
|---|---|---|
| Frequency of Selected Characteristics | N (%) | N (%) |
| Age at delivery (years) | ||
| <25 | 509 (11) | 32,199 (13) |
| 25–29 | 1,930 (40) | 75,761 (32) |
| 30–34 | 1,744 (36) | 84,257 (35) |
| ≥35 | 618 (13) | 47,574 (20) |
| Missing | 0 | 0 |
| Smoking status during pregnancy | ||
| Nonsmoker | 4,331 (90) | 201,157 (84) |
| Quit during pregnancy | 84 (1.7) | 7,146 (3.0) |
| 1–10 cigarettes/day | 189 (3.9) | 16,889 (7.0) |
| >10 cigarettes/day | 82 (1.7) | 7,086 (3.0) |
| Missing | 115 (2.4) | 7,513 (3.1) |
| Parity at entry into study | ||
| 0 | 3,201 (67) | 126,570 (53) |
| 1 | 1,140 (24) | 69,195 (29) |
| ≥2 | 353 (7.4) | 38,546 (16) |
| Missing | 107 (2.2) | 5,480 (2.3) |
| Maternal body mass index (kg/m2) | ||
| <20 | 624 (13) | 34,159 (14) |
| 20–24 | 2,351 (49) | 116,806 (49) |
| 25–29 | 973 (20) | 47,588 (20) |
| ≥30 | 586 (12) | 27,953 (12) |
| Missing | 267 (5.6) | 13,285 (5.5) |
| Pre-eclampsia | ||
| Yes | 278 (6.3) | 10,666 (5.3) |
| No | 4,170 (94) | 190,579 (95) |
| Missing | 0 | 0 |
| Birth weight | ||
| <2,500 g | 168 (3.5) | 8,742 (3.7) |
| 2,500–2,999 g | 535 (11) | 27,220 (11) |
| 3,000–4,000 g | 3,278 (68) | 162,583 (68) |
| >4,000 g | 779 (16) | 37,679 (16) |
| Missing | 41 (0.9) | 3,567 (1.5) |
| Method of delivery | ||
| C-section | 1,038 (22) | 49,775(21) |
| Vaginal birth | 3,738 (78) | 187,365 (78) |
| Missing | 24 (0.5) | 2,597 (1.1) |
| Prior C-section | ||
| Yes | 242 (5.0) | 17,351 (7.2) |
| No | 4,538 (95) | 220,754 (92) |
| Missing | 20 (0.4) | 1,632 (0.7) |
Table 2 presents adjusted RRs and 95% CIs for selected associations between exposures and outcomes among Snart Gravid participants and among all women giving birth in Denmark during the same time period. Relative to nonsmokers, current smokers had a higher risk of delivering a baby with a birth weight <3,000 g among Snart Gravid participants (RR = 1.8; 95% CI: 1.5, 2.3). The corresponding RR was 1.8 (95% CI: 1.7, 1.8) among the total population. Finer categories of smoking showed similar effects. Using the traditional cut-off for low birth weight (<2,500 g), results were similar among Snart Gravid and the total registry population among women who smoked >10 cigarettes/day (RR = 2.7; 95% CI = 1.2, 5.9) versus 2.9 (95% CI = 2.6, 3.1) and among those who quit smoking in pregnancy (RR = 1.1; 95% CI = 0.4, 3.3, and 1.2; 95% CI = 1.1, 1.3), but differed among light (1–10 cigarettes per day) smokers (RR = 1.1; 95% CI = 0.5, 2.5 vs. 2.2; 95% CI = 2.0, 2.3). The association between nulliparity and pre-eclampsia was slightly stronger among non-Snart Gravid women, but CIs were broad and overlapping. Effect estimates for maternal BMI and macrosomia were almost identical (RR = 1.5 [95% CI = 1.2, 1.7] in Snart Gravid and RR = 1.5; [95% CI: 1.45, 1.53] in the total population), and those for maternal BMI and C-section delivery and prior C-section in relation to current C-section were comparable in the two groups. Both crude and adjusted mean birth weights in relation to maternal BMI and smoking in pregnancy were very similar in the two groups.
TABLE 2.
RRs and 95% CI for Selected Associations in Danish Medical Birth Registry Data, Among Snart Gravid Study Participants and Among All Danish Births, 2008–2012
| Snart Gravid N = 4,801
|
Danish Medical Birth Registry N = 239,791
|
|||||
|---|---|---|---|---|---|---|
| N | Crude RR | Adjusted RR (95% CI) | N | Crude RR | Adjusted RR (95% CI) | |
| Smoking and birth weight <3,000 ga | ||||||
| Current smoker | 90 | 1.8 | 1.8 (1.5, 2.3) | 7,554 | 1.8 | 1.8 (1.7, 1.8) |
| Nonsmoker | 591 | 1.00 (ref) | 1.00 (ref) | 27,402 | 1.00 (ref) | 1.00 (ref) |
| Quit during pregnancy | 15 | 1.3 | 1.2 (0.7, 1.9) | 1,073 | 1.1 | 1.1 (1.00, 1.1) |
| Current smoker 1–10 cigarettes/day | 46 | 1.8 | 1.9 (1.4, 2.5) | 4,245 | 1.9 | 1.9 (1.8, 1.9) |
| Current smoker >10 cigarettes/day | 26 | 2.3 | 2.6 (1.8, 3.6) | 2,077 | 2.2 | 2.3 (2.2, 2.4) |
| Smoking and birth weight <2,500 ga | ||||||
| Current smoker | 18 | 1.5 | 1.4 (0.8, 2.4) | 2,004 | 2.0 | 2.1 (2.0, 2.2) |
| Nonsmoker | 143 | 1.00 (ref) | 1.00 (ref) | 6,390 | 1.00 (ref) | 1.00 (ref) |
| Quit during pregnancy | 4 | 1.43 | 1.1 (0.4, 3.3) | 275 | 1.2 | 1.2 (1.1, 1.3) |
| Current smoker 1–10 cigarettes/day | 6 | 1.0 | 1.1 (0.5, 2.5) | 1,095 | 2.0 | 2.2 (2.0, 2.3) |
| Current smoker >10 cigarettes/day | 8 | 3.0 | 2.7 (1.2, 5.9) | 584 | 2.6 | 2.9 (2.6, 3.1) |
| Parity and pre-eclampsiab | ||||||
| Nulliparous | 223 | 1.6 | 1.7 (1.3, 2.3) | 8,264 | 2.0 | 2.3 (2.2, 2.4) |
| Primiparous | 51 | 1.00 (ref) | 1.00 (ref) | 2,212 | 1.00 (ref) | 1.00 (ref) |
| Prior C-section and C-sectionc | ||||||
| No prior C-section | 856 | 1.00 (ref) | 1.00 (ref) | 37,421 | 1.00 (ref) | 1.00 (ref) |
| Prior C-section | 168 | 3.7 | 4.9 (4.0, 6.1) | 11,447 | 3.9 | 5.0 (4.9, 5.2) |
| Maternal BMI and macrosomia >4,000 gd | ||||||
| BMI < 20 | 61 | 0.67 | 0.66 (0.51, 0.86) | 3,148 | 0.62 | 0.64 (0.62, 0.66) |
| 20–24 | 341 | 1.00 (ref) | 1.00 (ref) | 17,323 | 1.00 (ref) | 1.00 (ref) |
| 25–29 | 203 | 1.4 | 1.3 (1.1, 1.6) | 9,187 | 1.3 | 1.3 (1.25, 1.31) |
| ≥30 | 130 | 1.5 | 1.5 (1.2, 1.7) | 6,253 | 1.5 | 1.5 (1.45, 1.53) |
| Maternal BMI and pre-eclampsiac | ||||||
| BMI < 20 | 26 | 0.95 | 0.88 (0.56, 1.37) | 916 | 0.69 | 0.70 (0.65, 0.75) |
| 20–24 | 102 | 1.00 (ref) | 1.00 (ref) | 4,372 | 1.00 (ref) | 1.00 (ref) |
| 25–29 | 72 | 1.8 | 1.8 (1.4, 2.5) | 2,619 | 1.5 | 1.6 (1.5, 1.7) |
| ≥30 | 73 | 3.0 | 3.0 (2.3, 4.0) | 2,522 | 2.6 | 2.7 (2.6, 2.8) |
| Maternal BMI and C-sectionc | ||||||
| BMI < 20 | 113 | 0.89 | 0.90 (0.75, 1.09) | 5,705 | 0.86 | 0.89 (0.86, 0.91) |
| 20–24 | 479 | 1.00 (ref) | 1.00 (ref) | 22,563 | 1.00 (ref) | 1.00 (ref) |
| 25–29 | 228 | 1.2 | 1.2 (1.0, 1.4) | 11,344 | 1.2 | 1.3 (1.2, 1.3) |
| ≥30 | 182 | 1.5 | 1.6 (1.3, 1.8) | 8,392 | 1.6 | 1.6 (1.56, 1.63) |
Adjusted for parity, maternal age, BMI.
Adjusted for smoking, maternal age, BMI.
Adjusted for smoking, parity, maternal age, BMI.
Adjusted for smoking, parity, maternal age.
Among Snart Gravid participants, the mean differences in birth weight adjusted for maternal age, smoking, and parity were −121, 60, and 103 g for maternal BMI <20, 25–29, and ≥30, respectively, compared with BMI of 20–24. Among the total population, the same comparisons resulted in nearly identical differences of −124, 67, and 107 g. Results were also very similar according to smoking habits: current smoking in pregnancy was associated with 184 and 192 g reductions in average birth weight among Snart Gravid and the total population of infants, respectively, and results for finer categories of smoking were also similar in the two groups (see eTable; http://links.lww.com/EDE/A976).
DISCUSSION
The self-selected Snart Gravid study encompassed 2% of all singleton live births in Denmark from 2008 to 2012. The Snart Gravid study was restricted to pregnancy planners recruited mainly via internet-based advertising on health-related websites. The prevalence of internet use in Denmark is high and a large proportion (77%) of Danish women plan their pregnancies,43 so that internet-using pregnancy planners constitute a high proportion of all women who become pregnant in Denmark. The distribution of BMI and the prevalence of pre-eclampsia were similar in Snart Gravid and the Danish population, and both groups had a similar prevalence of a history of C-section delivery and low birth weight in the current birth. Snart Gravid participants were more likely to be nonsmokers and nulliparous and less likely to be <25 or more than 34 years old. Previous studies of birth cohorts recruited using traditional methods also found that their study participants were more likely to be nulliparous,15,16,33 nonsmoking,13,16,33 and between 25 and 34 years old15,16 than their source populations identified via registries. Similar to these studies, we found that most exposure–outcome associations were comparable for women who participated in our prospective cohort study and all Danish women in the Danish Medical Birth Registry, even though Snart Gravid recruited participants via the internet and the study population was confined to pregnancy planners. The similarity of findings in Snart Gravid and all women in the Danish Medical Birth Registry suggests that our study has both internal and external validity, at least for the associations studied.
This analysis was limited to associations for which we could obtain data from the Danish Medical Birth Registry. The extent to which similar results would hold for other associations is uncertain, but it may help to consider the theoretical aspects of generalizing about selection bias. An association between exposure and the probability of selection is not sufficient on its own to create bias in effect estimates. In its most simple form, selection bias, also referred to as collider-stratification bias, occurs when one conditions on a common effect of two independent variables, resulting in an association between those parent variables that may lead to an observed exposure–outcome association that differs from the true causal effect.8,44–47 We illustrate this situation with a parsimonious causal structure, as shown in Figure 1. An example of this structure would be if E (exposure) were maternal smoking in pregnancy, S (selection factor) were the study eligibility criteria (pregnancy-planning, internet-use, etc.) and subsequent self-selection into the study, and D (disease) were low infant birth weight. Snart Gravid participants were less likely to smoke in pregnancy than the general Danish population (8% vs. 14%). Thus, there is a relationship between E and S, perhaps generated by a common cause of both E and S that is not pictured in the diagram. In this example, let us consider the variable U (unmeasured or unknown factor) to represent underlying fertility problems, which may be positively associated with selection and low birth weight. Analyzing this population of women who are planning a pregnancy and who enroll via the internet would condition on S (because we have restricted our sample to women who participate) and create an association between E and U. This process would create an unblocked backdoor path between E and D, thereby changing the association between E and D in the study population. For the situation pictured, large bias in the E–D association would result from conditioning on S when there is a large E–S association and U substantially confounds the S–D association. This diagram illustrates but one example. There are many more complicated directed acyclic graphs that could be drawn. This example illustrates selection bias with the bare minimum of nodes and represents the situation where selection bias is potentially strongest.45,46
FIGURE 1.
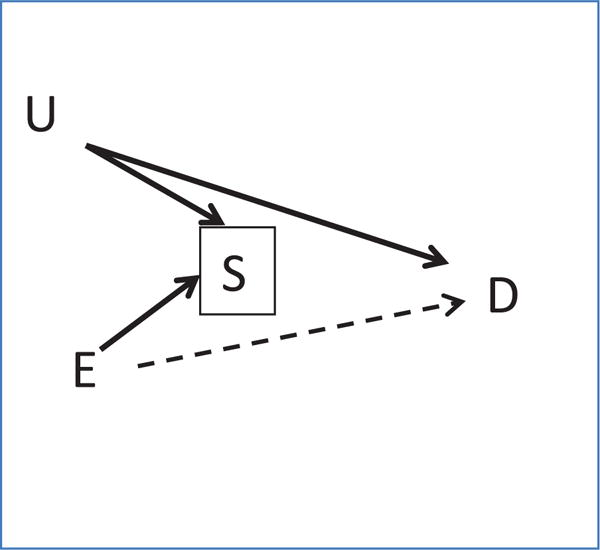
Causal diagram of selection bias. E indicates exposure; S, selection factor; D, disease outcome; U, unmeasured or unknown factor.
Our results for smoking and birth weight were generally similar in Snart Gravid and the source population, suggesting little selection bias, with the exception of the association between light smoking (<10 cigarettes/day) and low birth weight (<2,500 g). Among light smokers in Snart Gravid, there was little association between smoking and low birth weight (RR = 1.1 compared with RR = 2.2 among light smokers in the total population). While this difference may suggest selection bias among light smokers who enrolled in Snart Gravid, it could also be due to imprecision, because the results for light smoking and birth weight <3,000 g were almost identical in Snart Gravid and all women. It is also possible that light smokers in Snart Gravid were more likely to quit or to smoke less than women in the total population, which may have resulted in their lower risk of low birth weight. Selection bias as represented in Figure 1 is not unique to either internet-based or preconception cohorts; it may occur in any cohort study where exposure is associated with joining the study and where a common cause of selection and the outcome exists.
In this article, we focused primarily on selection bias as a potential threat to internal validity. Some authors are also concerned with selection factors that result in a nonrepresentative study population. Without effect-measure modification by a factor, weighted selection by that factor will not influence the effect estimate in a study.1 In the presence of effect-measure modification, overall results depend on the distribution of the effect modifier in the study population. The study result may differ from the corresponding value in the source population if sampling in the study is not proportional across subgroups of the modifying variable, and summary results are not standardized to the overall population.48 If information is available on the effect modifier, the study should report important effect-measure modification, rather than present summary estimates. The motivation for representative sampling is usually a prior interest in describing associations within a specific target population,6,7 in addition to the well-known need to have representative populations to describe prevalence of exposures and diseases in the source population.
A limitation of our study is that we restricted the analysis to variables measured in the Danish Medical Birth Registry, and thus could only measure a few associations. Some of the associations in our study cohort differed slightly from those in the source population, but those tended to be for relatively rare exposures or outcomes that had imprecise estimates of association. The majority of associations were very similar for the internet-recruited population and the remainder of Danish women giving birth. Although we cannot be confident that our results would apply to other populations and associations than those studied here, our findings indicate that selection bias may not be an important concern in prospective cohort studies of reproduction that recruit and follow women via the internet.
Supplementary Material
Acknowledgments
The authors would like to acknowledge the helpful comments of Amelia Wesselink during the review process.
Footnotes
Supplemental digital content is available through direct URL citations in the HTML and PDF versions of this article (www.epidem.com).
References
- 1.Rothman KJ, Greenland S, Lash TL. Validity in epidemiologic studies. In: Rothman KJ, Greenland S, Lash TL, editors. Modern Epidemiology. 3rd. Philadelphia, PA: Lippincott Williams and Wilkins; 2008. [Google Scholar]
- 2.Greenland S. Response and follow-up bias in cohort studies. Am J Epidemiol. 1977;106:184–187. doi: 10.1093/oxfordjournals.aje.a112451. [DOI] [PubMed] [Google Scholar]
- 3.Rothman KJ, Gallacher JE, Hatch EE. Why representativeness should be avoided. Int J Epidemiol. 2013;42:1012–1014. doi: 10.1093/ije/dys223. [DOI] [PMC free article] [PubMed] [Google Scholar]
- 4.Olsen J. Random sampling: is it worth it? Paediatr Perinat Epidemiol. 2013;27:27–28. doi: 10.1111/ppe.12020. [DOI] [PubMed] [Google Scholar]
- 5.Nohr EA, Olsen J. Commentary: epidemiologists have debated representativeness for more than 40 years–has the time come to move on? Int J Epidemiol. 2013;42:1016–1017. doi: 10.1093/ije/dyt102. [DOI] [PubMed] [Google Scholar]
- 6.Keiding N, Slama R. Commentary: time-to-pregnancy in the real world. Epidemiology. 2015;26:119–121. doi: 10.1097/EDE.0000000000000215. [DOI] [PubMed] [Google Scholar]
- 7.Ebrahim S, Davey Smith G. Commentary: should we always deliberately be non-representative? Int J Epidemiol. 2013;42:1022–1026. doi: 10.1093/ije/dyt105. [DOI] [PubMed] [Google Scholar]
- 8.Hernan MA, Hernández-Díaz S, Robins JM. A structural approach to selection bias. Epidemiology. 2004;15:615–625. doi: 10.1097/01.ede.0000135174.63482.43. [DOI] [PubMed] [Google Scholar]
- 9.Dahabreh IJ, Kent DM. Index event bias as an explanation for the paradoxes of recurrence risk research. JAMA. 2011;305:822–823. doi: 10.1001/jama.2011.163. [DOI] [PMC free article] [PubMed] [Google Scholar]
- 10.Barton J, Bain C, Hennekens CH, et al. Characteristics of respondents and non-respondents to a mailed questionnaire. Am J Public Health. 1980;70:823–825. doi: 10.2105/ajph.70.8.823. [DOI] [PMC free article] [PubMed] [Google Scholar]
- 11.Greene N, Greenland S, Olsen J, Nohr EA. Estimating bias from loss to follow-up in the Danish National Birth Cohort. Epidemiology. 2011;22:815–822. doi: 10.1097/EDE.0b013e31822939fd. [DOI] [PubMed] [Google Scholar]
- 12.Montgomery MP, Kamel F, Hoppin JA, Beane Freeman LE, Alavanja MC, Sandler DP. Effects of self-reported health conditions and pesticide exposures on probability of follow-up in a prospective cohort study. Am J Ind Med. 2010;53:486–496. doi: 10.1002/ajim.20789. [DOI] [PMC free article] [PubMed] [Google Scholar]
- 13.Bornehag CG, Moniruzzaman S, Larsson M, et al. The SELMA study: a birth cohort study in Sweden following more than 2000 mother-child pairs. Paediatr Perinat Epidemiol. 2012;26:456–467. doi: 10.1111/j.1365-3016.2012.01314.x. [DOI] [PubMed] [Google Scholar]
- 14.Lund E, Kumle M, Braaten T, et al. External validity in a population-based national prospective study–the Norwegian Women and Cancer Study (NOWAC) Cancer Causes Control. 2003;14:1001–1008. doi: 10.1023/b:caco.0000007982.18311.2e. [DOI] [PubMed] [Google Scholar]
- 15.Nilsen RM, Vollset SE, Gjessing HK, et al. Self-selection and bias in a large prospective pregnancy cohort in Norway. Paediatr Perinat Epidemiol. 2009;23:597–608. doi: 10.1111/j.1365-3016.2009.01062.x. [DOI] [PubMed] [Google Scholar]
- 16.Nohr EA, Frydenberg M, Henriksen TB, Olsen J. Does low participation in cohort studies induce bias? Epidemiology. 2006;17:413–418. doi: 10.1097/01.ede.0000220549.14177.60. [DOI] [PubMed] [Google Scholar]
- 17.Nilsen RM, Surén P, Gunnes N, et al. Analysis of self-selection bias in a population-based cohort study of autism spectrum disorders. Paediatr Perinat Epidemiol. 2013;27:553–563. doi: 10.1111/ppe.12077. [DOI] [PMC free article] [PubMed] [Google Scholar]
- 18.Hatch EE, Kleinerman RA, Linet MS, et al. Do confounding or selection factors of residential wiring codes and magnetic fields distort findings of electromagnetic fields studies? Epidemiology. 2000;11:189–198. doi: 10.1097/00001648-200003000-00019. [DOI] [PubMed] [Google Scholar]
- 19.Vrijheid M, Richardson L, Armstrong BK, et al. Quantifying the impact of selection bias caused by nonparticipation in a case-control study of mobile phone use. Ann Epidemiol. 2009;19:33–41. doi: 10.1016/j.annepidem.2008.10.006. [DOI] [PubMed] [Google Scholar]
- 20.Lash TL, Fox MP, Fink AK. Applying Quantitative Bias Analysis to Epidemiologic Data. New York: Springer; 2009. [Google Scholar]
- 21.Cole SR, Hernán MA. Constructing inverse probability weights for marginal structural models. Am J Epidemiol. 2008;168:656–664. doi: 10.1093/aje/kwn164. [DOI] [PMC free article] [PubMed] [Google Scholar]
- 22.Hernán MA, Brumback B, Robins JM. Marginal structural models to estimate the causal effect of zidovudine on the survival of HIV-positive men. Epidemiology. 2000;11:561–570. doi: 10.1097/00001648-200009000-00012. [DOI] [PubMed] [Google Scholar]
- 23.Fine JP, Gray RJ. A proportional hazards model for subdistribution of competing risk. J Royal Stat Soc. 1999;94:496–509. [Google Scholar]
- 24.Magnus P, Irgens LM, Haug K, Nystad W, Skjaerven R, Stoltenberg C, MoBa Study Group Cohort profile: the Norwegian Mother and Child Cohort Study (MoBa) Int J Epidemiol. 2006;35:1146–1150. doi: 10.1093/ije/dyl170. [DOI] [PubMed] [Google Scholar]
- 25.Olsen J, Melbye M, Olsen SF, et al. The Danish National Birth Cohort–its background, structure and aim. Scand J Public Health. 2001;29:300–307. doi: 10.1177/14034948010290040201. [DOI] [PubMed] [Google Scholar]
- 26.Kesse-Guyot E, Andreeva V, Castetbon K, et al. Participant profiles according to recruitment source in a large Web-based prospective study: experience from the Nutrinet-Santé study. J Med Internet Res. 2013;15:e205. doi: 10.2196/jmir.2488. [DOI] [PMC free article] [PubMed] [Google Scholar]
- 27.Richiardi L, Baussano I, Vizzini L, Douwes J, Pearce N, Merletti F, NINFEA cohort Feasibility of recruiting a birth cohort through the internet: the experience of the NINFEA cohort. Eur J Epidemiol. 2007;22:831–837. doi: 10.1007/s10654-007-9194-2. [DOI] [PubMed] [Google Scholar]
- 28.Mikkelsen EM, Hatch EE, Wise LA, Rothman KJ, Riis A, Sørensen HT. Cohort profile: the Danish web-based pregnancy planning study–‘Snart-Gravid’. Int J Epidemiol. 2009;38:938–943. doi: 10.1093/ije/dyn191. [DOI] [PMC free article] [PubMed] [Google Scholar]
- 29.Bälter KA, Bälter O, Fondell E, Lagerros YT. Web-based and mailed questionnaires: a comparison of response rates and compliance. Epidemiology. 2005;16:577–579. doi: 10.1097/01.ede.0000164553.16591.4b. [DOI] [PubMed] [Google Scholar]
- 30.Huybrechts KF, Mikkelsen EM, Christensen T, et al. A successful implementation of e-epidemiology: the Danish pregnancy planning study ‘Snart-Gravid’. Eur J Epidemiol. 2010;25:297–304. doi: 10.1007/s10654-010-9431-y. [DOI] [PMC free article] [PubMed] [Google Scholar]
- 31.Long MD, Kappelman MD, Martin CF, et al. Development of an internet-based cohort of patients with inflammatory bowel diseases (CCFA partners): methodology and initial results. Inflamm Bowel Dis. 2012;18:2099–2106. doi: 10.1002/ibd.22895. [DOI] [PubMed] [Google Scholar]
- 32.Turner C, Bain C, Schluter PJ, et al. Nurses and Midwives e-cohort Group Cohort profile: The Nurses and Midwives e-Cohort Study–a novel electronic longitudinal study. Int J Epidemiol. 2009;38:53–60. doi: 10.1093/ije/dym294. [DOI] [PubMed] [Google Scholar]
- 33.Pizzi C, De Stavola BL, Pearce N, et al. Selection bias and patterns of confounding in cohort studies: the case of the NINFEA web-based birth cohort. J Epidemiol Community Health. 2012;66:976–981. doi: 10.1136/jech-2011-200065. [DOI] [PubMed] [Google Scholar]
- 34.Ekman A, Litton JE. New times, new needs; e-epidemiology. Eur J Epidemiol. 2007;22:285–292. doi: 10.1007/s10654-007-9119-0. [DOI] [PubMed] [Google Scholar]
- 35.Rhodes SD, Bowie DA, Hergenrather KC. Collecting behavioural data using the world wide web: considerations for researchers. J Epidemiol Community Health. 2003;57:68–73. doi: 10.1136/jech.57.1.68. [DOI] [PMC free article] [PubMed] [Google Scholar]
- 36.Rothman KJ, Cann CI, Walker AM. Epidemiology and the internet. Epidemiology. 1997;8:123–125. [PubMed] [Google Scholar]
- 37.Rothman KJ, Mikkelsen EM, Riis A, Sørensen HT, Wise LA, Hatch EE. Randomized trial of questionnaire length. Epidemiology. 2009;20:154. doi: 10.1097/EDE.0b013e31818f2e96. [DOI] [PubMed] [Google Scholar]
- 38.Wise LA, Rothman KJ, Mikkelsen EM, Sørensen HT, Riis A, Hatch EE. An internet-based prospective study of body size and time-to-pregnancy. Hum Reprod. 2010;25:253–264. doi: 10.1093/humrep/dep360. [DOI] [PMC free article] [PubMed] [Google Scholar]
- 39.Andres RL, Day MC. Perinatal complications associated with maternal tobacco use. Semin Neonatol. 2000;5:231–241. doi: 10.1053/siny.2000.0025. [DOI] [PubMed] [Google Scholar]
- 40.Norman JE, Reynolds RM, Reynolds R. The consequences of obesity and excess weight gain in pregnancy. Proc Nutr Soc. 2011;70:450–456. doi: 10.1017/S0029665111003077. [DOI] [PubMed] [Google Scholar]
- 41.Duckitt K, Harrington D. Risk factors for pre-eclampsia at antenatal booking: systematic review of controlled studies. BMJ. 2005;330:565. doi: 10.1136/bmj.38380.674340.E0. [DOI] [PMC free article] [PubMed] [Google Scholar]
- 42.Menacker F, Declercq E, Macdorman MF. Cesarean delivery: background, trends, and epidemiology. Semin Perinatol. 2006;30:235–241. doi: 10.1053/j.semperi.2006.07.002. [DOI] [PubMed] [Google Scholar]
- 43.Backhausen MG, Ekstrand M, Tydén T, et al. Pregnancy planning and lifestyle prior to conception and during early pregnancy among Danish women. Eur J Contracept Reprod Health Care. 2014;19:57–65. doi: 10.3109/13625187.2013.851183. [DOI] [PubMed] [Google Scholar]
- 44.Cole SR, Platt RW, Schisterman EF, et al. Illustrating bias due to conditioning on a collider. Int J Epidemiol. 2010;39:417–420. doi: 10.1093/ije/dyp334. [DOI] [PMC free article] [PubMed] [Google Scholar]
- 45.Greenland S. Quantifying biases in causal models: classical confounding vs collider-stratification bias. Epidemiology. 2003;14:300–306. [PubMed] [Google Scholar]
- 46.Liu W, Brookhart MA, Schneeweiss S, Mi X, Setoguchi S. Implications of M bias in epidemiologic studies: a simulation study. Am J Epidemiol. 2012;176:938–948. doi: 10.1093/aje/kws165. [DOI] [PubMed] [Google Scholar]
- 47.Whitcomb BW, Schisterman EF, Perkins NJ, Platt RW. Quantification of collider-stratification bias and the birthweight paradox. Paediatr Perinat Epidemiol. 2009;23:394–402. doi: 10.1111/j.1365-3016.2009.01053.x. [DOI] [PMC free article] [PubMed] [Google Scholar]
- 48.Jöckel KH, Stang A. Cohort studies with low baseline response may not be generalisable to populations with different exposure distributions. Eur J Epidemiol. 2013;28:223–227. doi: 10.1007/s10654-013-9782-2. [DOI] [PubMed] [Google Scholar]
Associated Data
This section collects any data citations, data availability statements, or supplementary materials included in this article.