

Abstract
Cancer stem cells (CSC) contribute to epithelial ovarian cancer (EOC) progression and therapeutic response. We hypothesized that germline single nucleotide polymorphisms (SNPs) in CSC-related genes may predict an initial therapeutic response for women newly diagnosed with EOC. A nested case–control design was used to study 361 women with advanced-stage serous EOC treated with surgery followed by first-line platinum-based combination therapy at Moffitt Cancer Center or as part of The Cancer Genome Atlas Study. “Cases” included 102 incomplete responders (IRs) and “controls” included 259 complete clinical responders (CRs) to therapy. Using Illumina genotyping arrays and imputation, DNA samples were evaluated for 5,509 SNPs in 24 ovarian CSC-related genes. We also evaluated the overall significance of each CSC gene using the admixture maximum likelihood (AML) test, and correlated genotype with EOC tumor tissue expression. The strongest SNP-level associations with an IR to therapy were identified for correlated (r2 > 0.80) SNPs within signal transducer and activator of transcription 3 (STAT3) [odds ratio (OR), 2.24; 95% confidence interval (CI), 1.32–3.78; p = 0.0027], after adjustment for age, population stratification, grade and residual disease. At the gene level, STAT3 was significantly associated with an IR to therapy (pAML 5 0.006). rs1053004, a STAT3 SNP in a putative miRNA-binding site, was associated with STAT3 expression (p = 0.057). This is the first study to identify germline STAT3 variants as independent predictors of an unfavorable therapeutic response for EOC patients. Findings suggest that STAT3 genotype may identify high-risk women likely to respond more favorably to novel therapeutic combinations that include STAT3 inhibitors.
Keywords: polymorphisms, cancer stem cells, ovarian cancer, STAT3
Epithelial ovarian cancer (EOC) is the fifth leading cause of cancer death among women in the United States.1 Nearly 80% of cases present with advanced-stage (III/IV) high-grade serous disease when the 5-year survival rate is 30%.1 Standard treatment for the initial management of advanced EOC is cytoreductive surgery followed by first-line platinum-based combination chemotherapy (cisplatin or carboplatin) +/− taxane (paclitaxel).2 Approximately 70% of patients have a complete clinical response (CR) to this therapy as defined by clinical examination, radiologic imaging or serum CA-125 measurement3 and are initially “chemosensitive” (but eventually recur), whereas 30% have an initial incomplete response (IR) characterized by persistent or progressive “chemoresistant” disease and endure toxicities with little clinical benefit.2,4 Although chemoresistance in EOC is influenced by age, tumor stage, grade, histology and extent of surgical debulking,2,4,5 the field of pharmacogenomics suggests that certain drugs will be most effective and safe for a particular individual based on their unique genomic sequence or expression profile.6 Germline variants affecting the pharmacokinetics and pharmodynamics of platinum therapy have been shown to predict chemoresponse (and associated toxicities) in EOC,6,7 and one intriguing yet underexplored area involves the evaluation of single nucleotide polymorphisms (SNPs) in cancer stem cell (CSC)-related genes as predictors of chemoresponse in EOC.
CSCs are a rare population of aggressive tumor cells characterized by their unique capacity to self-renew and give rise to cells that have high proliferative and invasive potential.8 Evidence demonstrates that CSCs may be a root cause of EOC progression and act as promising targets for new combinations of therapeutic drugs.8,9 The ovarian CSC phenotype has been characterized at the molecular level by cell surface markers and transcription factors shown to be upregulated in clinical samples and cell lines.10 Moreover, high expression levels of several of these markers have been associated with recurrent disease, chemoresistance and poor survival.11–15
Germline variants in the CSC genes CD44, CD133 and STAT3 have been linked to clinical outcomes in patients with localized gastric adenocarcinoma16 and colon cancer,17 metastatic colorectal cancer18 and metastatic renal cell carcinoma19,20 and acute myeloid leukemia,21 respectively. Variants in CSC genes may also alter gene expression and/or activity in EOC tissues and ultimately contribute to clinical outcomes, yet no published investigations of this topic area exist. The primary goal of this nested case–control study was to comprehensively evaluate associations between germline variants in ovarian CSC-related genes and response to first-line platinum-based therapy among women with advanced-stage serous EOC. We also aimed to evaluate the overall significance of each CSC gene by combining SNP-level evidence, and then correlated genotype with tumor tissue expression of the most promising CSC gene(s).
Methods
Study population, data and biospecimens
This study included data and specimens from women newly diagnosed with pathologically confirmed invasive advanced-stage (III/IV) serous EOC. All women were treated with cytoreductive surgery and subsequent first-line platinum-based combination chemotherapy and were followed to assess their response to therapy; patients who had neoadjuvant therapy were excluded. For the present analysis, we focused on self-reported white women since the burden of EOC is highest in this racial group.22 We included two cohorts: 45 women diagnosed and treated at our institution (Moffitt Cancer Center) between 2001 and 2012, and 316 women diagnosed and treated between 1993 and 2009 who had samples analyzed as part of The Cancer Genome Atlas (TCGA) project.23 Eligible subjects contributed germline DNA for prior genotyping23,24 or had genomic DNA available for genotyping through this study, and most had matched primary EOC tumor tissue that had undergone gene expression profiling.
Individuals at Moffitt had provided written consent for data and biospecimens to be donated for research through several protocols approved by the Institutional Review Board (IRB) of the University of South Florida, including Total Cancer Care (http://moffitt.org/patient-services/total-cancercare/research).25 Demographic, clinical and pathologic data (such as age at pathological diagnosis, degree of debulking/cytoreduction, histology, stage, grade, chemotherapy regimens and response and follow-up data regarding recurrence and survival) from Moffitt cases were obtained from the Moffitt Cancer Registry and other source systems, and were supplemented with data abstracted from the medical record and clinical databases maintained by the Women’s Oncology program. Pertinent data elements and biospecimens were collected by the TCGA project as described elsewhere.23 The publicly available TCGA ovarian cancer gene expression dataset was accessed at http://cancergenome.nih.gov, and prior approval was granted to publish on individual-level TCGA genotype data.
Measurement of the outcome
Treatment response was retrospectively evaluated for each cohort member using standard criteria for patients with measurable disease WHO guidelines.26 CA-125 level was used to classify responses in the absence of a measurable lesion based on established guidelines.27 CRs had a complete disappearance of all measurable disease for 4 weeks or, in the absence of measurable lesions, a normalization of CA-125 level for at least 4 weeks and were therefore “chemosensitive.” Patients who demonstrated a partial response (defined as a 50% or greater reduction in tumor burden obtained from measurement of each bidimensional lesion for at least 4 weeks, or a drop in CA-125 by >50% for at least 4 weeks), no response (had stable disease) or progressed during adjuvant therapy were classified as IRs, and were “chemoresistant.”
Genotyping, quality control, imputation and data harmonization
Whole blood served as the primary source of germline DNA and was collected in the course of clinical care. DNA was isolated using Autopure reagents (Qiagen Sciences Inc, Germantown, MD) and stored at 4°C. For the minority of cases, the source of DNA was adjacent normal tissue, and the DNeasy mini kit was used for isolation (Qiagen Sciences Inc, Germantown, MD). Genotypes were generated for each cohort using ~250 ng DNA and different versions of Illumina Infinium Arrays; Moffitt samples were genotyped on the 610-quad Array (at Mayo Clinic, Rochester, MN) or the Human OmniExpress 12v1-1B Array (at Moffitt, Tampa, FL), and TCGA samples were genotyped using the Human 1M-Duo Array.
Sample and SNP quality control (QC) procedures have been described previously.23,24 Briefly, samples were excluded if they had a call rate <95%, >1% discordance, <80% European ancestry or ambiguous gender. SNPs were excluded if they had call rates <95% or they were monomorphic. To integrate different genotyping platforms and improve genomic coverage and power,28 we imputed genotypes for all subjects based on data from the 1000 Genomes Project (1KGP) using IMPUTE2 version 2 after prephasing with SHAPEIT.29 We used all 14 populations in the 1KGP as the reference. Before imputation, we excluded poor performing SNPs according to the genotyping success rates, deviation from Hardy–Weinberg equilibrium (HWE) (p < 1 × 10⁻⁷), replicate errors and minor allele frequency (MAF). To ensure the quality of the imputed genotypes, maximum likelihood genotype imputation was carried out and an estimate of the squared correlation between the imputed and true genotypes was calculated. Imputed SNPs with an r2 < 0.3 were excluded.
Gene and SNP selection
Twenty-four genes were chosen for this study based on published literature, which directly showed or suggested a role for the respective gene in the biology or regulation of ovarian CSCs. The genes included: ABGC2, ALDH1A1, BMI1, CD44, COMT, CXCR4, ENG, EPCAM, ESRRB, HES1, KIT/CD117, KLF4, LIN28A, LIN28B, MYC, NANOG, NES, NOTCH1, OCT4/POU5F1, PROM1/CD133, RONIN/THAP11, SOX2, STAT3 and THY1/CD90. A total of 5,509 SNPs from the 24 genes of interest were extracted from the imputed dataset and were available for statistical analysis (Supporting Information Table S1).
Microarray gene expression profiling analysis of EOC tissue
Before the current investigation, under an IRB-approved protocol25 matched frozen tumor tissue from 23 ovarian serous adenocarcinoma patients treated at Moffitt was previously arrayed on Affymetrix HuRSTA-2a520709 GeneChips (Santa Clara, CA) which contained ~60,000 probe sets representing ~25,037 unique genes (Affymetrix HuRSTA-2a520709, GEO: http://www.ncbi.nlm.nih.gov/geo/query/acc.cgi?acc5GPL10379). Matched gene expression profiling data (level 3) for 316 high-grade serous EOC samples were also obtained from the TCGA Data Portal. The profiling of the TCGA samples was performed on the Human Agilent 244K Gene Chip (Agilent, Santa Clara, CA).
Statistical analysis
Descriptive statistics were generated using means and standard deviations for continuous variables and frequencies and percents for categorical variables. To minimize the potential for population stratification, European ancestry was confirmed using principal component analysis30 with HapMap CEU populations. We then performed SNP-level association tests for the 5,509 identified SNPs. For each variant, unconditional logistic regression under a dominant model (carriers versus noncarriers) was used to evaluate individual SNP associations with response status (IR vs. CR). Models were adjusted for five principal components (PCs) representing ancestry and age at pathological diagnosis. Models were also adjusted for five PCs, age at pathological diagnosis, high-grade disease (yes versus no) and residual disease at debulking (suboptimal versus optimal). At the SNP level, we focused on results significant at p < 0.005 after adjustment for prognostic variables.
For genes having multiple SNPs associated with response status, we calculated pairwise linkage disequilibrium (LD) and reported SNPs with r2 < 0.80. Gene-level tests were also conducted to combine association evidence from SNPs within each evaluated gene. We used the admixture maximum likelihood (AML) test,31 an approach that simultaneously tests the global null hypothesis (of no SNP–outcome associations) and estimates the proportion of underlying false hypotheses. The AML uses univariate SNP-level results to calculate the AML Cochran–Armitage trend test. Compared to other methods, AML has been shown to have similar or higher statistical power to detect associations except under the unlikely scenario that >20% of all variants are associated with the outcome.31 For significant genes (p < 0.05) that contained regions of high LD (r2 > 0.80), we tested for associations between haplotypes and response status using the Haplo.stats program and R software according to the methods proposed by Schaid et al.32 Rarer haplotypes (frequencies < 10%) were combined into a single category to minimize sparse cell counts. Haplotype effects were considered significant using a threshold of p < 0.01. This exploratory gene-level and haplotype-based approach was undertaken to complement SNP-level findings, and aimed to reduce the degrees of freedom, avoid model fitting issues due to multicollinearity from LD and to improve statistical power. As such, SNP-level results were not adjusted for multiple testing.
We performed a cis-expression quantitative trait locus (eQTL) analysis to examine the association between genotype and corresponding gene expression in matched EOC tissue samples. The expression levels between carriers versus noncarriers of the response-associated genotype were compared using the Wilcoxon rank sum test. The in silico tools ANNOVAR33 (http://www.openbioinformatics.org) and SNPInfo34 (http://www.niehs.nih.gov/snpinfo) were used to evaluate the putative function of candidate SNPs.
Results
Subject characteristics
Select clinical and pathologic characteristics of the 361 study participants (102 IRs and 259 CRs) are summarized in Table 1. The mean age at diagnosis (59 years) was similar in the IRs and CRs, all participants had stage III or IV serous ovarian carcinomas and the stage distribution was similar in the IR and CR groups. Most (88%) women had high-grade, aggressive disease. Suboptimal surgical debulking was more common among the IRs compared to the CRs (p < 0.0001). Most women received a combination of paclitaxel and carboplatin for first-line therapy. The mean survival time was 25 months among IRs and 44 months among CRs.
Table 1.
Selected clinical and pathologic characteristics of the study population (N = 361)
| Characteristic | Incomplete responders (IRs) (N = 102) | Complete responders (CRs) (N = 259) | p |
|---|---|---|---|
| Mean age (years) | 59.8 | 59.4 | 0.791 |
| FIGO stage (N, %) | 0.652 | ||
| III | 83 (81) | 216 (83) | |
| IV | 19 (19) | 43 (17) | |
| Grade (N, %) | 0.202 | ||
| Low (I/II) | 15 (15) | 26 (10) | |
| High (III/IV) | 86 (85) | 232 (90) | |
| Surgical debulking (N, %) | <0.00012 | ||
| Optimal (<1 cm) | 58 (58) | 182 (70) | |
| Suboptimal ≥cm) | 40 (39) | 42 (16) |
Data represent counts (percentages) unless otherwise indicated. Counts may not add up to the total due to missing values, and percentages may not equal 100 due to rounding.
t-Test.
Fisher’s exact test.
Associations between CSC germline variation and treatment response
Table 2 includes noncorrelated SNPs (r2 < 0.80) from eight genes (ALDH1A1, COMT, ENG, ESRRB, LIN28, NOTCH1, PROM1 and STAT3) that were associated with treatment response in EOC. After adjustment for age at pathological diagnosis and population substructure, SNPs in STAT3 such as rs62075772 [OR (95% CI): 2.42 (1.47–3.98), p = 0.0005] demonstrated the most significant associations with an incomplete/unfavorable response to platinum-based therapy followed by SNPs in ALDH1A1 such as rs1364455 [OR (95% CI): 2.14 (1.29–3.55), p = 0.0031]. Also shown in Table 2, ESRRB and LIN28 were the only two candidate genes that contained SNPs that were significantly associated with a complete/favorable response to first-line therapy. After adjustment for additional prognostic factors (including high-grade disease and residual disease at debulking), magnitudes of association were slightly attenuated for SNPs in STAT3 (ORs ranging from 2.18 to 2.24), and results remained statistically significant (p < 0.005). For top-ranked STAT3 SNP, rs62075772, stratified analyses revealed that minor allele G carriers with high-grade disease were less likely to be CRs to therapy when compared to noncarriers with high-grade disease (p = 0.08) (Supporting Information Fig. 1). Aside from rare SNP rs74561951 in PROM1 (MAF < 1%), most response-associated SNPs were common (MAF > 0.05) (Table 2).
Table 2.
Cancer stem cell SNPs associated with response to first-line platinum-based therapy in advanced serous ovarian cancer (p < 0.005)
| Chr | Gene | SNP | Location | Alleles1 | MAF | OR (95% CI)2 | p2 | OR (95% CI)3 | p3 |
|---|---|---|---|---|---|---|---|---|---|
| 9 | ALDH1A1 | rs1364455 | Intergenic | C/A | 0.13 | 2.28 (1.31–3.98) | 0.0036 | 2.71 (1.44–5.06) | 0.0018 |
| 9 | ALDH1A1 | rs4744676 | Intergenic | G/A | 0.15 | 2.11 (1.21–3.69) | 0.0090 | 2.71 (1.44–5.11) | 0.0020 |
| 9 | ALDH1A1 | rs10869207 | Intergenic | G/C | 0.14 | 2.11 (1.21–3.68) | 0.0084 | 2.58 (1.38–4.81) | 0.0029 |
| 9 | ALDH1A1 | rs10429484 | Intergenic | A/T | 0.15 | 2.14 (1.29–3.55) | 0.0031 | 2.31 (1.32–4.03) | 0.0032 |
| 9 | ALDH1A1 | rs7038229 | Intergenic | C/T | 0.13 | 2.13 (1.21–3.74) | 0.0088 | 2.55 (1.35–4.81) | 0.0038 |
| 9 | ALDH1A1 | rs11143430 | Intergenic | T/C | 0.08 | 2.16 (1.23–3.78) | 0.0070 | 2.53 (1.35–4.75) | 0.0038 |
| 9 | ALDH1A1 | rs7860295 | Intergenic | T/C | 0.15 | 2.07 (1.22–3.52) | 0.0072 | 2.39 (1.32–4.32) | 0.0039 |
| 22 | COMT | rs4818 | Exonic | C/G | 0.32 | 1.91 (1.12–3.25) | 0.0172 | 2.37 (1.32–4.24) | 0.0036 |
| 22 | COMT | rs4646312 | Intronic | T/C | 0.31 | 1.99 (1.16–3.41) | 0.0126 | 2.34 (1.31–4.19) | 0.0041 |
| 9 | ENG | rs41432051 | Intronic | C/T | 0.15 | 2.03 (1.15–3.59) | 0.0150 | 2.58 (1.39–4.77) | 0.0026 |
| 9 | ENG | rs2417056 | Intronic | C/A | 0.17 | 1.93 (1.07–3.50) | 0.0303 | 2.56 (1.34–4.88) | 0.0045 |
| 9 | ENG | rs16930129 | Exonic | T/A | 0.13 | 1.94 (1.10–3.43) | 0.0218 | 2.45 (1.31–4.55) | 0.0048 |
| 9 | ENG | rs41475247 | Intronic | G/A | 0.12 | 1.88 (1.07–3.30) | 0.0285 | 2.29 (1.24–4.24) | 0.0083 |
| 14 | ESRRB | rs2885232 | Intronic | C/T | 0.41 | 0.50 (0.31–0.80) | 0.0039 | 0.48 (0.29–0.79) | 0.0038 |
| 14 | ESRRB | rs10149196 | Intergenic | G/C | 0.40 | 2.09 (1.27–3.46) | 0.0039 | 2.22 (1.29–3.83) | 0.0041 |
| 14 | ESRRB | rs10083530 | Intergenic | G/A | 0.27 | 0.54 (0.34–0.87) | 0.0109 | 0.47 (0.28–0.79) | 0.0044 |
| 14 | ESRRB | rs13379450 | Intergenic | G/A | 0.40 | 2.06 (1.25–3.40) | 0.0048 | 2.18 (1.27–3.78) | 0.0049 |
| 1 | LIN28 | rs7535902 | Intronic | T/A | 0.13 | 0.51 (0.30–0.86) | 0.0117 | 0.44 (0.25–0.77) | 0.0040 |
| 9 | NOTCH1 | rs11361183 | Intronic | C/T | 0.09 | 2.03 (1.22–3.40) | 0.0066 | 2.22 (1.28–3.85) | 0.0044 |
| 4 | PROM1 | rs74561951 | Intronic | G/T | 0.0009 | 6.99 (1.71–28.5) | 0.0068 | 23.5 (2.66–207) | 0.0045 |
| 17 | STAT3 | rs62075772 | Intronic | A/G | 0.36 | 2.42 (1.47–3.98) | 0.0005 | 2.24 (1.32–3.78) | 0.0027 |
| 17 | STAT3 | rs3883338 | Intronic | G/A | 0.25 | 2.42 (1.48–3.98) | 0.0005 | 2.21 (1.31–3.73) | 0.0030 |
| 17 | STAT3 | rs8072391 | Intronic | G/A | 0.36 | 2.38 (1.45–3.93) | 0.0006 | 2.20 (1.30–3.73) | 0.0033 |
| 17 | STAT3 | rs957971 | Intronic | G/C | 0.46 | 2.33 (1.42–3.82) | 0.0008 | 2.18 (1.29–3.67) | 0.0035 |
Sorted alphabetically by gene; SNPs in linkage disequilibrium (r2 > 0.80) with the index SNPs in the table are not featured; dbSNP 141.
Major/minor allele.
Adjusted for age at pathological diagnosis and population substructure principal components.
Adjusted for age at pathological diagnosis, population substructure principal components, high-grade disease (yes versus no) and residual disease at debulking (suboptimal versus optimal).
Abbreviations: Chr: chromosome; MAF: minor allele frequency; OR: odds ratio; CI: confidence interval.
Gene-level analysis revealed that two of the 24 evaluated CSC-related genes, STAT3 and NOTCH1, were globally associated with an IR to therapy (p < 0.05) (Table 3). Overall, STAT3 was most significantly associated with an IR to therapy (AML ptrend = 0.006), consistent with SNP and haplotype-level analyses, followed by NOTCH1 (AML ptrend = 0.03). Several regions of strong LD (r2 > 0.80) were identified throughout STAT3, namely in blocks 3, 4 and 5 (Figs. 1a and 1b). Haplotype analysis revealed that block 4 in STAT3 (spanning ch17:40499804–40505202; Fig. 1c) that includes rs62075772 was most strongly associated with an incomplete response to therapy (p = 0.0054), complementing SNP-level analyses. Regions of strong LD were also identified in NOTCH1, but haplotype analysis did not yield statistically significant findings (p > 0.01). To be comprehensive, we examined haplotype associations for the other six genes (ALDH1A1, COMT, ENG, ESRRB, LIN28 and PROM1) containing SNPs associated with response status and did not observe any statistically significant associations.
Table 3.
Cancer stem cell genes and their association with an incomplete response to therapy among patients with advanced ovarian cancer
| Gene | N SNPS | AML (trend) |
|---|---|---|
| STAT3 | 173 | 0.006 |
| NOTCH1 | 179 | 0.03 |
| ALDH1A1 | 643 | 0.094 |
| ENG | 130 | 0.184 |
| LIN28A | 60 | 0.186 |
| PROM1 | 629 | 0.189 |
| NES | 29 | 0.24 |
| HES1 | 3 | 0.287 |
| COMT | 206 | 0.321 |
| NANOG | 59 | 0.409 |
| LIN28B | 277 | 0.509 |
| ABCG2 | 667 | 0.643 |
| KLF4 | 4 | 0.683 |
| MYC | 20 | 0.734 |
| BMI1 | 9 | 0.752 |
| ESRRB | 1072 | 0.776 |
| KIT | 292 | 0.78 |
| POU5F1B | 15 | 0.781 |
| CXCR4 | 11 | 0.781 |
| EPCAM | 222 | 0.947 |
| CD44 | 486 | 0.95 |
| THY1 | 16 | 0.972 |
| SOX2 | 1 | NA |
| THAP11 | 1 | NA |
Genes with P < 0.05 appear in bold.
Figure 1.
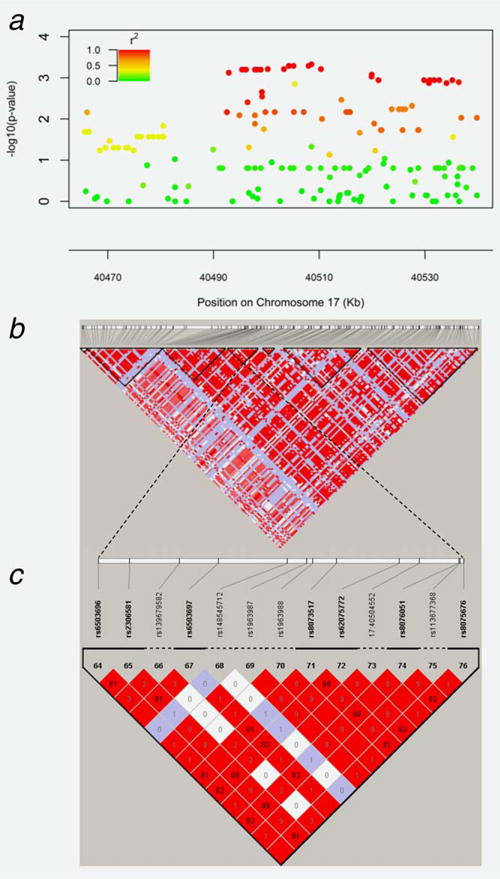
Linkage disequilibrium pattern of the STAT3 gene. (a) Regional association plot demonstrating that several SNPs within STAT3 are significantly associated with response to platinum-based chemotherapy in EOC. (b) LD map of STAT3 gene based on D′ (coefficient of linkage disequilibrium). (c) Polymorphisms within haplotype block 4, including rs62075772, are strongly correlated, and are associated with an unfavorable response to platinum-based chemotherapy.
Correlations between germline SNPs in STAT3 and gene expression in tumor tissue
Analysis of STAT3 gene expression in EOC tissue from 316 cases revealed slightly higher mean STAT3 tissue expression in 93 IRs compared to 223 CRs, though this finding was not statistically significant (p = 0.15). To determine the potential functional consequences of germline variants in STAT3, we investigated whether STAT3 expression in the 316 serous EOC tumors varied by allele. Most identified STAT3 variants were intronic, and no differences were observed in tumor STAT3 expression by STAT3 genotype. However, for rs1053004 (G>A), a variant that lies in a predicted miRNA-binding site for miR-423-5p within the 3′ untranslated region (UTR) of STAT3, slightly lower STAT3 tumor expression was observed in a dose-response manner in those with AA vs. GA vs. GG genotype (p = 0.058) and in A allele carriers compared to noncarriers (p = 0.043) (Figs. 2a and 2b, respectively). SNP rs1053004 and top-ranked STAT3 SNP rs62075772 (Table 2) are in moderate LD within our cohort population (r2 = 0.67) as well as within European populations of 1000 genome project (phase 3, CEU + TSI + FIN + GBR + IBS: r2 = 0.62).
Figure 2.
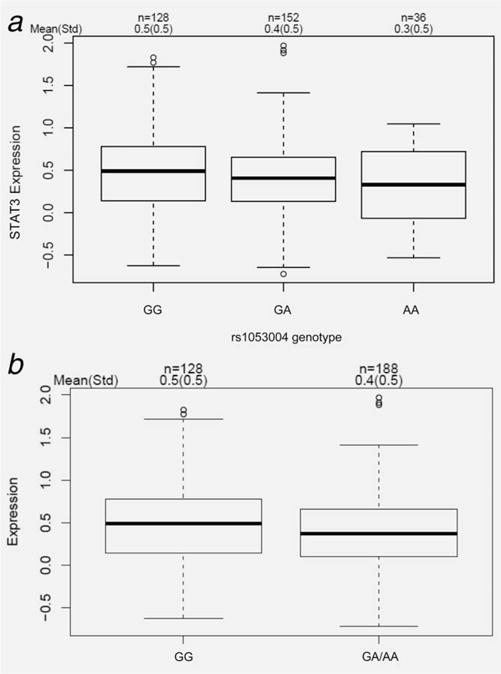
rs1053004 (G>A) genotype is associated with STAT3 expression in high-grade serous ovarian tumor tissues. (a) STAT3 expression among GG vs.GA vs. AA genotype. (b) Comparison of STAT3 expression in GG vs. GA/AA carriers.
Using dbSNP and ANNOVAR,33 we identified two coding STAT3 missense variants (rs1064122 and rs11547455) within the same haplotype block as rs1053004 (spanning 17:40466092-40485239), which are predicted to be probably damaging. Neither of these SNPs was directly genotyped or imputed in this study, precluding accurate estimation of LD. Nonetheless, it is possible that these and other unidentified SNPs may have a functional role in regulating STAT3 expression and contributing to treatment response in EOC.
Discussion
CSCs have been associated with EOC progression and chemoresponse.8 Here, we conducted the first comprehensive association study of germline polymorphisms in CSC-related genes and response to first-line platinum-based combination therapy in women with advanced-stage ovarian cancer. At the SNP, haplotype and gene level, the most statistically significant associations with an increased risk for an incomplete response to therapy were observed for signal transducer and activator of transcription 3 (STAT3), a transcription factor that has been shown to act as an oncogene in several malignancies.35,36
STAT3 is activated in response to the binding of numerous cytokines, hormones and growth factors to their receptors and by activation of intracellular kinases.36 Phosphorylation of STAT3 (pSTAT3) causes it to dimerize and translocate from the cytoplasm to the nucleus where it promotes the transcription of genes that affect growth, differentiation and survival.36 A study in China showed that STAT3 and pSTAT3 protein expression was significantly higher in EOC tissues than in normal ovarian epithelial tissues or benign ovarian tumor tissues,37 supporting an oncogenic role. Moreover, women who had tumors with positive expression of pSTAT3 had poorer survival compared with women who had tumors with negative pSTAT3 expression (p < 0.01).37 Although we did not evaluate pSTAT3 expression, we did observe increased expression of STAT3 in IRs (shorter term survivors) compared to CRs (longer term survivors). Thus, STAT3 signaling appears to contribute to invasion, prognosis and chemoresistance in EOC, and our findings suggest that germline STAT3 genotype may help mediate these outcomes.
Indeed, STAT3 genotype has previously been associated with response to standard chemotherapy in other malignancies. A G>C SNP in the 5′ region of STAT3 (rs4796793) was the most significant predictor of a favorable response to interferon-a therapy in patients with metastatic renal cell carcinoma.19,20 rs4796793 C allele carriers, which were observed more frequently among IFN-α responders, tended to have lower STAT3 expression in their matched tumor tissue. rs4796793 was not a top-ranked SNP in our dataset. In patients with acute myeloid leukemia,21 rs9909659 was associated with increased resistance to daunorubicin chemotherapy and was marginally associated (p = 0.049) with an incomplete response to platinum-based therapy among women with EOC in our dataset.
Our observational findings combined with recent experimental investigations showing the involvement of STAT3 signaling in the induction of chemoresistance in EOCs38–40 suggest that germline STAT3 polymorphisms may influence sensitivity of EOCs to platinum-based therapy. Thus, for women newly diagnosed with EOC, STAT3 genotype status could possibly serve as a diagnostic marker of initial platinum resistance. Importantly, based on emerging data regarding the promise of JAK2-STAT3 inhibitors for therapeutic intervention in EOC, STAT3 genotype may also act as a “trigger” for offering novel rational combination therapies involving such inhibitors. For example, inhibition of JAK2 with diindolymethane induced apoptosis in EOC cells,41 and the JAK2 inhibitor AZD1480 increased sensitivity of EOC cell lines by inhibiting STAT3 activation.42 Additionally, curcumin has been shown to suppress STAT3 activation and growth of EOC cells by upregulating the STAT3 inhibitor PIAS-3,43 corosolic acid enhanced antitumor effects of chemotherapy on EOC cells by inhibiting STAT3 signaling38 and HO-3867, a safe STAT3 inhibitor, has been shown to inhibit EOC migration, invasion and survival.44 Furthermore, inhibition of the JAK2/STAT3 pathway using CYT387 in combination with paclitaxel suppressed the “stemness” profile in chemotherapy-treated residual cells in vitro and in vivo, leading to reduced tumor burden.45,46 Simultaneous or sequential combinations of JAK2/STAT3 inhibitors with platinum compounds therefore hold promise and warrant evaluation as part of future experimental investigations and clinical trials in EOC.
Strengths of our study include the novelty of the topic area, the multitiered genomic evaluation and the larger sample size compared to other studies that reported associations between CSC-related SNPs and response to therapy.16,17,19–21 Another strength is the relatively homogeneous population of women treated for their diagnosis of advanced serous EOC, though it has been recognized that there is vast diversity in the combinations of platinum- and taxane-based adjuvant treatments that these patients have endured.47 We recognize the possibility of false-positive results and the importance of attempting to replicate these findings, and plan to do so once denser genotype and imputed data and detailed clinical follow-up data become available from a large, independent cohort of EOC cases genotyped by the international Ovarian Cancer Association Consortium (OCAC).48 Mechanistic studies to assess how the most promising STAT3 polymorphisms affect oncogenic phenotypes will also be important. For example, interplay between miRNAs and the STAT3 signaling pathway has recently been reported.49 Given our detection of an association between STAT3 tissue expression and rs1053004, a SNP in a putative miRNA-binding site for miR-423-5p, a regulator of cell proliferation, invasion and progression,50,51 investigations of STAT3 genotype, miRNA expression and STAT3 expression seem warranted and are the focus of future research efforts.
In summary, this study provides the first evidence that germline polymorphisms in CSC-related genes, and STAT3 in particular, may influence response to first-line platinum-based combination therapy in EOC. This information may someday help to select a subgroup of women who may benefit from newly developed CSC-targeting drugs. Future biomarker-embedded translational trials are needed to extend upon these findings.
Supplementary Material
What’s new?
This study identified genomic biomarkers that may predict a woman’s response to ovarian cancer treatment. Self-renewing cancer stem cells are key to ovarian cancer’s development and spread, and the authors tested more than 5,500 SNPs in 24 ovarian cancer stem cell-related genes and compared the relationship between genotype and the patient’s response to first-line ovarian cancer treatment. They identified variants in the STAT3 gene as predicting an unfavorable response to treatment, suggesting that testing this gene could help identify patients who may respond more favorably to combination therapy, possibly including STAT3 inhibitors.
Acknowledgments
This study was supported by W81XWH-08-2-0101 from the Department of Defense/National Functional Genomics Center (PI: J. Permuth-Wey). The research was also made possible through the Total Cancer Care™ Protocol at the H. Lee Moffitt Cancer Center & Research Institute and by the Collaborative Data Services, Tissue, Molecular Genomics, Biostatistics, and Cancer Informatics Core Facilities at the H. Lee Moffitt Cancer Center & Research Institute, an NCI-designated Comprehensive Cancer Center (P30-CA076292).
Footnotes
Additional Supporting Information may be found in the online version of this article.
Conflicts of interest: Nothing to report
References
- 1.American Cancer Society. Cancer facts and figures 2015. Atlanta, GA: American Cancer Society; 2015. [Google Scholar]
- 2.Pignata S, Cannella L, Leopardo D, et al. Chemotherapy in epithelial ovarian cancer. Cancer Lett. 2011;303:73–83. doi: 10.1016/j.canlet.2011.01.026. [DOI] [PubMed] [Google Scholar]
- 3.Sorrentino A, Liu CG, Addario A, et al. Role of microRNAs in drug-resistant ovarian cancer cells. Gynecol Oncol. 2008;111:478–86. doi: 10.1016/j.ygyno.2008.08.017. [DOI] [PubMed] [Google Scholar]
- 4.Tothill RW, Tinker AV, George J, et al. Novel molecular subtypes of serous and endometrioid ovarian cancer linked to clinical outcome. Clin Cancer Res. 2008;14:5198–208. doi: 10.1158/1078-0432.CCR-08-0196. [DOI] [PubMed] [Google Scholar]
- 5.Bast RC, Jr, Hennessy B, Mills GB. The biology of ovarian cancer: new opportunities for translation. Nat Rev Cancer. 2009;9:415–28. doi: 10.1038/nrc2644. [DOI] [PMC free article] [PubMed] [Google Scholar]
- 6.Paige AJ, Brown R. Pharmaco(epi)genomics in ovarian cancer. Pharmacogenomics. 2008;9:1825–34. doi: 10.2217/14622416.9.12.1825. [DOI] [PubMed] [Google Scholar]
- 7.Marsh S. Pharmacogenomics of taxane/platinum therapy in ovarian cancer. Int J Gynecol Cancer. 2009;19(Suppl 2):S30–S34. doi: 10.1111/IGC.0b013e3181c10513. [DOI] [PubMed] [Google Scholar]
- 8.Ahmed N, Abubaker K, Findlay J, et al. Cancerous ovarian stem cells: obscure targets for therapy but relevant to chemoresistance. J Cell Biochem. 2013;114:21–34. doi: 10.1002/jcb.24317. [DOI] [PubMed] [Google Scholar]
- 9.Foster R, Buckanovich RJ, Rueda BR. Ovarian cancer stem cells: working towards the root of stemness. Cancer Lett. 2013;338:147–57. doi: 10.1016/j.canlet.2012.10.023. [DOI] [PubMed] [Google Scholar]
- 10.Tomao F, Papa A, Strudel M, et al. Investigating molecular profiles of ovarian cancer: an update on cancer stem cells. J Cancer. 2014;5:301–10. doi: 10.7150/jca.8610. [DOI] [PMC free article] [PubMed] [Google Scholar]
- 11.Burgos-Ojeda D, Rueda BR, Buckanovich RJ. Ovarian cancer stem cell markers: prognostic and therapeutic implications. Cancer Lett. 2012;322:1–7. doi: 10.1016/j.canlet.2012.02.002. [DOI] [PMC free article] [PubMed] [Google Scholar]
- 12.Bapat SA. Human ovarian cancer stem cells. Reproduction. 2010;140:33–41. doi: 10.1530/REP-09-0389. [DOI] [PubMed] [Google Scholar]
- 13.Peng S, Maihle NJ, Huang Y. Pluripotency factors Lin28 and Oct4 identify a sub-population of stem cell-like cells in ovarian cancer. Oncogene. 2010;29:2153–9. doi: 10.1038/onc.2009.500. [DOI] [PubMed] [Google Scholar]
- 14.Lu L, Katsaros D, Shaverdashvili K, et al. Pluripotent factor lin-28 and its homologue lin-28b in epithelial ovarian cancer and their associations with disease outcomes and expression of let-7a and IGF-II. Eur J Cancer. 2009;45:2212–18. doi: 10.1016/j.ejca.2009.05.003. [DOI] [PubMed] [Google Scholar]
- 15.Deng S, Yang X, Lassus H, et al. Distinct expression levels and patterns of stem cell marker, aldehyde dehydrogenase isoform 1 (ALDH1), in human epithelial cancers. PLoS One. 2010;5:e10277. doi: 10.1371/journal.pone.0010277. [DOI] [PMC free article] [PubMed] [Google Scholar]
- 16.Winder T, Ning Y, Yang D, et al. Germline polymorphisms in genes involved in the CD44 signaling pathway are associated with clinical outcome in localized gastric adenocarcinoma. Int J Cancer. 2011;129:1096–104. doi: 10.1002/ijc.25787. [DOI] [PMC free article] [PubMed] [Google Scholar]
- 17.Gerger A, Zhang W, Yang D, et al. Common cancer stem cell gene variants predict colon cancer recurrence. Clin Cancer Res. 2011;17:6934–43. doi: 10.1158/1078-0432.CCR-11-1180. [DOI] [PubMed] [Google Scholar]
- 18.Pohl A, El-Khoueiry A, Yang D, et al. Pharmacogenetic profiling of CD133 is associated with response rate (RR) and progression-free survival (PFS) in patients with metastatic colorectal cancer (mCRC), treated with bevacizumab-based chemotherapy. Pharmacogenomics J. 2013;13:173–80. doi: 10.1038/tpj.2011.61. [DOI] [PMC free article] [PubMed] [Google Scholar]
- 19.Eto M, Kamba T, Miyake H, et al. STAT3 polymorphism can predict the response to interferon-alpha therapy in patients with metastatic renal cell carcinoma. Eur Urol. 2013;63:745–52. doi: 10.1016/j.eururo.2012.09.052. [DOI] [PubMed] [Google Scholar]
- 20.Ito N, Eto M, Nakamura E, et al. STAT3 polymorphism predicts interferon-alfa response in patients with metastatic renal cell carcinoma. J Clin Oncol. 2007;25:2785–91. doi: 10.1200/JCO.2006.09.8897. [DOI] [PubMed] [Google Scholar]
- 21.Zhong Y, Feng J, Chen B, et al. Signal transducer and activator of transcription 3 (STAT3) gene polymorphisms are associated with treatment outcomes in acute myeloid leukemia. Int J Lab Hematol. 2012;34:383–9. doi: 10.1111/j.1751-553X.2012.01406.x. [DOI] [PubMed] [Google Scholar]
- 22.Permuth-Wey J, Sellers TA. Epidemiology of ovarian cancer. Methods Mol Biol. 2009;472:413–37. doi: 10.1007/978-1-60327-492-0_20. [DOI] [PubMed] [Google Scholar]
- 23.Cancer Genome Atlas Research Network. Integrated genomic analyses of ovarian carcinoma. Nature. 2011;474:609–15. doi: 10.1038/nature10166. [DOI] [PMC free article] [PubMed] [Google Scholar]
- 24.Permuth-Wey J, Chen YA, Tsai YY, et al. Inherited variants in mitochondrial biogenesis genes may influence epithelial ovarian cancer risk. Cancer Epidemiol Biomarkers Prev. 2011;20:1131–45. doi: 10.1158/1055-9965.EPI-10-1224. [DOI] [PMC free article] [PubMed] [Google Scholar]
- 25.Fenstermacher DA, Wenham RM, Rollison DE, et al. Implementing personalized medicine in a cancer center. Cancer J. 2011;17:528–36. doi: 10.1097/PPO.0b013e318238216e. [DOI] [PMC free article] [PubMed] [Google Scholar]
- 26.Miller AB, Hoogstraten B, Staquet M, et al. Reporting results of cancer treatment. Cancer. 1981;47:207–14. doi: 10.1002/1097-0142(19810101)47:1<207::aid-cncr2820470134>3.0.co;2-6. [DOI] [PubMed] [Google Scholar]
- 27.Rustin GJ, Nelstrop AE, Bentzen SM, et al. Use of tumour markers in monitoring the course of ovarian cancer. Ann Oncol. 1999;10(Suppl 1):21–7. doi: 10.1023/a:1008351216605. [DOI] [PubMed] [Google Scholar]
- 28.Li Q, Seo JH, Stranger B, et al. Integrative eQTL-based analyses reveal the biology of breast cancer risk loci. Cell. 2013;152:633–41. doi: 10.1016/j.cell.2012.12.034. [DOI] [PMC free article] [PubMed] [Google Scholar]
- 29.Howie B, Fuchsberger C, Stephens M, et al. Fast and accurate genotype imputation in genome-wide association studies through pre-phasing. Nat Genet. 2012;44:955–9. doi: 10.1038/ng.2354. [DOI] [PMC free article] [PubMed] [Google Scholar]
- 30.Price AL, Patterson NJ, Plenge RM, et al. Principal components analysis corrects for stratification in genome-wide association studies. Nat Genet. 2006;38:904–9. doi: 10.1038/ng1847. [DOI] [PubMed] [Google Scholar]
- 31.Tyrer JP, Guo Q, Easton DF, et al. The admixture maximum likelihood test to test for association between rare variants and disease phenotypes. BMC Bioinformatics. 2013;14:177. doi: 10.1186/1471-2105-14-177. [DOI] [PMC free article] [PubMed] [Google Scholar]
- 32.Schaid DJ, Rowland CM, Tines DE, et al. Score tests for association between traits and haplotypes when linkage phase is ambiguous. Am J Hum Genet. 2002;70:425–34. doi: 10.1086/338688. [DOI] [PMC free article] [PubMed] [Google Scholar]
- 33.Wang K, Li M, Hakonarson H. ANNOVAR: functional annotation of genetic variants from high-throughput sequencing data. Nucleic Acids Res. 2010;38:e164. doi: 10.1093/nar/gkq603. [DOI] [PMC free article] [PubMed] [Google Scholar]
- 34.Xu Z, Taylor JA. SNPinfo: integrating GWAS and candidate gene information into functional SNP selection for genetic association studies. Nucleic Acids Res. 2009;37:W600–W605. doi: 10.1093/nar/gkp290. [DOI] [PMC free article] [PubMed] [Google Scholar]
- 35.Lavecchia A, Di Giovanni C, Novellino E. STAT-3 inhibitors: state of the art and new horizons for cancer treatment. Curr Med Chem. 2011;18:2359–75. doi: 10.2174/092986711795843218. [DOI] [PubMed] [Google Scholar]
- 36.Tan FH, Putoczki TL, Stylli SS, et al. The role of STAT3 signaling in mediating tumor resistance to cancer therapy. Curr Drug Targets. 2014;15:1341–53. doi: 10.2174/1389450115666141120104146. [DOI] [PubMed] [Google Scholar]
- 37.Min H, Wei-Hong Z. Constitutive activation of signal transducer and activator of transcription 3 in epithelial ovarian carcinoma. J Obstet Gynaecol Res. 2009;35:918–25. doi: 10.1111/j.1447-0756.2009.01045.x. [DOI] [PubMed] [Google Scholar]
- 38.Fujiwara Y, Takaishi K, Nakao J, et al. Corosolic acid enhances the antitumor effects of chemotherapy on epithelial ovarian cancer by inhibiting signal transducer and activator of transcription 3 signaling. Oncol Lett. 2013;6:1619–23. doi: 10.3892/ol.2013.1591. [DOI] [PMC free article] [PubMed] [Google Scholar]
- 39.Han Z, Feng J, Hong Z, et al. Silencing of the STAT3 signaling pathway reverses the inherent and induced chemoresistance of human ovarian cancer cells. Biochem Biophys Res Commun. 2013;435:188–94. doi: 10.1016/j.bbrc.2013.04.087. [DOI] [PubMed] [Google Scholar]
- 40.Sheng WJ, Jiang H, Wu DL, et al. Early responses of the STAT3 pathway to platinum drugs are associated with cisplatin resistance in epithelial ovarian cancer. Braz J Med Biol Res. 2013;46:650–8. doi: 10.1590/1414-431X20133003. [DOI] [PMC free article] [PubMed] [Google Scholar]
- 41.Kandala PK, Srivastava SK. Regulation of Janus-activated kinase-2 (JAK2) by diindolylmethane in ovarian cancer in vitro and in vivo. Drug Discov Ther. 2012;6:94–101. [PubMed] [Google Scholar]
- 42.Hedvat M, Huszar D, Herrmann A, et al. The JAK2 inhibitor AZD1480 potently blocks Stat3 signaling and oncogenesis in solid tumors. Cancer Cell. 2009;16:487–97. doi: 10.1016/j.ccr.2009.10.015. [DOI] [PMC free article] [PubMed] [Google Scholar]
- 43.Saydmohammed M, Joseph D, Syed V. Curcumin suppresses constitutive activation of STAT-3 by up-regulating protein inhibitor of activated STAT-3 (PIAS-3) in ovarian and endometrial cancer cells. J Cell Biochem. 2010;110:447–56. doi: 10.1002/jcb.22558. [DOI] [PubMed] [Google Scholar]
- 44.Rath KS, Naidu SK, Lata P, et al. HO-3867, a safe STAT3 inhibitor, is selectively cytotoxic to ovarian cancer. Cancer Res. 2014;74:2316–27. doi: 10.1158/0008-5472.CAN-13-2433. [DOI] [PMC free article] [PubMed] [Google Scholar]
- 45.Abubaker K, Luwor RB, Escalona R, et al. Targeted disruption of the JAK2/STAT3 pathway in combination with systemic administration of paclitaxel inhibits the priming of ovarian cancer stem cells leading to a reduced tumor burden. Front Oncol. 2014;4:75. doi: 10.3389/fonc.2014.00075. [DOI] [PMC free article] [PubMed] [Google Scholar]
- 46.Abubaker K, Luwor RB, Zhu H, et al. Inhibition of the JAK2/STAT3 pathway in ovarian cancer results in the loss of cancer stem cell-like characteristics and a reduced tumor burden. BMC Cancer. 2014;14:317. doi: 10.1186/1471-2407-14-317. [DOI] [PMC free article] [PubMed] [Google Scholar]
- 47.Hsu FH, Serpedin E, Hsiao TH, et al. Reducing confounding and suppression effects in TCGA data: an integrated analysis of chemotherapy response in ovarian cancer. BMC Genomics. 2012;13(Suppl 6):S13. doi: 10.1186/1471-2164-13-S6-S13. [DOI] [PMC free article] [PubMed] [Google Scholar]
- 48.Fasching PA, Gayther S, Pearce L, et al. Role of genetic polymorphisms and ovarian cancer susceptibility. Mol Oncol. 2009;3:171–81. doi: 10.1016/j.molonc.2009.01.008. [DOI] [PMC free article] [PubMed] [Google Scholar]
- 49.Cao Q, Li YY, He WF, et al. Interplay between microRNAs and the STAT3 signaling pathway in human cancers. Physiol Genom. 2013;45:1206–14. doi: 10.1152/physiolgenomics.00122.2013. [DOI] [PubMed] [Google Scholar]
- 50.Liu J, Wang X, Yang X, et al. miRNA423-5p regulates cell proliferation and invasion by targeting trefoil factor 1 in gastric cancer cells. Cancer Lett. 2014;347:98–104. doi: 10.1016/j.canlet.2014.01.024. [DOI] [PubMed] [Google Scholar]
- 51.Lin J, Huang S, Wu S, et al. MicroRNA-423 promotes cell growth and regulates G(1)/S transition by targeting p21Cip1/Waf1 in hepatocellular carcinoma. Carcinogenesis. 2011;32:1641–7. doi: 10.1093/carcin/bgr199. [DOI] [PubMed] [Google Scholar]
Associated Data
This section collects any data citations, data availability statements, or supplementary materials included in this article.