Abstract
Direct spectroscopic evidence for hydrogen‐bonded clusters of like‐charged ions is reported for ionic liquids. The measured infrared O−H vibrational bands of the hydroxyethyl groups in the cations can be assigned to the dispersion‐corrected DFT calculated frequencies of linear and cyclic clusters. Compensating the like‐charge Coulomb repulsion, these cationic clusters can range up to cyclic tetramers resembling molecular clusters of water and alcohols. These ionic clusters are mainly present at low temperature and show strong cooperative effects in hydrogen bonding. DFT‐D3 calculations of the pure multiply charged clusters suggest that the attractive hydrogen bonds can compete with repulsive Coulomb forces.
Keywords: DFT calculations, hydrogen bonding, ionic liquids, IR spectroscopy, like-charge interaction
Van der Waals clusters have been intensively studied in the gas and the liquid phase.1, 2, 3, 4, 5, 6 The weakly bound complexes provided important scientific advances in understanding cooperativity in hydrogen bonding, hydrogen‐bond networks and finally the behaviour of the pure liquid phase. For ionic liquids (ILs), which consist solely of ions, strong and directional intermolecular bonding is only reported for the opposite charged constituents. The attractive Coulomb interaction between cation and anion is enhanced by local and directional hydrogen bonding which can have significant influence on the IL properties such as viscosity and conductivity.7, 8, 9, 10, 11 The counter‐intuitive phenomenon of association of like‐charged ions was never considered because such interaction was supposed to be not competitive with the usually strong cation‐anion interaction in ILs. In general, attractive interaction between ions of like charge could be reported for salt solutions but required the mediation of the solvent molecules.12, 13, 14, 15, 16, 17 In this study, we want to show that the formation of clusters of like‐charged ions is possible in pure ionic liquids. Cation‐cation clusters are stabilized in particular at low temperatures and show the same infrared spectroscopic features as molecular clusters due to cooperative hydrogen bonding. The largest cluster observed here is a cyclic tetramer of cations with a four plus net charge exhibiting similar spectral features as cyclic tetramers of H‐bonded propanol molecules.
Here, we report measurements of the infrared (IR) spectra of the ionic liquids 1‐(2‐hydroxyethyl)‐3‐methylimidazolium tetrafluoro‐borate [HEMIm][BF4] (IL I) in mixtures with 1‐propyl‐3‐methylimidazolium tetrafluoroborate [PMIm][BF4] (IL II) and their mixtures. Only the 1‐(2‐hydroxyethyl)‐3‐methylimidazolium cation in IL I includes the functional OH group providing possible hydrogen bonding to the tetrafluoroborate anion and/or to the hydroxyl groups of other cations. We prepared mixtures of both ILs with 10, 25, 50, 75 and 100 mol % of IL I. Because IL II does not show vibrational modes in the O‐H stretching region, it is used as background throughout to avoid fringes from subtracting the empty cell contributions. All the IR spectra are shown as a function of the temperature between 213 and 353 K in Figures 1 a and 2 a–d.
Figure 1.
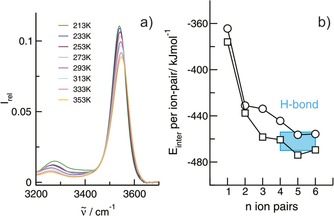
a) Infrared spectra in the O−H stretch region of IL I (1‐(2‐hydroxyethyl)‐3‐methylimidazolium tetrafluoroborate) in the 10 mol % mixture with IL II (1‐propyl‐3‐methylimidazolium tetrafluoroborate) as a function of temperature between 213 and 353 K. b) B3LYP/6‐31+G*‐D3 calculated interaction energies per ion‐pair for clusters of IL I (squares) and IL II (circles) with n=1–6 ion‐pairs. The difference in interaction energy between IL I and IL II clusters is similar from the tetramers on and accounts for the average H‐bond energy of about 16 kJ mol−1 between cation and anion (as indicated by the blue box).
Figure 2.
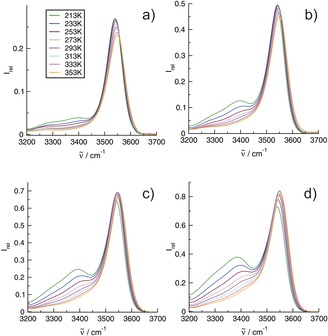
Infrared spectra in the O−H stretch region of the IL I (1‐(2‐hydroxyethyl)‐3‐methylimidazolium tetrafluoroborate) in mixtures with the IL II (1‐propyl‐3‐methylimidazolium tetrafluoroborate) as a function of the temperature between 213 and 353 K: a) 25 mol %, b) 50 mol %, c) 75 mol % and d) 100 mol % of IL I.
The spectrum for the lowest IL I concentration of 10 mol % shows a nice isolated and symmetric vibrational band in the O−H stretch region at 3541 cm−1 (Figure 1 a). This vibrational feature can be attributed to OH groups interacting with BF4 anions via hydrogen bonding. As known from earlier studies, such H‐bonds with weakly interacting anions result in moderate redshifts of the OH frequencies.18, 19 For quantifying the cation‐anion H‐bond, we calculated the interaction energies per ion‐pair in clusters with sizes n=1–6 for both ILs at the B3LYP/6‐31+G*‐D3 level of theory.20, 21, 22 From the tetramer (n=4) on, the interaction energies for both ILs do not change significantly and the energy differences remain constant as shown in Figure 1 b. The average H‐bond energy OH⋅⋅⋅BF4 can be estimated to be 16 kJ mol−1 and is in the order of HB energies reported for water and alcohol dimers (see the Supporting Information, SI).23, 24, 25, 26, 27
In the 10 mol % mixture, the density of the OH functional groups is low and should hardly allow the formation of OH⋅⋅⋅OH bound cation–cation clusters (Figure 1 a). Even at the lowest temperature (213 K), the shapes of the spectra do not change significantly. The vibrational bands indicating the cation–anion H‐bond are only slightly redshifted and their intensities are enhanced with decreasing temperature. However, the spectrum at 213 K shows an additional vibrational band at 3278 cm−1 (Figure 1 a). This low‐intensity band will be discussed later in more detail. If we now increase the concentration of IL I from 10 mol % up to the pure liquid and thus increase the OH density in the mixtures, new vibrational bands arise in the spectra in particular at the lower temperatures (Figure 2 a–d). They are significantly redshifted compared to the vibrational bands indicating the cation–anion (c–a) H‐bonds. The intensities of these vibrational features increase with increasing OH density for all temperatures. For the fixed OH densities, the redshifted vibrational bands are strongly enhanced with decreasing temperature as shown in Figures 1 a and 2 a–d. The intensities of all vibrational bands change smoothly with the temperature, indicating no phase transition. In Figure 3 a, the concentration‐dependent spectra are shown for the lowest temperature at 213 K. It is observed that the c–a vibrational band at 3541 cm−1 does not increase linearly with the OH density and loses intensity in favour of the strongly enhanced redshifted vibrational bands. The intensities from the deconvoluted spectra in Figure 3 a are given in the SI. Overall, the measured infrared spectra as a function of concentration and temperature clearly indicate that these vibrational bands can only stem from OH⋅⋅⋅OH cation‐cation (c‐c) hydrogen bonds resulting in H‐bonded clusters of like‐charged ions.
Figure 3.
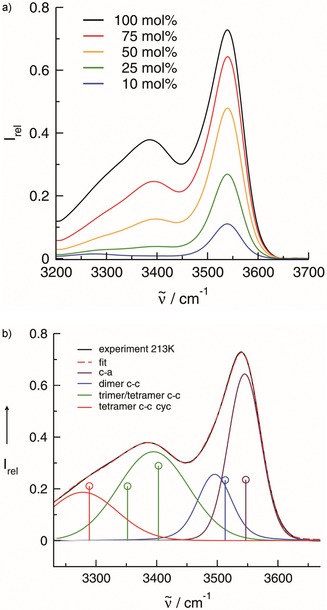
a) Measured infrared spectra in the O−H stretch region of the IL I (1‐(2‐hydroxyethyl)‐3‐methylimidazolium tetrafluoroborate) in mixtures with the IL II (1‐propyl‐3‐methylimidazolium tetrafluoroborate). The spectrum at the lowest temperature (213 K) is shown as a function of the concentration. With increasing OH density, enhanced intensities for the redshifted vibrational modes are observed. b) The IR spectrum of the pure IL I at the lowest temperature (213 K) can be decomposed into four vibrational bands at 3545, 3496, 3395 and 3278 cm−1, respectively. The assignment of the vibrational bands to the c–a, the c–c dimer, the c–c trimer and tetramer as well as the cyclic c–c tetramer results from B3LYP/6‐31+G*‐D3 calculations of clusters as shown in Scheme 1. The calculated average frequencies and intensities for these clusters are indicated as drop lines in the same color as the deconvoluted bands (see the SI).
For the assignment of the measured IR spectra, we calculated two types of H‐bonded clusters, c–a and c–c, including up to four ion pairs, as illustrated in Scheme 1.
Scheme 1.
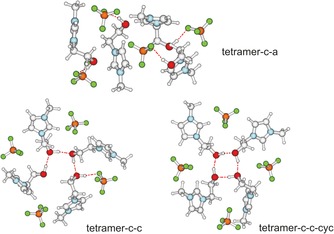
B3LYP/6‐31G*‐D3 calculated structures of possible tetrameric clusters including four ion pairs: tetramer c–a, including solely cation–anion pairs characterized by OH⋅⋅⋅F hydrogen bonds; tetramer c–c, with additional cation–cation interaction resulting in cooperative hydrogen bonding OH⋅⋅⋅OH⋅⋅⋅OH⋅⋅⋅OH⋅⋅⋅F; and tetramer c–c‐cyc, showing a strongly cooperative H‐bonded cyclic tetramer of cations via (OH⋅⋅⋅O)4 bonds.
In clusters c–a, only OH frequencies from H‐bonding between cation and anion are present. These frequencies are used as a reference. In clusters c–c, the OH groups form solely H‐bonds among the cations. Additionally, the terminal OH is interacting with one of the anions. The c‐c clusters include a dimer, linear trimer and tetramer plus an additional cyclic tetramer showing all the features of molecular clusters for water and alcohols (see the SI).1, 2, 3, 4, 5, 6, 23, 24, 25, 26, 27, 28 In Figure 3 b, the calculated redshifts of the c–c relative to the c–a frequencies are shown. The calculated redshifts can be attributed to the deconvoluted vibrational bands of the measured spectra. The second strongest redshifted band can be related to the frequencies of the linear trimer and the linear tetramer. Both frequencies are very close and cannot be resolved in the measured IR spectra. Overall, the measured IR intensities can be attributed to a dimer, linear trimer and/or tetramer and cyclic tetramer indicated by the strongest redshift due to cooperative effects. Surprisingly, the strongest redshifted vibrational band of the cyclic tetramer at 3278 cm−1 also occurs in the spectra of the 10 mol % mixtures at low temperature (as shown in Figure 1 a). A reasonable argument could be that the formation of cyclic clusters is strongly favoured over that of linear structures in the less polar environment of IL II. Such cyclic cluster formation is comparable to that of alcohols in apolar solvents. In the environment of tetrachloromethane, alcohols tend to form cyclic clusters thereby maximizing cooperative hydrogen bonding which leads to characteristic redshifts in the IR spectra and downfield shifts in the NMR spectra.6, 24, 25, 26 (Figure 1 a)
For that purpose, the calculated OH redshifts for the IL I clusters are compared with those from molecular clusters of propanol. All redshifts were taken relative to the corresponding dimer frequencies, as shown in Figure 4 a. Obviously, cooperative effects in hydrogen bonding are similar in molecular clusters and clusters of like‐charged ions in ILs. Although weaker interacting due to repulsive Coulomb forces and due to the absence of counterions, even the pure cationic clusters show this kind of behavior. Cooperativity is strongest for the cyclic tetramers, as shown in Scheme 2. The B3LYP/6‐31+G*‐D3 optimized structures of all cyclic tetramers show that the linearity of the H‐bonds decrease in the order propanol, IL and pure cationic clusters.
Figure 4.
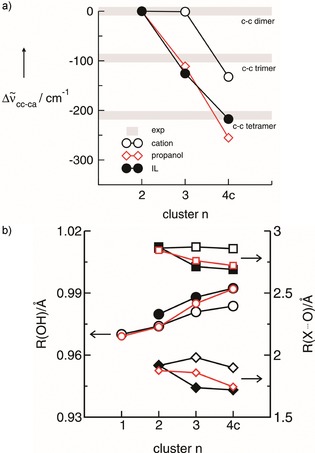
a) Plot of the calculated O−H vibrational redshifts for the trimers and cyclic tetramers of IL I (filled circles), propanol (diamonds) and cation–cation (open circles) relative to the corresponding c–c linear dimers (set to zero). For comparison, the redhifts of the deconvoluted bands of the measured spectra are shown as grey bars. The calculated redshifts strongly suggest that all species are present in the liquid. Moreover, it is shown that c–c clusters of the IL show similar redshifts as the propanol clusters. Although the pure cationic clusters (open circles) show smaller redhifts, cooperative hydrogen bonding is present in particular in the cyclic tetramer. b) The intramolecular bond lengths, R(OH) (left axis, circles) and the intermolecular bond distances, R(H⋅⋅⋅O) (right axis, diamonds) and R(O⋅⋅⋅O), (right axes, squares) are shown for IL I (filled symbols), propanol (red open symbols) and pure cationic clusters (black open symbols), respectively. Enhanced hydrogen bonding with increasing cluster size is observed for all systems, indicated by lengthening of the OH bonds and shortening of the intermolecular bond distances.
Scheme 2.
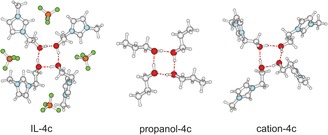
B3LYP‐6‐31G*‐D3 calculated structures of cyclic tetramers for IL I, propanol and pure cationic clusters.
A similar behavior with the cluster size can be observed for the calculated intra‐ and intermolecular bonds, all involved in hydrogen bonding. The intramolecular bond lengths, R(OH), and the intermolecular bond distances, R(H⋅⋅⋅O) and R(O⋅⋅⋅O), are shown in Figure 4 b for IL I clusters, pure cationic clusters and the propanol clusters, respectively. Enhanced hydrogen bonding with increasing cluster size is observed for all systems. From the dimers to the cyclic tetramers, the OH bonds are lengthened and the intermolecular distances are shortened as expected for hydrogen bonding.6 The effect with clusters size is nearly similar for IL I and propanol, meaning that the charge transfer from the anions to the charge center of the imidazolium cations lowers the cationic character in such a way that the hydroxyl groups can interact via hydrogen bonding like in molecular clusters. Because this charge transfer is missing in the pure cationic clusters, this effect is less pronounced. However, even in the fourfold H‐bonded cationic cluster with net charge +4, cooperative hydrogen bonding overcomes the repulsive Coulomb interaction resulting in longer intra‐ and shorter intermolecular bond lengths. Overall, H‐bonding affects structural and spectroscopic properties of like‐charged clusters in ILs, pure cationic and molecular clusters in similar way.
We also calculated the B3LYP/6‐31+G*‐D3 energies and free energies of the c–a and c–c clusters.29 For example, the tetramers c–a are slightly lower in energy than the c–c and c–c‐cyc structures by about 5.83 and 1.0 kJ mol−1 per ion pair. For the free energies, these ratios become even more favourable for the cc species (ΔG=2.96 and 0.2 kJ mol−1). Although the choice of ca and cc clusters is somewhat arbitrary, the calculated differences in energy and free energy are in the right magnitude and support the interpretation of the experimental data. Overall, the calculated energies suggest that the c‐c configurations are present in equilibrium and further kinetically stabilized at low temperatures. Here, we would like to point out that we also find minimum structures for the purely cationic clusters (e.g. cation 4c in Scheme 2). The calculated positive harmonic frequencies establish the local‐minimum character of the equilibrium species, and the short R O⋅⋅⋅H equilibrium distance, near‐linear O⋅⋅⋅HO geometry, and pronounced νOH vibrational red‐shift are recognizable signatures of H‐bonding (see Figure 4 b and the SI).
In this Communication, we provide spectroscopic evidence for the formation of H‐bonded clusters of like‐charged ions in ionic liquids. Cooperative OH⋅⋅⋅OH hydrogen bonds overcome the repulsive Coulomb forces between the cations. The most interesting cluster is a cyclic tetramer of cations, wherein cooperativity is maximized and no further H‐bonds are formed to the weakly coordinating anion. The ionic clusters show the same OH vibrational signatures as molecular clusters. The measured and calculated IR redshifts of the cationic and propanol clusters are nearly similar. This finding strongly supports the covalent character of H‐bonding and the concept of “anti‐electrostatic hydrogen bonds” (AEHB) as controversially discussed recently.30, 31, 32, 33 There is also some indication that the formation of these clusters allows to supercool the IL and prevent it from crystallization. We tried very hard, but could not get any crystal. In upcoming studies further important issues will be addressed. How does the formation of clusters of like‐charged ions depend on the anion? Can these clusters and their properties be controlled by the interaction strengths of the counter ions?
Supporting information
As a service to our authors and readers, this journal provides supporting information supplied by the authors. Such materials are peer reviewed and may be re‐organized for online delivery, but are not copy‐edited or typeset. Technical support issues arising from supporting information (other than missing files) should be addressed to the authors.
Supplementary
Acknowledgements
This work has been supported by the DFG Priority Programme SPP 1807 “Control of London dispersion interaction in molecular chemistry” and partially by the DFG Collaborative Research Center SFB 652 “Strong correlations and collective effects in radiation fields: Coulomb systems, clusters and particles“
A. Knorr, P. Stange, K. Fumino, F. Weinhold, R. Ludwig, ChemPhysChem 2016, 17, 458.
Contributor Information
Prof. Dr. Frank Weinhold, Email: weinhold@chem.wisc.edu
Prof. Dr. Ralf Ludwig, Email: ralf.ludwig@uni-rostock.de
References
- 1. Provencal R. A., Casaes R. N., Roth K., Paul J. B., Chapo C. N., Saykally R., Tschumper G., H. F. Schaefer, III , J. Phys. Chem. A 2000, 104, 1423–1429. [Google Scholar]
- 2. Liu K., Brown M. G., Cruzan J. D., Saykally R. J., J. Phys. Chem. A 1997, 101, 9011–9021. [Google Scholar]
- 3. Fellers R. S., Brady L. B., Brown M. G., Leforestier C., Saykally R. J., Science 1999, 284, 945–952. [DOI] [PubMed] [Google Scholar]
- 4. Ehbrecht M., Huisken F., J. Phys. Chem. A 1997, 101, 7768–7777. [Google Scholar]
- 5. Wassermann T. N., Zielke P., Lee J. J., Cézard C., Suhm M. A., J. Phys. Chem. A 2007, 111, 7437–7448. [DOI] [PubMed] [Google Scholar]
- 6. Ludwig R., Angew. Chem. Int. Ed. 2001, 40, 1808–1827; [PubMed] [Google Scholar]; Angew. Chem. 2001, 113, 1856–1876. [Google Scholar]
- 7. Weingärtner H., Angew. Chem. Int. Ed. 2008, 47, 654–670; [DOI] [PubMed] [Google Scholar]; Angew. Chem. 2008, 120, 664–682. [Google Scholar]
- 8. Fumino K., Wulf A., Ludwig R., Angew. Chem. Int. Ed. 2008, 47, 3830–3834; [DOI] [PubMed] [Google Scholar]; Angew. Chem. 2008, 120, 3890–3894. [Google Scholar]
- 9. Fumino K., Wulf A., Ludwig R., Angew. Chem. Int. Ed. 2008, 47, 8731–8734; [DOI] [PubMed] [Google Scholar]; Angew. Chem. 2008, 120, 8859–8862. [Google Scholar]
- 10. Wulf A., Fumino K., Ludwig R., Angew. Chem. Int. Ed. 2010, 49, 449–453; [DOI] [PubMed] [Google Scholar]; Angew. Chem. 2010, 122, 459–463. [Google Scholar]
- 11. Wulf A., Fumino K., Ludwig R., Taday P. F., ChemPhysChem 2010, 11, 349–353. [DOI] [PubMed] [Google Scholar]
- 12. Holz M., Patil K. J., Ber. Bunsen-Ges. 1991, 95, 107–113. [Google Scholar]
- 13. Shih O., England A. H., Dallinger G. C., Smith J. W., Duffey K. C., Cohen R. C., Prendergast D., Saykally R. J., J. Chem. Phys. 2013, 139, 035104. [DOI] [PubMed] [Google Scholar]
- 14. Benrraou M., Bales B. L., Zana R., J. Phys. Chem. B 2003, 107, 13432–13440, and references therein. [Google Scholar]
- 15. Larsen A. E., Grier D. G., Nature 1997, 385, 230–233. [Google Scholar]
- 16. Caplan M. R., Moore P. N., Zhang S., Kamm R. D., Lauffenburger D. A., Biomacromolecules 2000, 1, 627–631. [DOI] [PubMed] [Google Scholar]
- 17. Kuron M., Arnold A., Eur. Phys. J. E 2015, 38, 20. [DOI] [PubMed] [Google Scholar]
- 18. Strauch M., Roth C., Kubatzki F., Ludwig R., ChemPhysChem 2014, 15, 265–270. [DOI] [PubMed] [Google Scholar]
- 19. Knorr A., Fumino K., Bonsa A.-M., Ludwig R., Phys. Chem. Chem. Phys. 2015, 17, 30978–30982. [DOI] [PubMed] [Google Scholar]
- 20.Gaussian 03, Revision C.02, M. J. Frisch, G. W. Trucks, H. B. Schlegel, G. E. Scuseria, M. A. Robb, J. R. Cheeseman, J. A. Montgomery, Jr., T. Vreven, K. N. Kudin, J. C. Burant, J. M. Millam, S. S. Iyengar, J. Tomasi, V. Barone, B. Mennucci, M. Cossi, G. Scalmani, N. Rega, G. A. Petersson, H. Nakatsuji, M. Hada, M. Ehara, K. Toyota, R. Fukuda, J. Hasegawa, M. Ishida, T. Nakajima, Y. Honda, O. Kitao, H. Nakai, M. Klene, X. Li, J. E. Knox, H. P. Hratchian, J. B. Cross, V. Bakken, C. Adamo, J. Jaramillo, R. Gomperts, R. E. Stratmann, O. Yazyev, A. J. Austin, R. Cammi, C. Pomelli, J. W. Ochterski, P. Y. Ayala, K. Morokuma, G. A. Voth, P. Salvador, J. J. Dannenberg, V. G. Zakrzewski, S. Dapprich, A. D. Daniels, M. C. Strain, O. Farkas, D. K. Malick, A. D. Rabuck, K. Raghavachari, J. B. Foresman, J. V. Ortiz, Q. Cui, A. G. Baboul, S. Clifford, J. Cioslowski, B. B. Stefanov, G. Liu, A. Liashenko, P. Piskorz, I. Komaromi, R. L. Martin, D. J. Fox, T. Keith, M. A. Al-Laham, C. Y. Peng, A. Nanayakkara, M. Challacombe, P. M. W. Gill, B. Johnson, W. Chen, M. W. Wong, C. Gonzalez, and J. A. Pople, Gaussian, Inc., Wallingford CT, 2004..
- 21. Grimme S., Antony J., Ehrlich S., Krieg H., J. Chem. Phys. 2010, 132, 154104. [DOI] [PubMed] [Google Scholar]
- 22. Ehrlich S., Moellmann J., Reckien W., Bredow T., Grimme S., ChemPhysChem 2011, 12, 3414–3420. [DOI] [PubMed] [Google Scholar]
- 23. Huisken F., Kulcke A., Laush C., Lisy J., J. Chem. Phys. 1991, 95, 3924–3929. [Google Scholar]
- 24. Huelsekopf M., Ludwig R., J. Mol. Liq. 2002, 98–99, 163–171. [Google Scholar]
- 25. Ludwig R., Weinhold F., Farrar T. C., Mol. Phys. 1999, 97, 465–477. [Google Scholar]
- 26. Ludwig R., Phys. Chem. Chem. Phys. 2002, 4, 5481–5487. [Google Scholar]
- 27. Murdoch K. M., Ferris T. D., Wright J. C., Farrar T. C., J. Chem. Phys. 2002, 116, 5717. [Google Scholar]
- 28. Curtiss L. A., Frurip D. J., Blander M. J., Chem. Phys. 1979, 71, 2703. [Google Scholar]
- 29. Knorr A., Ludwig R., Sci. Rep. 2015, 5, 17505. [DOI] [PMC free article] [PubMed] [Google Scholar]
- 30. Weinhold F., Klein R. A., Angew. Chem. Int. Ed. 2014, 53, 11214–11217; [DOI] [PubMed] [Google Scholar]; Angew. Chem. 2014, 126, 11396–11399. [Google Scholar]
- 31.Addendum: Weinhold F., Klein R. A., Angew. Chem. Int. Ed. 2014, 53, 12992; [Google Scholar]; Angew. Chem. 2014, 126, 13207. [Google Scholar]
- 32. Frenking G., Caramori G. F., Angew. Chem. Int. Ed. 2015, 54, 2596–2599; [DOI] [PubMed] [Google Scholar]; Angew. Chem. 2015, 127, 2632–2635. [Google Scholar]
- 33. Weinhold F., Klein R. A., Angew. Chem. Int. Ed. 2015, 54, 2600–2602; [DOI] [PubMed] [Google Scholar]; Angew. Chem. 2015, 127, 2636–2638. [Google Scholar]
Associated Data
This section collects any data citations, data availability statements, or supplementary materials included in this article.
Supplementary Materials
As a service to our authors and readers, this journal provides supporting information supplied by the authors. Such materials are peer reviewed and may be re‐organized for online delivery, but are not copy‐edited or typeset. Technical support issues arising from supporting information (other than missing files) should be addressed to the authors.
Supplementary


