

Abstract
The mouse olfactory system employs ~1100 G‐protein‐coupled odorant receptors (ORs). Each mature olfactory sensory neuron (OSN) is thought to express just one OR gene, and the expressed OR determines the odorant response properties of the OSN. The broadest odorant response profile thus far demonstrated in native mouse OSNs is for OSNs that express the OR gene SR1 (also known as Olfr124 and MOR256‐3). Here we showed that the odorant responsiveness of native mouse OSNs expressing the OR gene MOR256‐17 (also known as Olfr15 and OR3) is even broader than that of OSNs expressing SR1. We investigated the electrophysiological properties of green fluorescent protein (GFP)+ OSNs in a MOR256‐17‐IRES‐tauGFP gene‐targeted mouse strain, in parallel with GFP+ OSNs in the SR1‐IRES‐tauGFP gene‐targeted mouse strain that we previously reported. Of 35 single chemical compounds belonging to distinct structural classes, MOR256‐17+ OSNs responded to 31 chemicals, compared with 10 for SR1+ OSNs. The 10 compounds that activated SR1+ OSNs also activated MOR256‐17+ OSNs. Interestingly, MOR256‐17+ OSNs were activated by three amines (cyclohexylamine, isopenthylamine, and phenylethylamine) that are typically viewed as ligands for chemosensory neurons in the main olfactory epithelium that express trace amine‐associated receptor genes, a family of 15 genes encoding G‐protein‐coupled receptors unrelated in sequence to ORs. We did not observe differences in membrane properties, indicating that the differences in odorant response profiles between the two OSN populations were due to the expressed OR. MOR256‐17+ OSNs appear to be at one extreme of odorant responsiveness among populations of OSNs expressing distinct OR genes in the mouse.
Keywords: chemoreception, electrophysiology, main olfactory epithelium, olfaction
Introduction
The immense variety of distinct molecular structures that can be detected and discriminated by the mouse olfactory system is based on a very large number of odorant receptors (ORs) (Buck & Axel, 1991). A typical OR is capable of interacting with a relatively small number of odorous ligands (odorants). Olfactory perception initiates with the binding of odorants to ORs expressed on the surface of olfactory sensory neuron (OSN) cilia. This odorant–OR interaction activates a cAMP‐dependent signal transduction cascade leading to the generation of action potentials in the OSN. Each mature OSN is thought to express just one intact OR gene. The expressed OR determines both the odorant response profile of the OSN and the olfactory bulb glomerulus in which the axon of the OSN terminates and synapses with second‐order neurons in the olfactory pathway. A given OR and the population of OSNs that express this OR reside on a wide spectrum of odorant response profiles, from narrowly tuned or narrowly responsive to broadly tuned or broadly responsive.
The OSNs that express the mouse OR gene SR1 (also known as Olfr124 and MOR256‐3) have thus far demonstrated the broadest odorant responsiveness in a homologous ex vivo system, i.e. in native OSNs that express an unmodified OR protein from the endogenous locus in the genome (Grosmaitre et al., 2009). The broad response properties of another OR from the MOR256 family, MOR256‐17 (also known as Olfr15 and OR3), have been investigated only in heterologous systems for OR expression: human embryonic kidney (HEK)293T cells (Saito et al., 2009; Dahoun et al., 2011), micelle and nanodisc biomimetic chemical sensors (Goldsmith et al., 2011), and Xenopus laevis oocytes (Li et al., 2012). A third member of the MOR256 family, MOR256‐31 (previously known as Olfr42 and now renamed Olfr263), also conveys a broad odorant response profile when expressed in heterologous HEK293T cells, after having been recovered by reverse transcription–polymerase chain reaction from a single native OSN that responded broadly to odorants (Nara et al., 2011; Yu et al., 2015).
Here, we report the generation of a MOR256‐17‐IRES‐tauGFP gene‐targeted mouse strain. We performed electrophysiological patch‐clamp recordings ex vivo in native green fluorescent protein (GFP)+ OSNs from homozygous MOR256‐17‐IRES‐tauGFP mice, in parallel with native GFP+ OSNs from homozygous SR1‐IRES‐tauGFP mice (Grosmaitre et al., 2009). The membrane properties of these two populations of OSNs do not differ as assessed by spontaneous and current‐induced activity. Of a panel of 35 chemical ligands belonging to distinct structural classes, 10 activate both SR1+ OSNs and MOR256‐17+ OSNs, and another 21 activate only MOR256‐17+ OSNs. We thus did not identify ligands that activated SR1+ OSNs but not MOR256‐17+ OSNs. Moreover, MOR256‐17+ OSNs but not SR1+ OSNs are activated by three amines (cyclohexylamine, isopenthylamine, and phenylethylamine) that are classical ligands for trace amine‐associated receptors (TAARs) and TAAR‐expressing OSNs. Overall, our results for MOR256‐17+ OSNs fit best with those reported for the heterologous Xenopus laevis oocyte system (Li et al., 2012). The evolutionary emergence and biological relevance of broadly responsive ORs within a repertoire of mostly narrowly responsive ORs remain elusive.
Materials and methods
Gene targeting
In the MOR256‐17‐IRES‐tauGFP targeting vector, the IRES‐tauGFP‐ACNF cassette is inserted by recombinant polymerase chain reaction at three nucleotides after the stop codon of the MOR256‐17 coding region. The linearized targeting vector was electroporated into the embryonic stem cell line E14, and G418‐resistant clones harbouring the desired homologous recombination event were identified by genomic Southern blot hybridization (Mombaerts et al., 1996). Cells from targeted embryonic stem cell clone H5 were injected into C57BL/6J blastocysts, and germline transmission of the targeted allele was achieved by crossing male chimeras with C57BL/6J females. The strain was maintained in a mixed 129P2/OlaHsd × C57BL/6J background, and is publicly available from The Jackson Laboratory as B6;129P2‐Olfr15 <tm2Mom>/MomJ (stock number 7762).
Mouse breeding and experiments
Mouse experiments were carried out in accordance with the guidelines of the National Institutes of Health regarding the care and use of animals for experimental procedures, and in accordance with the German Animal Welfare Act, European Communities Council Directive 2010/63/EU, and the institutional ethical and animal welfare guidelines of The Rockefeller University, the Max Planck Institute of Biophysics, the Max Planck Research Unit for Neurogenetics, and the Université de Bourgogne. Approvals came from the Institutional Animal Care and Use Committee of The Rockefeller University, the Regierungspräsidium Darmstadt, and the Veterinäramt of the City of Frankfurt. In Dijon, mice were housed in cages with Lignocel select fine bedding (SORAC, Spain), and given A03 feed (SAFE, Augy, France) and water ad libitum. The average age (± SD) of MOR256‐17‐IRES‐tauGFP mice was 28.2 ± 6.7 days (n = 53), and that of SR1‐IRES‐tauGFP mice was 26.9 ± 4.2 days (n = 37).
Immunohistochemistry
Mice were deeply anaesthetized by intraperitoneal injection of sodium pentobarbital (60 mg/kg), and intracardially perfused with cold phosphate‐buffered saline followed by 4% paraformaldehyde. Mouse heads were postfixed for 2 h at 4 °C with agitation, followed by decalcification with 0.5 m EDTA overnight and by serial incubation with 10, 15 and 30% sucrose, each overnight. Mouse heads were then frozen in O.C.T. compound (Tissue‐Tek, Torrance, CA, USA) and sectioned at 12 μm on a cryostat (CM3050 S; Leica). Sections were collected on Superfrost slides and blocked in 10% normal donkey serum in phosphate‐buffered saline for 1 h at room temperature followed by incubation with the following primary antibodies: MOR256‐17 [1 : 800; Strotmann et al. (2004), a gift from Prof. Dr Jörg Strotmann], GFP (1 : 500, chicken polyclonal; Abcam, Cambridge, MA, USA) and olfactory marker protein (OMP) (1 : 5000, goat antiserum; Wako Chemicals USA, Richmond, VA, USA), all in 2% normal donkey serum overnight at 4 °C. Sections were washed in 0.1% Triton in phosphate‐buffered saline and incubated with the following secondary antibodies: fluorescein‐conjugated donkey anti‐chicken (1 : 800; Jackson ImmunoResearch Laboratories, West Grove, PA, USA), Rhodamine Red‐X‐conjugated donkey anti‐rabbit (1 : 800; Jackson ImmunoResearch Laboratories) and Cy5‐conjugated donkey anti‐goat (1 : 1000; Jackson ImmunoResearch Laboratories). Immunostained sections were examined and imaged with a confocal microscope (LSM 510; Zeiss, Jena, Germany).
Patch‐clamp recordings
Intact epithelial preparations were made as described previously (Ma et al., 1999; Grosmaitre et al., 2006, 2009; Jarriault & Grosmaitre, 2015). Mice were deeply anaesthetized by intraperitoneal injection of ketamine/xylazine (150 and 10 mg/kg, respectively), and then decapitated. The head was immediately immersed in ice‐cold Ringer's solution containing (in mm): 124 NaCl, 3 KCl, 1.3 MgSO4, 2 CaCl2, 26 NaHCO3, 1.25 NaH2PO4 and 15 glucose, at pH 7.5 and 305 mOsm, oxygenated with 95% O2 and 5% CO2. The nose was dissected out en bloc. The olfactory mucosa attached to the nasal septum was removed and kept in oxygenated Ringer's solution. Before use, the mucosa was gently peeled away from the underlying bone and transferred to a recording chamber with the mucus layer facing up. Oxygenated Ringer's solution was continuously perfused at room temperature.
The dendritic knobs of OSNs were visualized through an upright microscope (BX51WI; Olympus) equipped with a camera (DP72; Olympus) and a 40× water‐immersion objective, numerical aperture 0.8. An accessory lens in the light path achieved an extra 4× magnification. The green‐fluorescent cells were visualized under fluorescence illumination. Superimposition of the fluorescent and bright‐field images allowed identification of the GFP+ cells under bright field.
Electrophysiological recordings were controlled by an EPC‐10 amplifier combined with patchmaster software (HEKA Electronik, Lambrecht, Germany). Perforated patch clamping was performed on the dendritic knobs by including 260 μm nystatin in the borosilicate‐recording pipettes (Sutter Instrument, Novaco, CA, USA), which were filled with a solution containing (in mm): 70 KCl, 53 KOH, 30 methanesulphonic acid, 5.0 EGTA, 10 HEPES and 70 sucrose, at pH 7.2 (KOH) and 310 mOsm. The resistance of the pipette was ~20 MΩ. The junction potential was ~9 mV and was corrected in all experiments off‐line. For odorant‐induced transduction currents, signals were sampled at 20 kHz. Under voltage‐clamp mode at −70 mV, the signals were initially filtered at 10 kHz and then at 2.9 kHz.
Odorant stimulation
A seven‐barrel pipette was used to deliver stimuli by pressure ejection through a picospritzer Pressure System IIe (Toohey, Fairfield, NJ, USA). The stimulus electrode was placed at ~20 μm downstream from the recording site. Distance and pressure were adjusted to minimize mechanical responses. Stimuli were delivered at ~20 psi as indicated on the picospritzer with 500 ms pulse length. Chemicals were purchased from Sigma‐Aldrich (Saint‐Quentin‐Fallavier, France) except for Lyral, which was provided as a generous gift from International Flavors & Fragrances (Dijon, France). Odorant stimuli were prepared in 0.5 m solution in dimethylsulphoxide and kept at −20 °C. Odorant mixture Mix 1 (Grosmaitre et al., 2009) contains 19 compounds (each at 10 μm final): heptanol, octanol, hexanal, heptanal, octanal, heptanoic acid, octanoic acid, cineole, amyl acetate, (+) limonene, (−) limonene, (+) carvone, (−) carvone, 2‐heptanone, anisaldehyde, benzaldehyde, acetophenone, 3‐heptanone, and ethyl vanilline. Mix 1 was prepared as a 0.1 m solution in dimethylsulphoxide, and kept at −20 °C. Final solutions of odorants were prepared before each experiment by adding Ringer's solution.
Data analysis
Unpaired t‐tests were performed with prism software (GraphPad) to indicate statistical differences between the two populations of OSNs. Dose–response curves were fitted with Origin 9.1 using the Hill equation [I = I max/(1 + (K 1/2/C)n)] where I represents the peak of odour‐induced response, I max the maximum response at saturating concentrations, K 1/2 the concentration when half of the maximum response was reached (EC50), C the concentration of odorant, and n the Hill coefficient. Electrophysiology data analysis was performed using patchmaster and igor pro software. Averaged data are shown as mean ± SEM.
Results
The MOR256‐17‐IRES‐tauGFP gene‐targeted mouse strain
The mouse OR gene MOR256‐17 is also referred to as OR3 (Nef et al., 1992) and Olfr15. We generated a mouse strain with a MOR256‐17‐IRES‐tauGFP mutation by gene targeting in embryonic stem cells, using the same design as Luxenhofer et al. (2008). Our mouse strain MOR256‐17‐IRES‐tauGFP is publicly available from The Jackson Laboratory. In mice that are heterozygous or homozygous for MOR256‐17‐IRES‐tauGFP, OSNs that express this OR gene coexpress tauGFP with MOR256‐17 by virtue of a bicistronic strategy that is afforded by the internal ribosome entry site (IRES). TauGFP expression can be visualized by using the intrinsic fluorescence of GFP or with anti‐GFP antibodies.
In a coronal cryosection of the nasal cavity of a 35‐day‐old mouse heterozygous for MOR256‐17‐IRES‐tauGFP, green‐fluorescent cells were observed scattered across a broad zone in the middle of the main olfactory epithelium (Fig. 1A). In a whole mount of a 45‐day‐old mouse homozygous for MOR256‐17‐IRES‐tauGFP, green‐fluorescent axons coalesced into a complex and large glomerulus within a ventral domain of the lateral face of the olfactory bulb (Fig. 1B). An antibody against MOR256‐17 (Schwarzenbacher et al., 2004, 2005, 2006; Strotmann et al., 2004; Fuss et al., 2007) colabels GFP‐immunoreactive cells in heterozygous mice (Fig. 1C–E). Approximately half of the MOR256‐17‐immunoreactive cells were GFP immunoreactive in heterozygous mice, consistent with the well‐established principle of monoallelic expression of OR genes.
Figure 1.
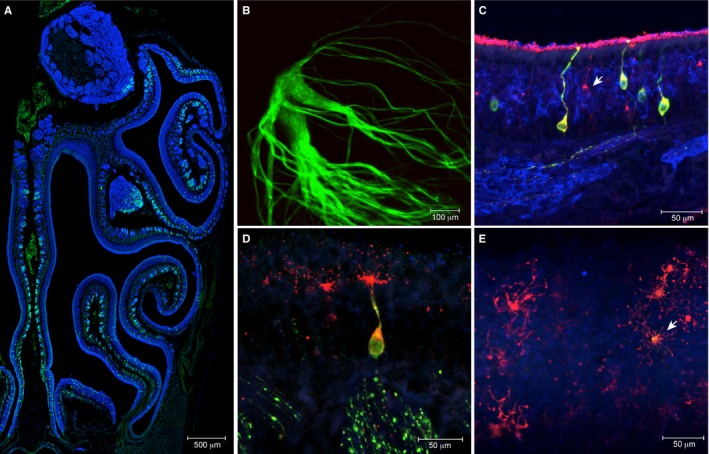
The olfactory system of the MOR256‐17‐IRES‐tauGFP gene‐targeted mouse strain. (A) Coronal section of the nasal cavity of a heterozygous postnatal day (PD)35 mouse immunostained for olfactory marker protein (OMP) (blue), and with intrinsic GFP fluorescence (green). (B) Confocal z‐stack image of intrinsic GFP fluorescence of the lateral glomerulus in a whole mount of an olfactory bulb of a homozygous PD45 mouse. (C) Coronal section of the olfactory mucosa of a heterozygous PD35 mouse, immunostained for MOR256‐17 (red), GFP (green), and OMP (blue). The arrow shows MOR256‐17 immunoreactivity in a GFP‐negative OSN, consistent with monoallelic expression from the wild‐type MOR256‐17 allele in this cell. (D) MOR256‐17 immunostaining (red) also reveals OSN cilia in a heterozygous PD35 mouse. (E) Confocal en‐face image of OSN cilia and dendritic knobs, with colocalization of MOR256‐17 and GFP immunoreactivity (arrow) in a heterozygous PD35 mouse.
The intrinsic fluorescence of tauGFP expressed from an OR locus was sufficiently high to visualize these OSNs including their dendritic knobs and cilia in intact epithelial preparations, thus allowing single‐cell electrophysiological recordings according to a well‐established method (Ma et al., 1999; Grosmaitre et al., 2006, 2009; Lam & Mombaerts, 2013; Omura et al., 2014).
Similar spontaneous and current‐induced activity of MOR256‐17+ and SR1+ olfactory sensory neurons
We set out to compare the odorant response properties of single MOR256‐17+ OSNs in parallel with and in comparison to SR1+ OSNs, which we visualized in mice of the SR1‐IRES‐tauGFP strain that we previously reported (Grosmaitre et al., 2009).
Figure 2 shows a comparison of the spontaneous (i.e. not odorant‐evoked) activity of OSNs expressing SR1 (n = 9 cells) or MOR256‐17 (n = 9 cells). The resting potential was −69.97 ± 0.76 mV (± SEM) for SR1+ OSNs and −70.36 ± 0.79 mV for MOR256‐17+ OSNs. The total recording time for each cell was between 20 and 30 s. Examples of recordings are given in Fig. 2A. We measured the mean firing frequency for each cell during this time period and the instantaneous firing frequency, which concerns a time segment during which bursts of action potentials occur. There was no significant difference in the mean frequencies (3.12 ± 0.89 Hz for SR1 vs. 3.24 ± 1 Hz for MOR256‐17) (Fig. 2B), instantaneous frequencies (13.03 ± 4.34 Hz for SR1 vs. 10.17 ± 2.17 Hz for MOR256‐17) (Fig. 2C), or inter‐spike interval (1573.08 ± 917.25 ms for SR1 vs. 708.65 ± 318.23 ms for MOR256‐17) (Fig. 2D). Finally, there was no significant difference in the number of action potentials during these time periods (65.22 ± 16.95 for SR1 vs. 67.11 ± 19.96 for MOR256‐17) (Fig. 2E). Within one OSN population, the spontaneous activity varied considerably from cell to cell, as has been observed for OSNs expressing SR1 or other ORs (Connelly et al., 2013).
Figure 2.
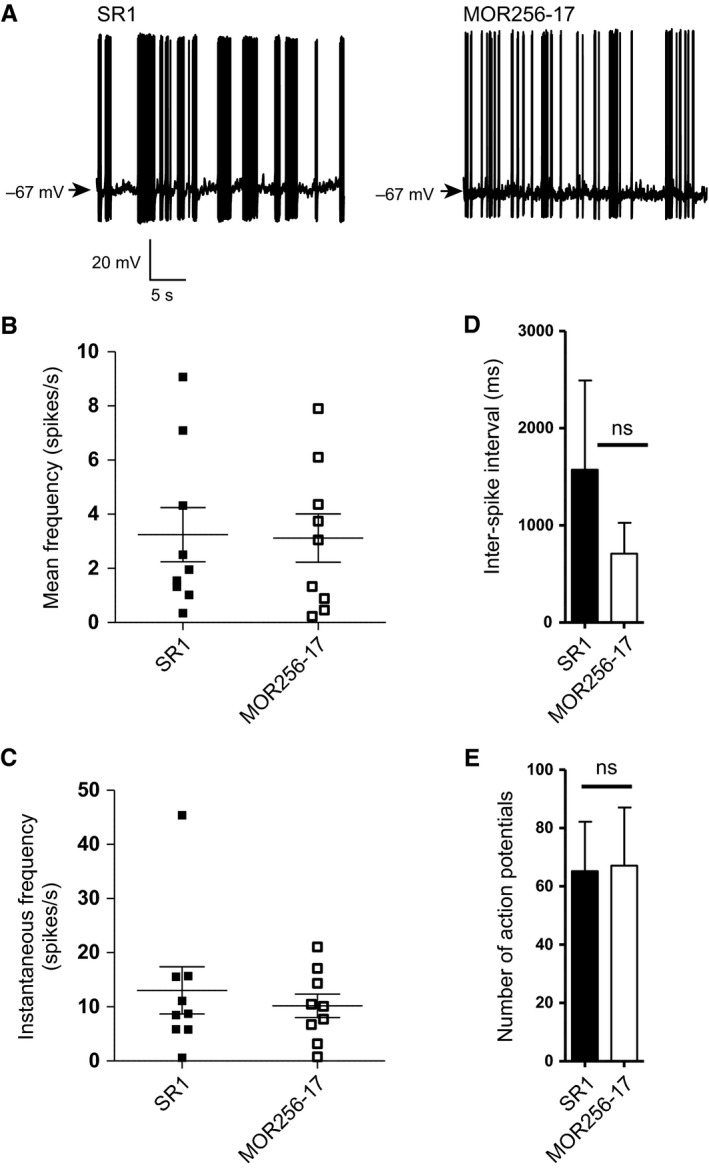
Spontaneous activity of SR1+ OSNs and MOR256‐17+ OSNs. (A) Examples of recordings of spontaneous activity. (B) Mean firing frequency. Data are shown for nine individual OSNs of each population. (C) Instantaneous firing frequency. Data are shown for nine individual OSNs of each population. (D) Inter‐spike interval. (E) Number of action potentials. Data are presented as mean ± SEM.
We next analysed the firing patterns by eliciting action potentials via injection of a depolarizing current of 7 pA into OSNs expressing SR1 (n = 6 cells) or MOR256‐17 (n = 6 cells) (Fig. 3A). There was no significant difference in the number of action potentials (31 ± 4.9 for SR1 vs. 32.5 ± 5.95 for MOR256‐17) (Fig. 3B), inter‐spike interval (69.48 ± 12.3 ms for SR1 vs. 83.3 ± 34.87 ms for MOR256‐17) (Fig. 3C), latency (18.84 ± 3.89 ms for SR1 vs. 14 ± 2.36 ms for MOR256‐17) (Fig. 3D), or instantaneous firing frequency (19.55 ± 3 Hz for SR1 vs. 23.16 ± 4 Hz for MOR256‐17) (Fig. 3E). Taken together, the spontaneous and current‐induced activity was similar in SR1+ and MOR256‐17+ OSNs.
Figure 3.
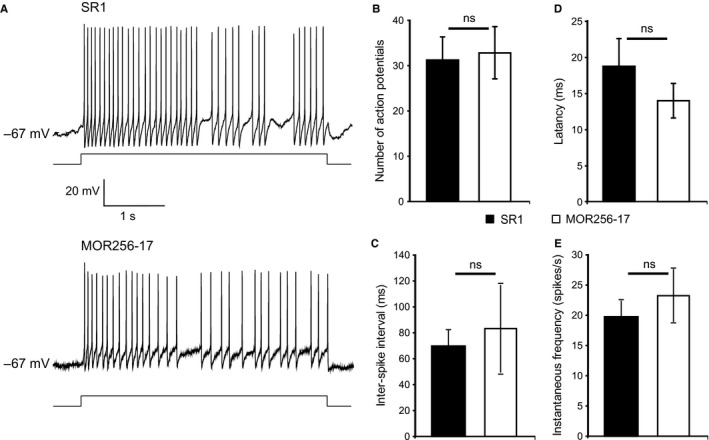
The firing pattern of SR1+ OSNs and MOR256‐17+ OSNs under current‐clamp mode. (A) Traces representing action potentials elicited by injecting a current of 7 pA to the cells. (B) Number of action potentials. Data are shown for six OSNs of each population. (C) Inter‐spike interval. (D) Latency is defined as the time that the cell takes to fire the first action potential after the current is injected. (E) Instantaneous firing frequency. Data are presented as mean ± SEM.
Extremely broad odorant responsiveness of MOR256‐17+ olfactory sensory neurons
Next we characterized odorant responses of MOR256‐17+ OSNs in comparison to SR1+ OSNs. We used a mixture of 19 chemicals (Mix 1) each at 10 μm (Grosmaitre et al., 2009) and 35 single chemical compounds at 10 μm, belonging to more than nine chemical groups including alcohols, aldehydes, amines, carboxylic acids, esters, ketones, terpenes, and thiols (Fig. 4A). We chose closely related chemicals within each functional group family in order to examine the ability of these neurons to respond to similar odorants (same functional group but different carbon chain length), or odorants with different functional groups. We tested at least five cells for each odorant and Mix 1. There were no instances in which a cell deviated from the other cells within an OSN population, in that it was not responsive to an odorant, whereas other cells were responsive. In other words, the response rate to a given odorant was either 0% or 100% within a given OSN population. Representative current traces under voltage‐clamp conditions are shown in Fig. 4B.
Figure 4.
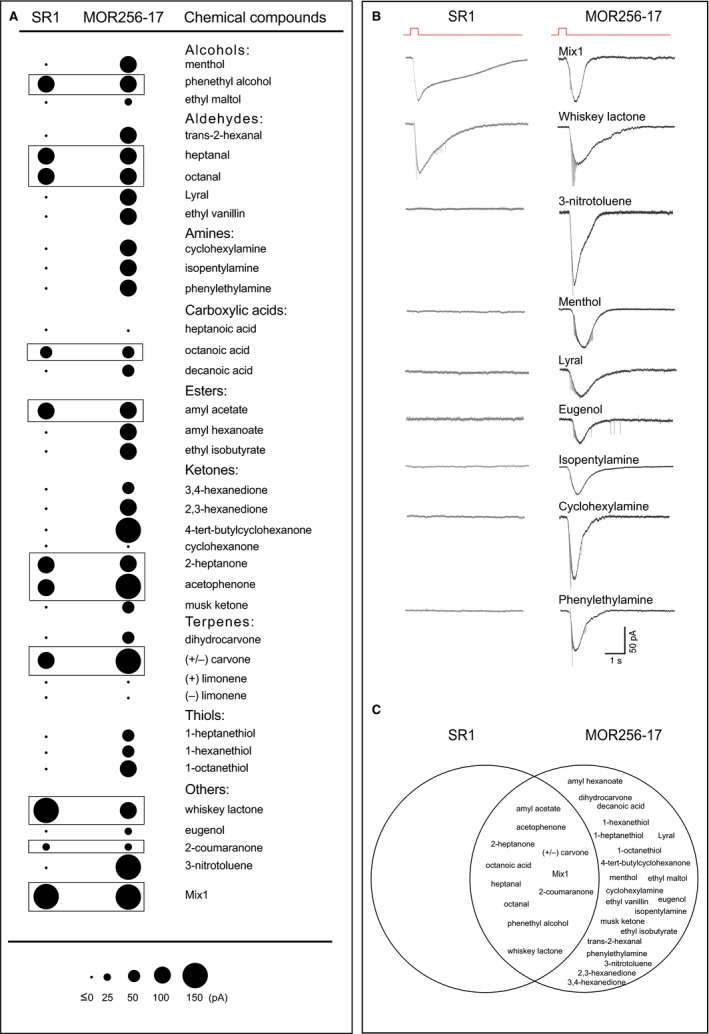
SR1+ OSNs and MOR256‐17+ OSNs respond to a variety of chemical compounds. (A) Voltage‐clamp recordings in SR1+ and MOR256‐17+ OSNs to 35 chemical compounds at 10 μm and Mix 1, which consists of 19 odorants each at 10 μm. Each dot represents the average response of at least five OSNs. (B) Traces of inward odorant current for Mix 1 and chemical compounds in SR1+ OSNs and MOR256‐17+ OSNs. Flat traces indicate no response. (C) All odorants that stimulate SR1+ OSNs also stimulate MOR256‐17+ OSNs but not vice versa.
We found that MOR256‐17+ OSNs responded to Mix 1 and 31 out of 35 single chemical compounds, whereas SR1+ OSNs responded to Mix 1 and 10 single chemical compounds. At 10 μm, MOR256‐17 cells responded most strongly to acetophenone (145.26 ± 37.34 pA, n = 9 cells), 4‐tert‐butylcyclohexanone (119.82 ± 32.35 pA, n = 16 cells), (+/−) carvone (111.5 ± 14.44 pA, n = 8 cells), and 3‐nitrotoluene (105.13 ± 16.29 pA, n = 15 cells) (Fig. 4A and B). Interestingly, MOR256‐17+ cells also responded to the three amines that we tested: cyclohexylamine (79.51 ± 33.45 pA, n = 7 cells), isopenthylamine (66.62 ± 28.84 pA, n = 5 cells) and phenylethylamine (87.54 ± 40.58 pA, n = 7 cells). These amines are classical ligands for TAARs, G‐protein‐coupled receptors that are unrelated in amino acid sequence to ORs and are also expressed in chemosensory neurons of the main olfactory epithelium (Liberles & Buck, 2006; Pacifico et al., 2012; Dewan et al., 2013; Zhang et al., 2013). We have previously reported responses to five odorants for SR1+ OSNs: camphor, amyl acetate, benzaldehyde, octanoic acid, and heptanal (Grosmaitre et al., 2009). We here report six more odorants activating SR1+ OSNs: (+/−) carvone (95.75 ± 23.11 pA, n = 10 cells), 2‐heptanone (95.64 ± 22.52 pA, n = 13 cells), acetophenone (57.94 ± 30.17 pA, n = 5 cells), 2‐coumaranone (44.51 ± 9.41 pA, n = 7 cells), phenylethyl alcohol (69.75 ± 17.10 pA, n = 6 cells) and whiskey lactone (133.07 ± 17.94 pA, n = 9 cells). A main conclusion is that MOR256‐17+ OSNs are even more broadly responsive than SR1+ OSNs, as evaluated from the set of 35 chemical compounds and Mix 1. SR1+ OSNs did not respond to the three amines: cyclohexylamine (n = 9 cells), isopentylamine (n = 9 cells), and phenethylamine (n = 11 cells) (Fig. 4A and B) and neither did SR1+ OSNs respond to the three thiols: 1‐heptanethiol (n = 6 cells), 1‐hexanethiol (n = 8 cells), and 1‐octanethiol (n = 5 cells) (Fig. 4A).
Figure 4C provides on overview of odorant responses as Venn diagrams: the odorant response profile of SR1+ OSNs is fully included within that of MOR256‐17+ OSNs, and these two OSN populations have 10 ligands and Mix 1 in common.
Differences in odorant response properties between SR1+ olfactory sensory neurons and MOR256‐17+ olfactory sensory neurons
To compare the responses to the 10 ligands and Mix 1 that are shared between SR1+ OSNs and MOR256‐17+ OSNs, we analysed five parameters of the odorant‐induced currents: latency, rise time, peak current, half‐width, and total charge area (Fig. 5A).
Figure 5.
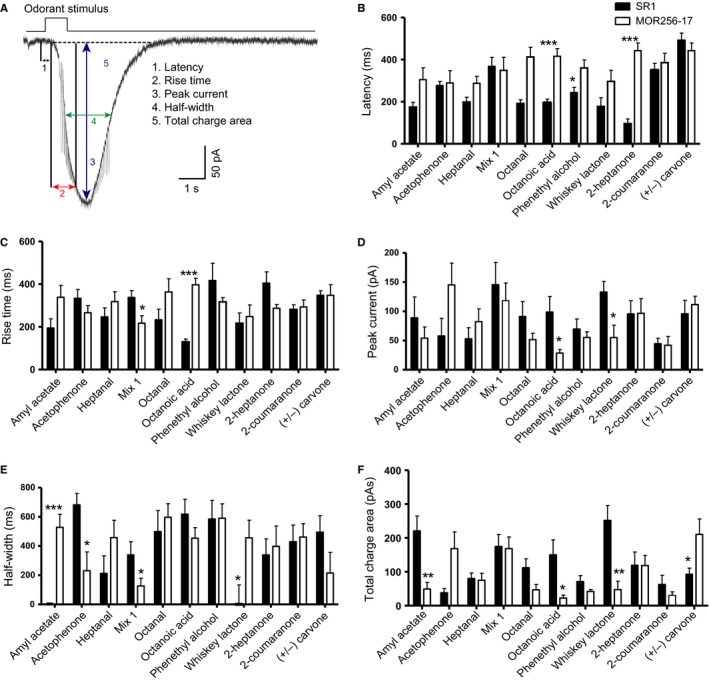
Odorant‐induced currents for the common ligands of SR1+ OSNs and MOR256‐17+ OSNs. (A) Analysis of five parameters of odorant‐induced current under voltage‐clamp mode. Latency is the time between the onset of the stimulus and the starting point of the response; the rise time is the time that it takes the current to reach 90% of the peak from the starting point of the response; the half‐width of the current is the time between the rising and falling phase at 50% of the peak; and the total charge area is the area of the entire response. (B–F) Analysis of voltage‐clamp kinetics for common ligands of SR1+ OSNs and MOR256‐17+ OSNs. Data are presented as mean + SEM. Significances: (B) octanoic acid ***P < 0.0001, phenethyl alcohol *P < 0.04, 2‐heptanone ***P < 0.0001; (C) Mix1 *P < 0.01, octanoic acid ***P < 0.0001; (D) octanoic acid *P < 0.03, whiskey lactone *P < 0.01; (E) amyl acetate ***P < 0.0003, acetophenone *P < 0.03, Mix1 *P < 0.04, whiskey lactone *P < 0.03; (F) amyl acetate **P < 0.002, octanoic acid *P < 0.02, whiskey lactone **P < 0.005, (+/−) carvone *P < 0.01.
As populations, SR1+ OSNs and MOR256‐17+ OSNs differed in certain parameters for various chemicals. However, a consistent pattern was seen only with octanoic acid, i.e. SR1+ OSNs responded with a shorter latency (Fig. 5B), a shorter rise time (Fig. 5C), and a higher peak current (Fig. 5D), and overall had a higher total charge area (Fig. 5F). The half‐width (Fig. 5E) was the only parameter in which SR1+ OSNs and MOR256‐17+ OSNs did not differ in their responses to octanoic acid. Thus, the response to octanoic acid was faster and stronger in SR1+ OSNs than in MOR256‐17+ OSNs. However, we did not find one population to systematically have a faster and stronger response than the other.
Dose–response curves
We measured dose–response curves of SR1+ OSNs and MOR256‐17+ OSNs for (+/−) carvone and 2‐heptanone (Fig. 6A–D). We also measured dose–response curves of MOR256‐17+ OSNs for 3‐nitrotoluene and 4‐tert‐butylcyclohexanone (Fig. 6E and F). Several dose–response curves of MOR256‐17+ OSNs did not show a sigmoidal shape, presumably because the highest concentration tested was not saturating. We compared three parameters of the kinetics of the dose–response curves: K 1/2 (EC50), maximum amplitude V max, and Hill coefficient. We did not observe a significant difference between the two cell populations, but the relatively low number of OSNs examined may have obscured significant differences. Figure 6G shows the EC50 values and Fig. 6H shows the V max values as scatter plots.
Figure 6.
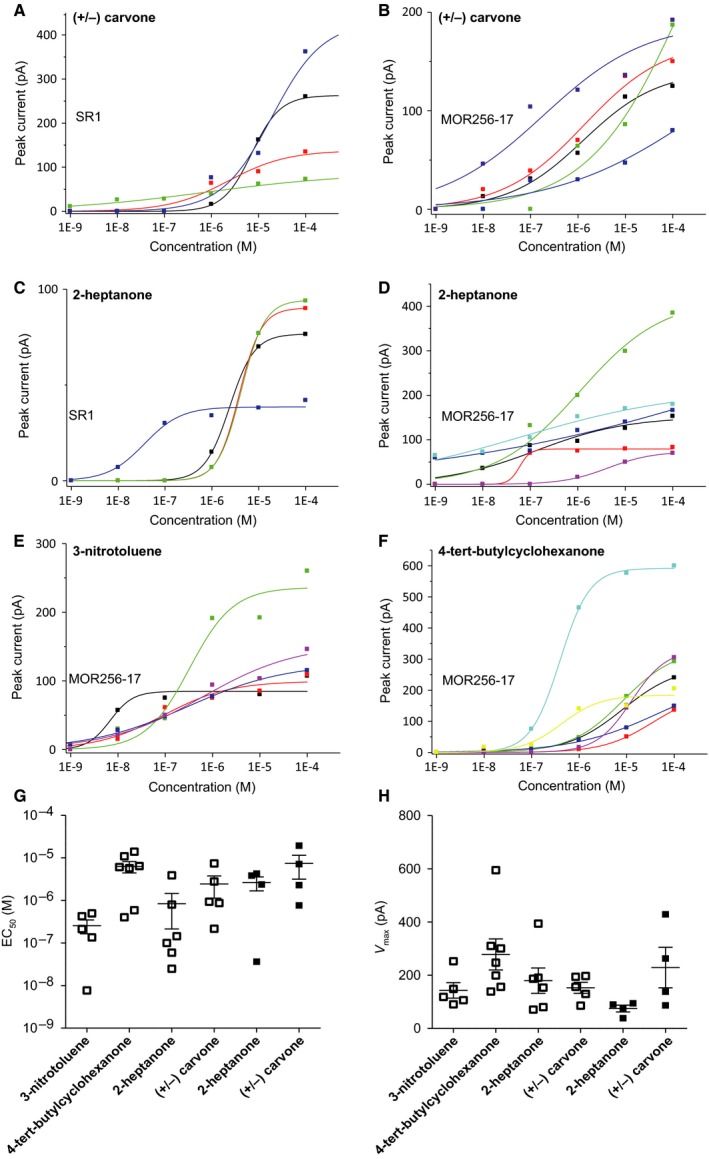
Dose–response curves of the peak current for selected odorants. Different colours in A–F correspond to individual cells. Note that the scale of the Y‐axis representing the elicited amplitude varies from graph to graph. (A) Responses of SR1+ OSNs to (+/−) carvone. (B) Responses of MOR256‐17+ OSNs to (+/−) carvone. (C) Responses of SR1+ OSNs to 2‐heptanone. (D) Responses of MOR256‐17+ OSNs to 2‐heptanone. (E) Responses of MOR256‐17+ OSNs to 3‐nitrotoluene. (F) Responses of MOR256‐17+ OSNs responding to 4‐tert‐butylcyclohexanone. (G) EC 50 values (in log10) of dose–response curves to odorants for MOR256‐17+ OSNs (open symbols) and SR1+ OSNs (filled symbols). (H) V max values of dose–response curves to odorants for MOR256‐17+ OSNs (open symbols) and SR1+ OSNs (filled symbols). Data are presented as mean ± SEM.
Discussion
We here report a detailed and comparative electrophysiological characterization of 130 OSNs expressing MOR256‐17 and 88 OSNs expressing SR1 in two strains of gene‐targeted mice. In these mice, the tens of thousands of OSNs that express MOR256‐17 or SR1 (Bressel et al., 2016) coexpress tauGFP, allowing their easy identification in an intact epithelial preparation ex vivo. We thus investigated the activity of native OSNs expressing defined ORs from their endogenous locus in an environment that is relatively close to the in vivo situation. This well‐established method (Jarriault & Grosmaitre, 2015) has allowed us previously to characterize responses of OSNs expressing an OR with a narrow response profile such as MOR23 (Grosmaitre et al., 2006) or S1 (Lam & Mombaerts, 2013), an OR with a broad response profile such as SR1 (Grosmaitre et al., 2009), and the β2‐adrenergic receptor expressed in OSNs from an OR locus (Omura et al., 2014). This preparation has been informative in a variety of experimental contexts such as ageing (Lee et al., 2009), the effect of variations in OR sequence to odorant responses (Zhang et al., 2012), prenatal development (Lam & Mombaerts, 2013), spontaneous activity (Connelly et al., 2013), odorant‐induced plasticity (Cadiou et al., 2014), and the correlation of OSN ciliary length with sensitivity in the septum and dorsal recess (Challis et al., 2015).
Extremely broad odorant responsiveness of MOR256‐17+ olfactory sensory neurons
The MOR256‐17+ OSNs respond to 31 out of 35 single chemical compounds tested. The odorant responsiveness of MOR256‐17+ OSNs is much broader than that of SR1+ neurons; all 10 ligands for SR1+ OSNs are included in the ligand space of MOR256‐17+ OSNs. It remains possible that, when a much broader set of ligands is used, a different picture would emerge, but this patch‐clamping method has low throughput. Interestingly, among the ligands for MOR256‐17+ OSNs are cyclohexylamine, isopenthylamine and phenylethylamine. These amines are classical ligands for TAARs and TAAR‐expressing OSNs (Liberles & Buck, 2006; Pacifico et al., 2012; Dewan et al., 2013; Zhang et al., 2013). However, the concentration eliciting a response in MOR256‐17+ OSNs is fairly high (10 μm) compared with the extremely high sensitivity of TAAR‐expressing chemosensory neurons in the main olfactory epithelium (Zhang et al., 2013). Amine detection by canonical OSNs expressing an OR such as MOR256‐17 may modify the behavioural response to amines at higher concentrations or in mixtures.
Although MOR256‐17+ OSNs show extremely broad responsiveness, there is some subtle selectivity; in each functional group, MOR256‐17 OSNs show tail length tuning for homologous n‐compounds. These cells respond to some carbon chain lengths but not others. For example, responses are observed more frequently and with higher amplitude for 8C chains (octanoic acid and 1‐octanethiol) compared with 7C chains (no response to heptanoic acid and weaker responses to 1‐heptanethiol). We characterized the response kinetics for all 10 common ligands for SR1 and MOR256‐17, and observed a systematic difference only in octanoic acid. The dose–response curves of MOR256‐17+ OSNs exhibit a broad dynamic range and high sensitivity, and are similar to those of SR1+ OSNs.
Taken together, the differences between MOR256‐17+ OSNs and SR1+ OSNs are probably due to the expressed OR rather to than membrane properties, as we did not observe differences in their spontaneous and current‐induced activity.
Discrepancies with heterologous systems
Our results differ from data obtained by expressing MOR256‐17 in heterologous systems (Saito et al., 2009; Dahoun et al., 2011; Goldsmith et al., 2011; Li et al., 2012). Most importantly, we do not observe responses to cyclohexanone. Cyclohexanone was reported as a stimulus for HEK293T cells that were transfected with an expression plasmid of MOR256‐17 fused to an N‐terminal 20 amino acid human rhodopsin tag (Saito et al., 2009), and for micelle and nanodisc nanotubes in which recombinant MOR256‐17 protein produced in Sf9 insect cells was inserted (Goldsmith et al., 2011). However, cyclohexanone was not reported as a stimulus in another study (Dahoun et al., 2011) that used the same heterologous HEK293T cells, but employed a readout of secreted alkaline phosphatase instead of luciferase and a 16 h exposure to cyclohexanone instead of a 4 h exposure (Saito et al., 2009). Conversely, we observe responses to 2‐heptanone, ethyl isobutyrate, (+/−) carvone, dihydrocarvone, heptanal, octanal, and acetophenone, chemicals that were reported as non‐activating odorants by Saito et al. (2009). Our data for MOR256‐17+ OSNs are most similar to those obtained by heterologous expression in Xenopus oocytes (Li et al., 2012), with the difference that we see responses to ethyl vanillin and eugenol, which are reported as non‐activating odorants in this system. For SR1+ OSNs, we do not observe responses to heptanoic acid and 1‐octanethiol but we observe responses to 2‐heptanone and acetophenone, whereas the opposite results have been reported for HEK293T cells transfected with an SR1 expression plasmid (Yu et al., 2015).
False‐negative responses (discrepancies in which a heterologous system fails to detect a response that is observed in native OSNs) can be attributed to lower sensitivity of the heterologous system. However, for the false‐positive response to cyclohexanone for MOR256‐17 and to heptanoic acid and 1‐octanethiol for SR1 [discrepancies in which a heterologous system (Saito et al., 2009; Goldsmith et al., 2011; Yu et al., 2015) detects a response that cannot be reproduced in native OSNs that express the unmodified OR from the endogenous locus] there is no obvious explanation. The only available in vivo data for MOR256‐17 are with 2,3‐hexanedione, in a strain of MOR256‐17‐IRES‐tauGFP mice that has been generated independently (Luxenhofer et al., 2008); in mice exposed to 2,3‐hexanedione, there is an increase in the percentage of c‐fos+ juxtaglomerular cells surrounding the GFP+ glomeruli (Loch et al., 2013).
Why does the mouse olfactory system employ broadly responsive odorant receptors?
MOR256‐17 and SR1 belong to the same OR family, the MOR256 family. With 37 members, the MOR256 family is one of the largest families in the mouse OR gene repertoire (Zhang & Firestein, 2002). A third broadly responsive OR, Olfr42 (Nara et al., 2011; Yu et al., 2015), now renamed Olfr263, was previously known as MOR256‐31, and thus also belongs to the MOR256 family. It will be informative to compare the odorant responsiveness of native OSNs expressing Olfr263, such as by generating an Olfr263‐IRES‐tauGFP gene‐targeted strain.
Other members of the MOR256 family exhibit a narrower odorant response profile, at least when assessed in the heterologous Xenopus oocyte system (Li et al., 2012) or HEK293T cells (Yu et al., 2015). For SR1, specific OR residues appear to be involved in broadening the capacities of the binding pocket through a very labile toggle switch (de March et al., 2015). It will be interesting to determine if the same OR residues are involved in broadening the responsiveness in the case of MOR256‐17. The narrowly responsive receptor MOR256‐8 (also known as Olfr1362) can be converted to a broadly responsive OR by making a single mutation (I107L), as assayed in HEK293T cells (Yu et al., 2015).
The evolutionary emergence and biological relevance of broadly responsive ORs within a repertoire of mostly narrowly responsive ORs remain elusive, in the absence of behavioural data. Their role may lie in detecting the mere presence of odorants in the nasal cavity, leaving the discrimination role to narrowly responsive ORs, or in contributing to the discrimination of structurally similar ligands by increasing the number of responsive neurons (Nara et al., 2011). However, this increase in the number of responsive OSNs may blur the actual discriminating signal by increasing the noise.
It will be informative to generate gene‐targeted strains with single or combined knockouts of genes that encode broadly responsive ORs, such as SR1, MOR256‐17, and Olfr263, and to perform behavioural assays that measure olfactory performance in these mice, such as threshold detection and odorant discrimination.
Acknowledgements
The mouse strain MOR256‐17‐IRES‐tauGFP was generated in the laboratory of P.M. at The Rockefeller University. M.K. thanks the late Andreas Walz for his kind help with targeting vector construction. P.M. is grateful for generous support from The Rockefeller University and the Max Planck Society. X.G. is grateful for generous support from the CNRS and the Conseil Régional de Bourgogne. B.T. and X.G. thank Anne Lefranc and the Centre des Sciences du Goût et de l'Alimentation animal facility for excellent animal care.
Abbreviations
- GFP
green fluorescent protein
- HEK
human embryonic kidney
- IRES
internal ribosome entry site
- OR
odorant receptor
- OSN
olfactory sensory neuron
- TAAR
trace amine‐associated receptor
References
- Bressel, O.C. , Khan, M. & Mombaerts, P. (2016) Linear correlation between the number of olfactory sensory neurons expressing a given mouse odorant receptor and the total volume of the corresponding glomeruli in the olfactory bulb. J. Comp. Neurol., 524, 199–209. [DOI] [PMC free article] [PubMed] [Google Scholar]
- Buck, L. & Axel, R. (1991) A novel multigene family may encode odorant receptors: a molecular basis for odor recognition. Cell, 65, 175–187. [DOI] [PubMed] [Google Scholar]
- Cadiou, H. , Aoudé, I. , Tazir, B. , Molinas, A. , Fenech, C. , Meunier, M. & Grosmaitre, X. (2014) Postnatal odorant exposure induces peripheral olfactory plasticity at the cellular level. J. Neurosci., 34, 4857–4870. [DOI] [PMC free article] [PubMed] [Google Scholar]
- Challis, R.C. , Tian, H. , Wang, J. , He, J. , Jiang, J. , Chen, X. , Yin, W. , Connelly, T. , Ma, L. , Yu, C.R. , Pluznick, J.L. , Storm, D.R. , Huang, L. , Zhao, K. & Ma, M. (2015) An olfactory cilia pattern in the mammalian nose ensures high sensitivity to odors. Curr. Biol., 25, 2503–2512. [DOI] [PMC free article] [PubMed] [Google Scholar]
- Connelly, T. , Savigner, A. & Ma, M. (2013) Spontaneous and sensory‐evoked activity in mouse olfactory sensory neurons with defined odorant receptors. J. Neurophysiol., 110, 55–62. [DOI] [PMC free article] [PubMed] [Google Scholar]
- Dahoun, T. , Grasso, L. , Vogel, H. & Pick, H. (2011) Recombinant expression and functional characterization of mouse olfactory receptor mOR256‐17 in mammalian cells. Biochemistry‐US, 50, 7228–7235. [DOI] [PubMed] [Google Scholar]
- Dewan, A. , Pacifico, R. , Zhan, R. , Rinberg, D. & Bozza, T. (2013) Non‐redundant coding of aversive odours in the main olfactory pathway. Nature, 497, 486–489. [DOI] [PMC free article] [PubMed] [Google Scholar]
- Fuss, S.H. , Omura, M. & Mombaerts, P. (2007) Local and cis effects of the H element on expression of odorant receptor genes in mouse. Cell, 130, 373–384. [DOI] [PubMed] [Google Scholar]
- Goldsmith, B.R. , Mitala, J.J. , Josue, J. , Castro, A. , Lerner, M.B. , Bayburt, T.H. , Khamis, S.M. , Jones, R.A. , Brand, J.G. , Sligar, S.G. , Luetje, C.W. , Gelperin, A. , Rhodes, P.A. , Discher, B.M. & Johnson, A.T. (2011) Biomimetic chemical sensors using nanoelectronic readout of olfactory receptor proteins. ACS Nano, 5, 5408–5416. [DOI] [PMC free article] [PubMed] [Google Scholar]
- Grosmaitre, X. , Vassalli, A. , Mombaerts, P. , Shepherd, G.M. & Ma, M. (2006) Odorant responses of olfactory sensory neurons expressing the odorant receptor MOR23: a patch clamp analysis in gene‐targeted mice. Proc. Natl. Acad. Sci. USA, 103, 1970–1975. [DOI] [PMC free article] [PubMed] [Google Scholar]
- Grosmaitre, X. , Fuss, S.H. , Lee, A.C. , Adipietro, K.A. , Matsunami, H. , Mombaerts, P. & Ma, M. (2009) SR1, a mouse odorant receptor with an unusually broad responsive profile. J. Neurosci., 29, 14545–14552. [DOI] [PMC free article] [PubMed] [Google Scholar]
- Jarriault, D. & Grosmaitre, X. (2015) Perforated patch‐clamp recording of mouse olfactory sensory neurons in intact neuroepithelium: functional analysis of neurons expressing an identified odorant receptor. J. Vis. Exp., 101, e52652. [DOI] [PMC free article] [PubMed] [Google Scholar]
- Lam, R.S. & Mombaerts, P. (2013) Odorant responsiveness of embryonic mouse olfactory sensory neurons expressing the odorant receptors S1 or MOR23. Eur. J. Neurosci., 38, 220–2217. [DOI] [PubMed] [Google Scholar]
- Lee, A.C. , Tian, H. , Grosmaitre, X. & Ma, M. (2009) Expression patterns of odorant receptors and response properties of olfactory sensory neurons in aged mice. Chem. Senses, 34, 695–703. [DOI] [PMC free article] [PubMed] [Google Scholar]
- Li, J. , Haddad, R. , Chen, S. , Santos, V. & Luetje, C.W. (2012) A broadly tuned mouse odorant receptor that detects nitrotoluenes. J. Neurochem., 121, 881–890. [DOI] [PMC free article] [PubMed] [Google Scholar]
- Liberles, S.D. & Buck, L.B. (2006) A second class of chemosensory receptors in the olfactory epithelium. Nature, 442, 645–650. [DOI] [PubMed] [Google Scholar]
- Loch, D. , Heidel, C. , Breer, H. & Strotmann, J. (2013) Adiponectin enhances the responsiveness of the olfactory system. PLoS One, 8, e75716. [DOI] [PMC free article] [PubMed] [Google Scholar]
- Luxenhofer, G. , Breer, H. & Strotmann, J. (2008) Differential reaction of outgrowing olfactory neurites monitored in explant culture. J. Comp. Neurol., 509, 580–593. [DOI] [PubMed] [Google Scholar]
- Ma, M. , Chen, W.R. & Shepherd, G.M. (1999) Electrophysiological characterization of rat and mouse olfactory receptor neurons from an intact epithelial preparation. J. Neurosci. Meth., 92, 31–40. [DOI] [PubMed] [Google Scholar]
- de March, C.A. , Yu, Y. , Ni, M.J. , Adipietro, K.A. , Matsunami, H. , Ma, M. & Golebiowski, J. (2015) Conserved residues control activation of mammalian G‐protein coupled receptors. J. Am. Chem. Soc., 137, 8611–8616. [DOI] [PMC free article] [PubMed] [Google Scholar]
- Mombaerts, P. , Wang, F. , Dulac, C. , Chao, S.K. , Nemes, A. , Mendelsohn, M. , Edmondson, J. & Axel, R. (1996) Visualizing an olfactory sensory map. Cell, 87, 675–686. [DOI] [PubMed] [Google Scholar]
- Nara, K. , Saraiva, L. , Ye, X. & Buck, L.B. (2011) A large‐scale analysis of odor coding in the olfactory epithelium. J. Neurosci., 31, 9179–9191. [DOI] [PMC free article] [PubMed] [Google Scholar]
- Nef, P. , Hermans‐Borgmeyer, I. , Artières‐Pin, H. , Beasley, L. , Dionne, V.E. & Heinemann, S.F. (1992) Spatial pattern of receptor expression in the olfactory epithelium. Proc. Natl. Acad. Sci. USA, 89, 8948–8952. [DOI] [PMC free article] [PubMed] [Google Scholar]
- Omura, M. , Grosmaitre, X. , Ma, M. & Mombaerts, P. (2014) The β2‐adrenergic receptor as a surrogate odorant receptor in mouse olfactory sensory neurons. Mol. Cell. Neurosci., 58, 1–10. [DOI] [PMC free article] [PubMed] [Google Scholar]
- Pacifico, R. , Dewan, A. , Cawley, D. , Guo, C. & Bozza, T. (2012) An olfactory subsystem that mediates high‐sensitivity detection of volatile amines. Cell. Rep., 2, 76–88. [DOI] [PMC free article] [PubMed] [Google Scholar]
- Saito, H. , Chi, Q. , Zhuang, H. , Matsunami, H. & Mainland, J.D. (2009) Odor coding by a mammalian receptor repertoire. Sci. Signal., 2, ra9. [DOI] [PMC free article] [PubMed] [Google Scholar]
- Schwarzenbacher, K. , Fleischer, J. , Breer, H. & Conzelmann, S. (2004) Expression of olfactory receptors in the cribriform mesenchyme during prenatal development. Gene Expr. Patterns, 4, 543–552. [DOI] [PubMed] [Google Scholar]
- Schwarzenbacher, K. , Fleischer, J. & Breer, H. (2005) Formation and maturation of olfactory cilia monitored by odorant receptor‐specific antibodies. Histochem. Cell Biol., 123, 419–428. [DOI] [PubMed] [Google Scholar]
- Schwarzenbacher, K. , Fleischer, J. & Breer, H. (2006) Odorant receptor proteins in olfactory axons and in cells of the cribriform mesenchyme may contribute to fasciculation and sorting of nerve fibers. Cell Tissue. Res., 323, 211–219. [DOI] [PubMed] [Google Scholar]
- Strotmann, J. , Levai, O. , Fleischer, J. , Schwarzenbacher, K. & Breer, H. (2004) Olfactory receptor proteins in axonal processes of chemosensory neurons. J. Neurosci., 24, 7754–7761. [DOI] [PMC free article] [PubMed] [Google Scholar]
- Yu, Y. , de March, C.A. , Ni, M.J. , Adipietro, K.A. , Golebiowski, J. , Matsunami, H. & Ma, M. (2015) Responsivess of G‐protein coupled receptors is partially attributed to the activation mechanism. Proc. Natl. Acad. Sci. USA, 112, 14966–14971. [DOI] [PMC free article] [PubMed] [Google Scholar]
- Zhang, X. & Firestein, S. (2002) The olfactory receptor gene superfamily of the mouse. Nat. Neurosci., 5, 124–133. [DOI] [PubMed] [Google Scholar]
- Zhang, J. , Huang, G. , Dewan, A. , Feinstein, P. & Bozza, T. (2012) Uncoupling stimulus specificity and glomerular position in the mouse olfactory system. Mol. Cell. Neurosci., 51, 79‐88. [DOI] [PMC free article] [PubMed] [Google Scholar]
- Zhang, J. , Pacifico, R. , Cawley, D. , Feinstein, P. & Bozza, T. (2013) Ultrasensitive detection of amines by a trace amine‐associated receptor. J. Neurosci., 33, 3228–3239. [DOI] [PMC free article] [PubMed] [Google Scholar]