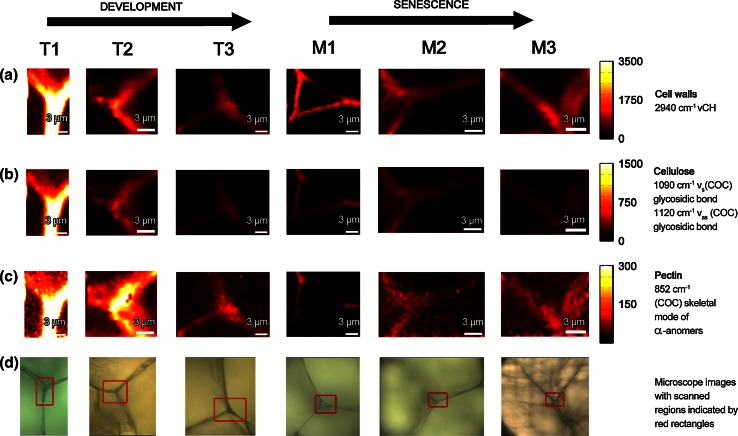
Fig. 4.
Raman maps of the cell wall in apple parenchyma tissue at the development stages T1, T2 and T3 and during 1 M1, 2 M2 and 3 M3 months storage. The Raman maps were obtained by integrating Raman bands from 2760 to 3100 cm−1 (C–H stretching vibration) (cell wall material CW) (a), from 1000 to 1179 cm−1 (mainly cellulose) (b), from 840 to 885 cm−1 (pectin) (c). The red squares on the bright field images (d) mark the investigated areas by Raman imaging

