This study introduces a fully automated method for the computation of quantitative volumetric breast density from digital breast tomosynthesis (DBT) images and demonstrates a comparison with volume-based measures from full-field mammography, DBT, and MR imaging.
Abstract
Purpose
To assess a fully automated method for volumetric breast density (VBD) estimation in digital breast tomosynthesis (DBT) and to compare the findings with those of full-field digital mammography (FFDM) and magnetic resonance (MR) imaging.
Materials and Methods
Bilateral DBT images, FFDM images, and sagittal breast MR images were retrospectively collected from 68 women who underwent breast cancer screening from October 2011 to September 2012 with institutional review board–approved, HIPAA-compliant protocols. A fully automated computer algorithm was developed for quantitative estimation of VBD from DBT images. FFDM images were processed with U.S. Food and Drug Administration–cleared software, and the MR images were processed with a previously validated automated algorithm to obtain corresponding VBD estimates. Pearson correlation and analysis of variance with Tukey-Kramer post hoc correction were used to compare the multimodality VBD estimates.
Results
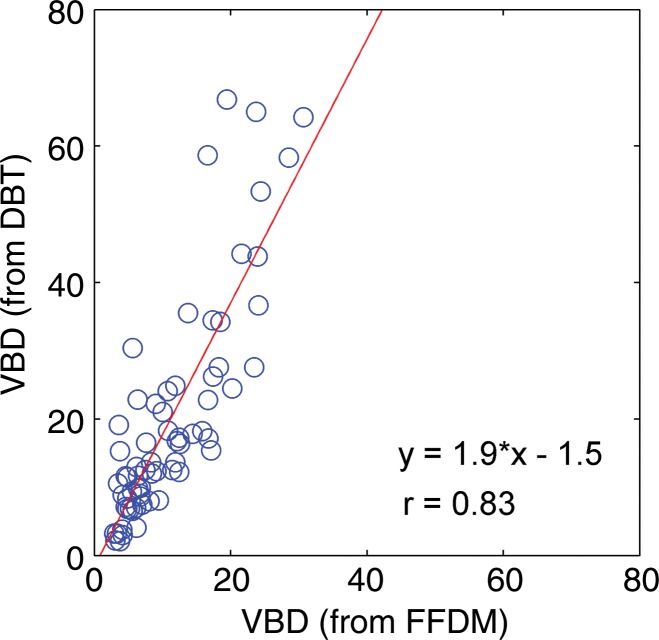
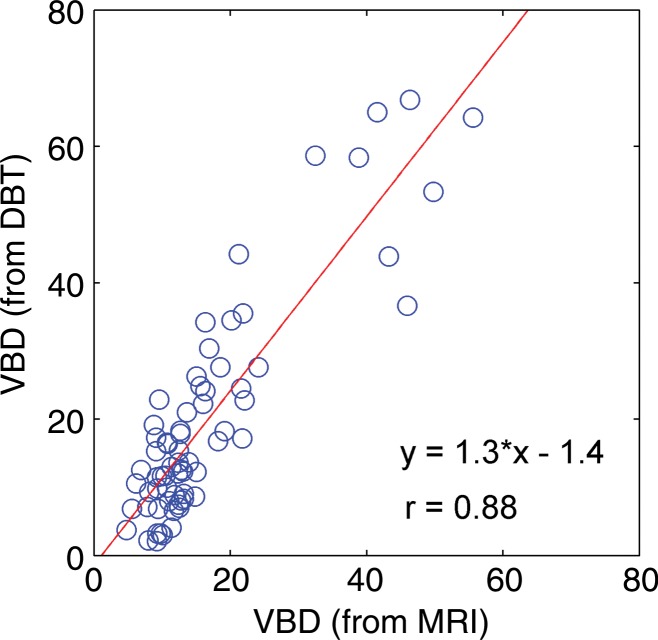
Estimates of VBD from DBT were significantly correlated with FFDM-based and MR imaging–based estimates with r = 0.83 (95% confidence interval [CI]: 0.74, 0.90) and r = 0.88 (95% CI: 0.82, 0.93), respectively (P < .001). The corresponding correlation between FFDM and MR imaging was r = 0.84 (95% CI: 0.76, 0.90). However, statistically significant differences after post hoc correction (α = 0.05) were found among VBD estimates from FFDM (mean ± standard deviation, 11.1% ± 7.0) relative to MR imaging (16.6% ± 11.2) and DBT (19.8% ± 16.2). Differences between VDB estimates from DBT and MR imaging were not significant (P = .26).
Conclusion
Fully automated VBD estimates from DBT, FFDM, and MR imaging are strongly correlated but show statistically significant differences. Therefore, absolute differences in VBD between FFDM, DBT, and MR imaging should be considered in breast cancer risk assessment.
© RSNA, 2015
Introduction
Breast cancer is the most commonly diagnosed cancer in the United States and the second leading cause of death from cancer in women. Breast density is an independent risk factor for breast cancer (1–8). Currently, while there is substantial debate on the cost-effectiveness of performing supplemental screening for women with dense breasts, breast density is being increasingly considered in modeling breast cancer risk and guiding personalized screening recommendations (9,10).
The most widely used classification system of mammographic density in the United States is the American College of Radiology Breast Imaging Reporting and Data System (BI-RADS), a qualitative assessment based on subjective visual interpretation, with only moderate interobserver agreement (11,12). The moderate interreader agreement may partly account for the minimal improvement in the predictive accuracy of the Gail model, and therefore a quantitative assessment of density might allow more accurate predictions of risk. Additionally, in the fifth edition of the BI-RADS atlas, each breast is graded by using four categories on the basis of the densest area of the mammogram, not the overall area or volume of density. Therefore, this limits the use of the new BI-RADS density assessments in future studies aimed at expanding the current understanding of density as it relates to risk or other possible applications, such as therapy response. It has been shown that the addition of BI-RADS breast density categories to the Gail breast cancer risk assessment model only minimally improves the predictive accuracy (13). Therefore, objective and accurate methods for the estimation of density are needed to ensure reliable estimation and, ultimately, yield quantitative reproducible measures that are clinically useful. Existing quantitative methods provide either area-based or volume-based estimates of breast density. Area-based percentage density (PD) is usually estimated as the ratio of the opaque mammographic tissue (white pixels) over the total breast area by outlining the dense tissue with either computer-aided semiautomated thresholding methods (14) or fully automated algorithms (15,16).
With volume-based quantitative density methods, the aim is to better estimate the amount of fibroglandular (ie, dense) tissue with respect to the total volume of the breast. These techniques are expected to provide more accurate estimates of breast composition than measurements performed directly on two-dimensional (2D) projections, as is done with the conventional PD measures. With existing approaches, volumetric breast density (VBD) is measured by means of true three-dimensional (3D) imaging modalities, such as magnetic resonance (MR) imaging (17,18), or attempts are made to infer VBD from 2D mammograms via physics-based models (19–22). Digital breast tomosynthesis (DBT) is an imaging modality that allows for 3D reconstruction of the breast volume. DBT is rapidly being adopted in breast centers throughout the world, since early studies have shown improvements in screening outcomes when this technique (23,24,25) is used. Recently, new technology has allowed the reconstruction of the 2D image set (eg, synthetic 2D views) from the 3D tomosynthesis acquisition, potentially alleviating the need for the conventional 2D digital mammographic exposure (23–26). In this work, we present a method for fully automated estimation of VBD from DBT images and compare the findings with corresponding estimates obtained from full-field digital mammography (FFDM) and breast MR imaging.
Materials and Methods
The software used in this study for the estimation of VBD from FFDM was provided by Matakina, Wellington, New Zealand.
Case Selection and Imaging Techniques
For this study, dual-modality bilateral images (DBT plus FFDM) were retrospectively collected for 80 women (age range, 24–82 years; mean age, 52 years) screened at our institution with the approval of the institutional review board, in compliance with the Health Insurance Portability and Accountability Act. The examinations were all screenings conducted in the period between October 2011 and September 2012, for which MR imaging examinations were performed within 3 months of the dual-modality imaging examinations. Data from MR imaging examinations were included if they were acquired for high-risk screening, diagnostic MR imaging conducted after identification of abnormal mammographic findings, and staging MR imaging examinations for recently detected cancers. MR examinations were excluded if they were performed for biopsy guidance or for postsurgical or posttreatment follow-up. Women for whom raw mammograms (ie, labeled “for processing”) were not available (n = 11) were excluded, since these images are required for the estimation of VBD from FFDM. Women with breast implants (n = 1) were also removed from this study, since breast implants can lead to erroneous density estimates when using automated tools. The BI-RADS categories of breast density were extracted from the clinical screening report. In the final data set (n = 68), there was one case of BI-RADS category I density, and there were 28 cases of BI-RADS category II density, 34 cases of BI-RADS category III density, and four cases of BI-RADS category IV density.
For all dual-modality (“combination-mode”) examinations, DBT and FFDM images were acquired in our clinic by using U.S. Food and Drug Administration–approved commercial systems (Selenia Dimensions; Hologic, Bedford, Mass). Each examination included two-view craniocaudal and mediolateral oblique images for each breast. In the dual-modality protocol, the breast is compressed, and the x-ray tube moves along a limited-angle arc, which allows for the acquisition of 15 low-dose tomosynthesis projection images (pixel size, 117 μm). These projection images are then used to generate nonoverlapping reconstruction sections of the breast 1 mm apart (pixel size, 90–115 μm). During the same compression, a conventional mammogram (pixel size, 65 μm) is also acquired, resulting in 2D FFDM images that are fully spatially coregistered with the DBT reconstruction sections. Thus, each dual-modality view is comprised of one FFDM image, 15 tomosynthesis projection images, and a varying number of tomosynthesis reconstruction sections (between 38 and 113 sections in our data set), depending on the thickness of the compressed breast.
All MR imaging examinations were performed with a 1.5-T imaging unit (Siemens Espree; Siemens, Munich, Germany) with a matrix size of 512 × 512, section thickness of 2.4–3.5 mm, and 12-bit gray-scale resolution, with the patient in prone position with minimal breast compression. For each MR imaging examination, a T1-weighted nonenhanced sequence without fat suppression was used.
VBD from DBT
An algorithm for the fully automated estimation of VBD from DBT images was developed for this work. The technical aspects of this algorithm are summarized below, while the detailed mathematical descriptions can be found in Appendix E1 (online).
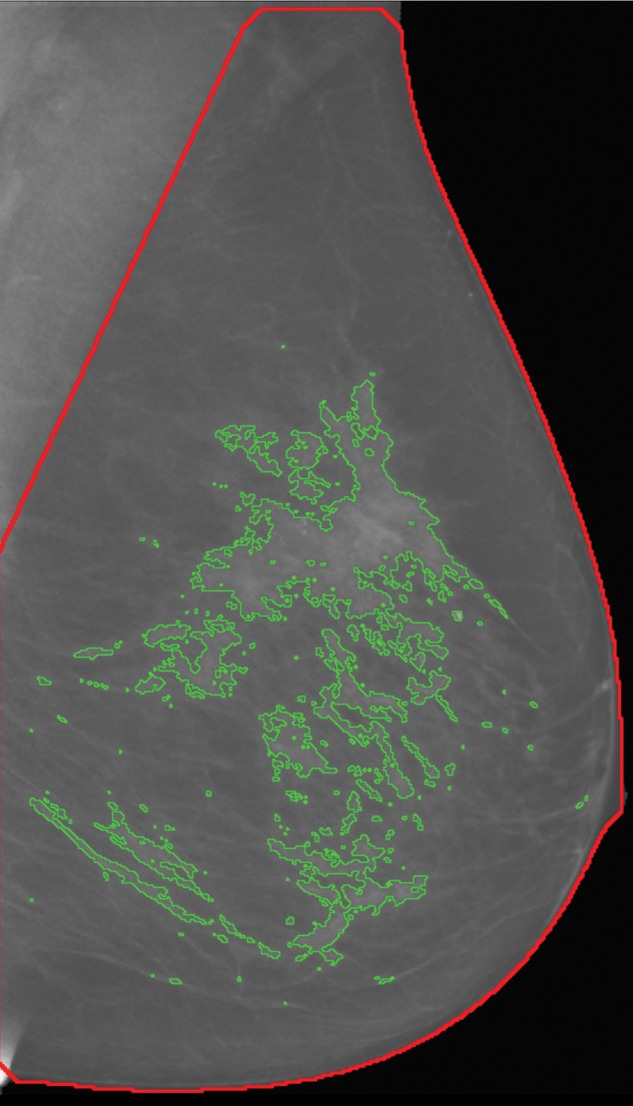
The first step of our algorithm operates on the tomosynthesis projection images to segment the breast tissue into dense versus nondense regions by following an approach similar to that used for the computation of PD on conventional mammograms (Fig E1 [online]). This stage leverages the fact that, from a technical aspect, tomosynthesis projection images can be regarded as low-dose mammograms, and, therefore, previously published algorithms for digital mammography (16) can readily be adapted to deal with these images. The outcome of this stage is a set of 15 segmented images that correspond to each of the source tomosynthesis projections (Fig 1).
Figure 1a:
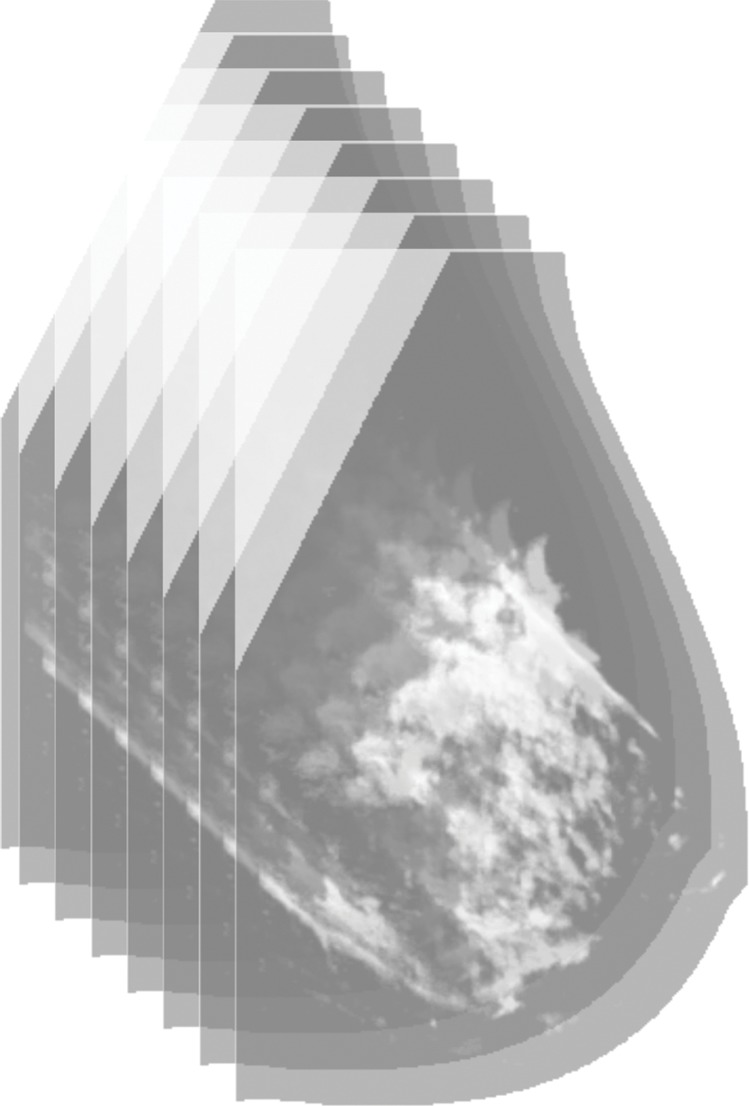
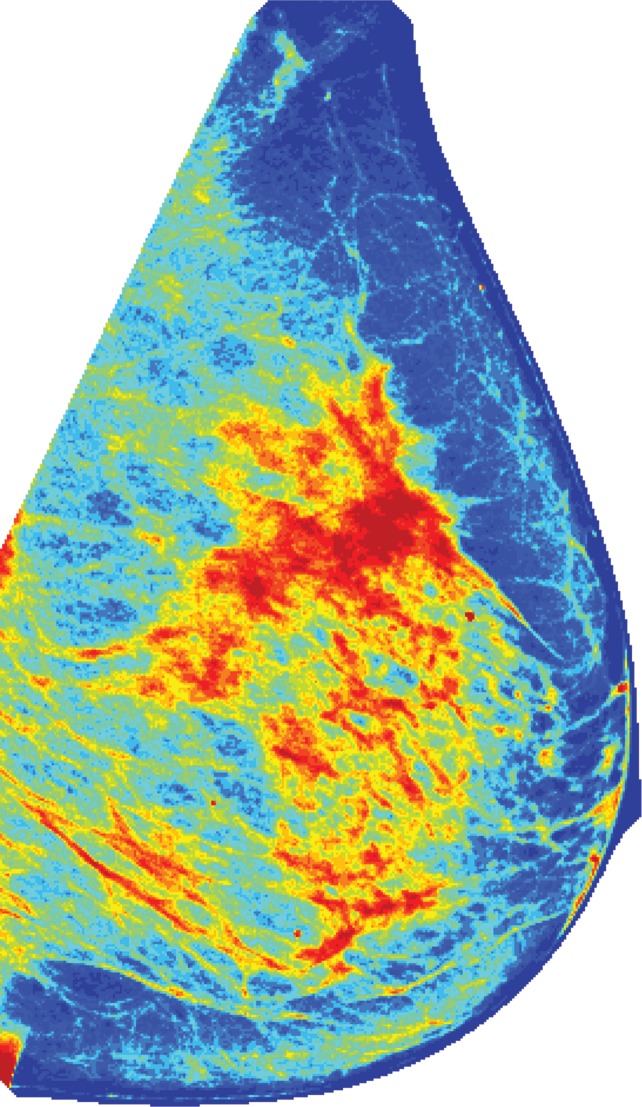
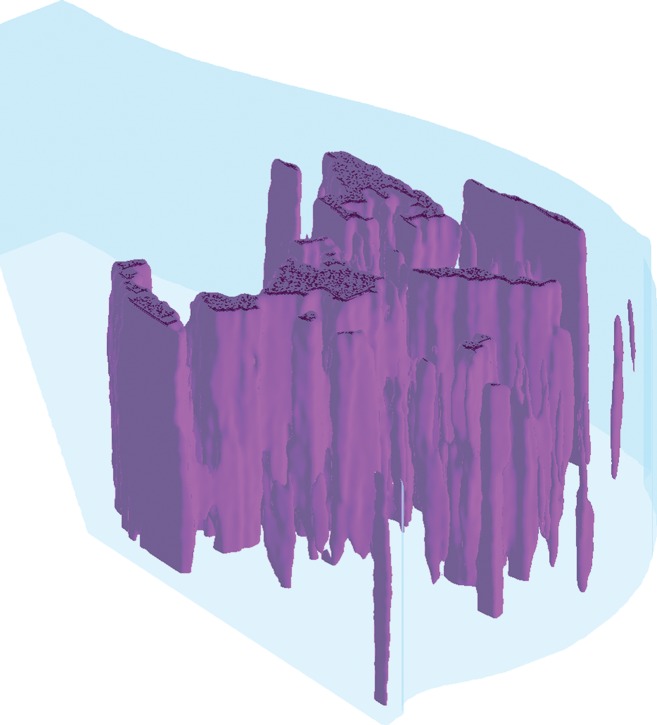
Algorithm outline for VBD estimation from DBT images. The process is performed in four steps: (a) Dense versus nondense tissue segmentation is conducted on tomosynthesis source projection images (the green boundaries represent the dense tissue). (b) A tridimensional likelihood map is constructed from the projection images (an intermediate section is shown). The brightness indicates the probability of being dense tissue. (c) Features are extracted from each tomosynthesis reconstructed section (color shows intensity), and (d) the 3D fibroglandular tissue is segmented on the basis of multifeature support vector machine classification.
Figure 1b:
Algorithm outline for VBD estimation from DBT images. The process is performed in four steps: (a) Dense versus nondense tissue segmentation is conducted on tomosynthesis source projection images (the green boundaries represent the dense tissue). (b) A tridimensional likelihood map is constructed from the projection images (an intermediate section is shown). The brightness indicates the probability of being dense tissue. (c) Features are extracted from each tomosynthesis reconstructed section (color shows intensity), and (d) the 3D fibroglandular tissue is segmented on the basis of multifeature support vector machine classification.
Figure 1c:
Algorithm outline for VBD estimation from DBT images. The process is performed in four steps: (a) Dense versus nondense tissue segmentation is conducted on tomosynthesis source projection images (the green boundaries represent the dense tissue). (b) A tridimensional likelihood map is constructed from the projection images (an intermediate section is shown). The brightness indicates the probability of being dense tissue. (c) Features are extracted from each tomosynthesis reconstructed section (color shows intensity), and (d) the 3D fibroglandular tissue is segmented on the basis of multifeature support vector machine classification.
Figure 1d:
Algorithm outline for VBD estimation from DBT images. The process is performed in four steps: (a) Dense versus nondense tissue segmentation is conducted on tomosynthesis source projection images (the green boundaries represent the dense tissue). (b) A tridimensional likelihood map is constructed from the projection images (an intermediate section is shown). The brightness indicates the probability of being dense tissue. (c) Features are extracted from each tomosynthesis reconstructed section (color shows intensity), and (d) the 3D fibroglandular tissue is segmented on the basis of multifeature support vector machine classification.
In the second stage, these segmented projection images are used to build a 3D map of the breast volume, with the statistical likelihood of fibroglandular tissue in each voxel. For this purpose, we incorporated an algorithm from the field of computer vision, called “shape from silhouette” (27), which can reconstruct 3D models of real, opaque objects from several images of the same object captured from different angles (27). The “shape from silhouette” framework was adapted to work on the segmented tomosynthesis projections and, on the basis of the particular acquisition geometry (physical dimensions and design of the gantry) of tomosynthesis sequences, to generate the 3D likelihood map (Fig E2 [online]).
Because of the limited angle of DBT scanning, the reconstruction process gives rise to blurring artifacts, and the obtained sections are only quasi-tridimensional, with lower resolution in the plane perpendicular to the detector. This limitation also applies for the likelihood map described earlier. Therefore, the aim of the final stage is to improve and refine the segmentation by incorporating features obtained from the DBT reconstructed sections by means of different image-processing algorithms (Table E1 [online]). In particular, several statistical descriptors (such as mean, standard deviation, and higher-order moments [16]), focus measure operators (aimed at detecting blurring artifacts [28]), and image acquisition parameters (such as exposure, patient age, breast thickness, x-ray tube current, and compression force) are integrated into a support vector machine classifier to yield the final dense tissue segmentation and compute the VBD as follows:
where FGT (in cubic centimeters) is the volume of the segmented fibroglandular tissue and VT (in cubic centimeters) is the total breast volume. This algorithm therefore allows for the computation of VBD for each DBT view of each breast. These values are then averaged on a per-breast basis to perform bilateral comparisons and on a per-woman basis for the purpose of comparison with MR imaging and FFDM.
To assess the accuracy of the obtained automated fibroglandular tissue segmentation, the PD for six subjects (of varied breast density) from the mediolateral oblique view per subject (total of 42 sections) was independently evaluated manually by the three breast imagers (E.S.M., S.P.W., and E.F.C., with 9–25 years of experience in screening mammography) by using a validated, interactive image-thresholding tool (Cumulus 4.0; University of Toronto, Toronto, Ontario, Canada) that has been widely used for density segmentation of conventional mammography images and also recently for tomosynthesis images (14,29). Each set of DBT sections consisted of seven tomographic sections of the full reconstructed stack of the breast chosen to represent a balanced selection that covered the entire breast depth (ie, 10%, 23%, 37%, 50%, 63%, 77%, and 90% of the breast thickness).
Breast Density at FFDM and MR Imaging
VBD at 2D FFDM was measured by using U.S. Food and Drug Administration–cleared software (Volpara 1.5; Matakina, Wellington, New Zealand) (30). This algorithm requires raw digital mammograms for the computation of VBD. The volume of tissue is estimated at each image pixel by using the x-ray attenuation of fat as the reference and by using the breast thickness in the estimate of the volume. The absolute amount of dense tissue in the whole breast is then measured by integrating the volume of dense tissue that corresponds to each pixel of the imaged breast. The VBD is finally computed as the ratio of the dense tissue to fat and the total breast volume that, in turn, is computed from the breast area and the breast thickness. Similar to the VBD estimation from DBT (in the equation), density estimates were computed for each FFDM view of the breast (craniocaudal and mediolateral oblique), and the per-woman mean values were estimated for all subsequent comparisons.
VBD from MR images was computed by using fully automated, previously validated software (17). Each 2D section of the bilateral MR image is first segmented into a dense versus nondense tissue map on the basis of the pixel intensities by using the fuzzy c-means clustering algorithm. Then, a prior fibroglandular tissue likelihood atlas is incorporated to refine the initial map and achieve refined segmentation. The VBD is then computed as the ratio of the total fibroglandular tissue volume to the total breast volume by using information from all the segmented MR imaging sections.
For comparison purposes, area-based breast PD was also computed from the corresponding 2D FFDM study. In this case, a fully automated, previously validated algorithm was used for segmenting the dense tissue on the processed mammogram to estimate PD (16). Similar to the VBD measures, all 2D mammograms that corresponded to the four standard views (bilateral craniocaudal and mediolateral oblique views) were analyzed, and the mean was used for each woman.
Statistical Analysis
To assess the robustness of our algorithm for the estimation of VBD from DBT images, the agreement according to side and view was evaluated by using linear regression analysis with Pearson correlation coefficients and 95% confidence intervals (CIs). PD from the subset of the manually segmented DBT sections was also compared with the automatic segmentation (Fig 2), where agreement between multiple readers and the automated method was assessed by using the Pearson correlation coefficient and 95% CIs.
Figure 2a:
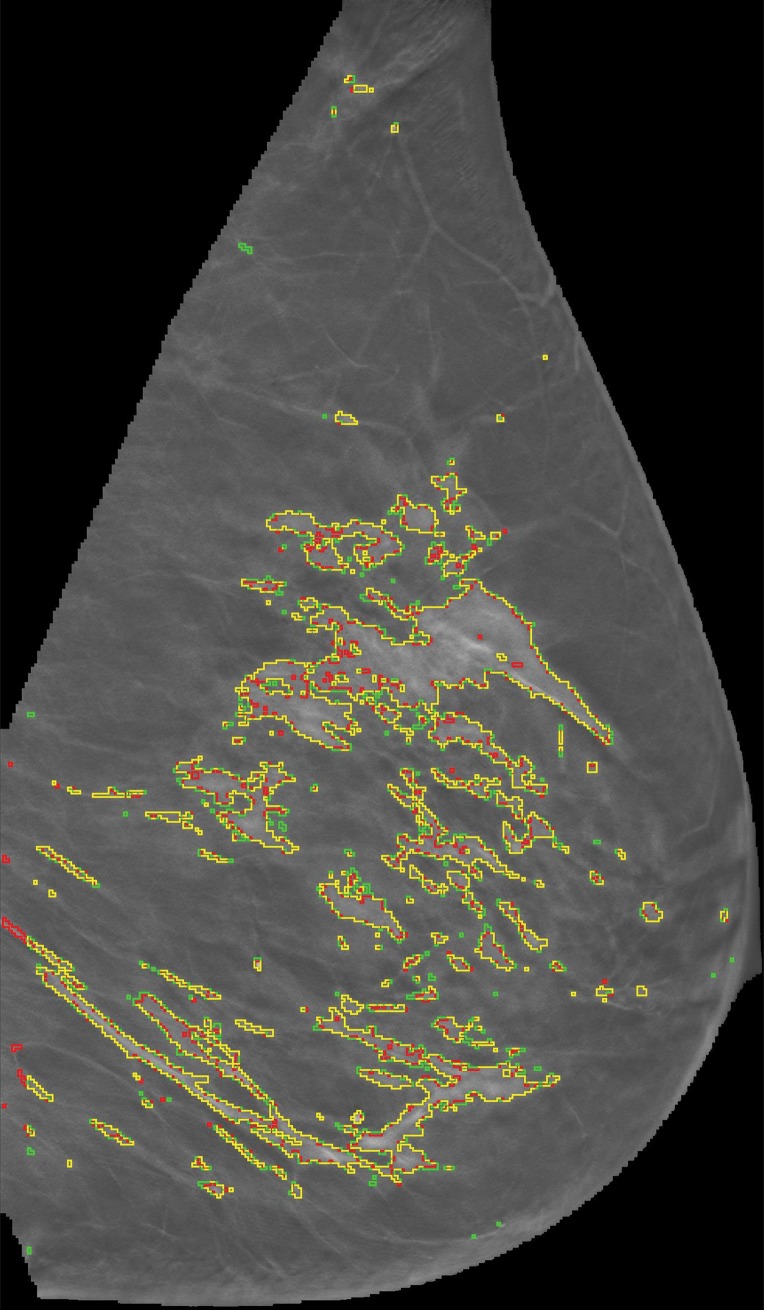
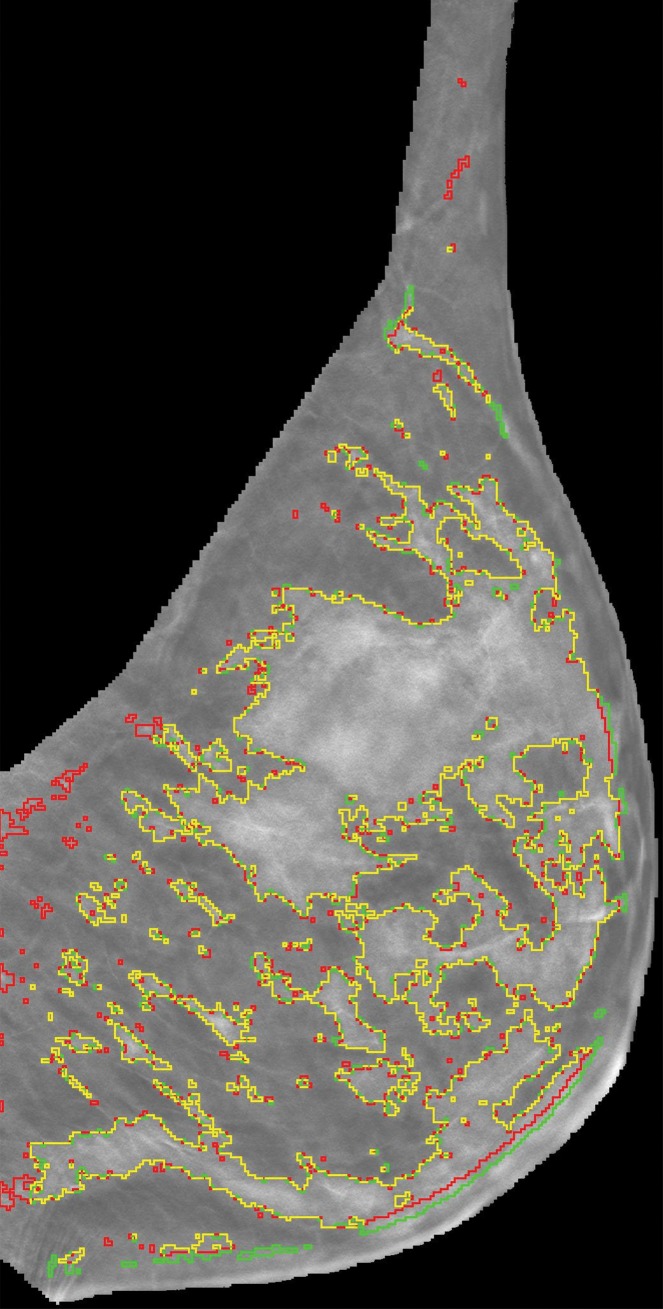
Representative DBT reconstructed sections for three different women undergoing routine screening show manual segmentation conducted by a human investigator (red) and automated segmentation (green). The women were (a) 69 years of age, (b) 68 years of age, and (c) 36 years of age. An almost perfect match between manual and automated segmentation is shown (yellow).
Figure 2b:
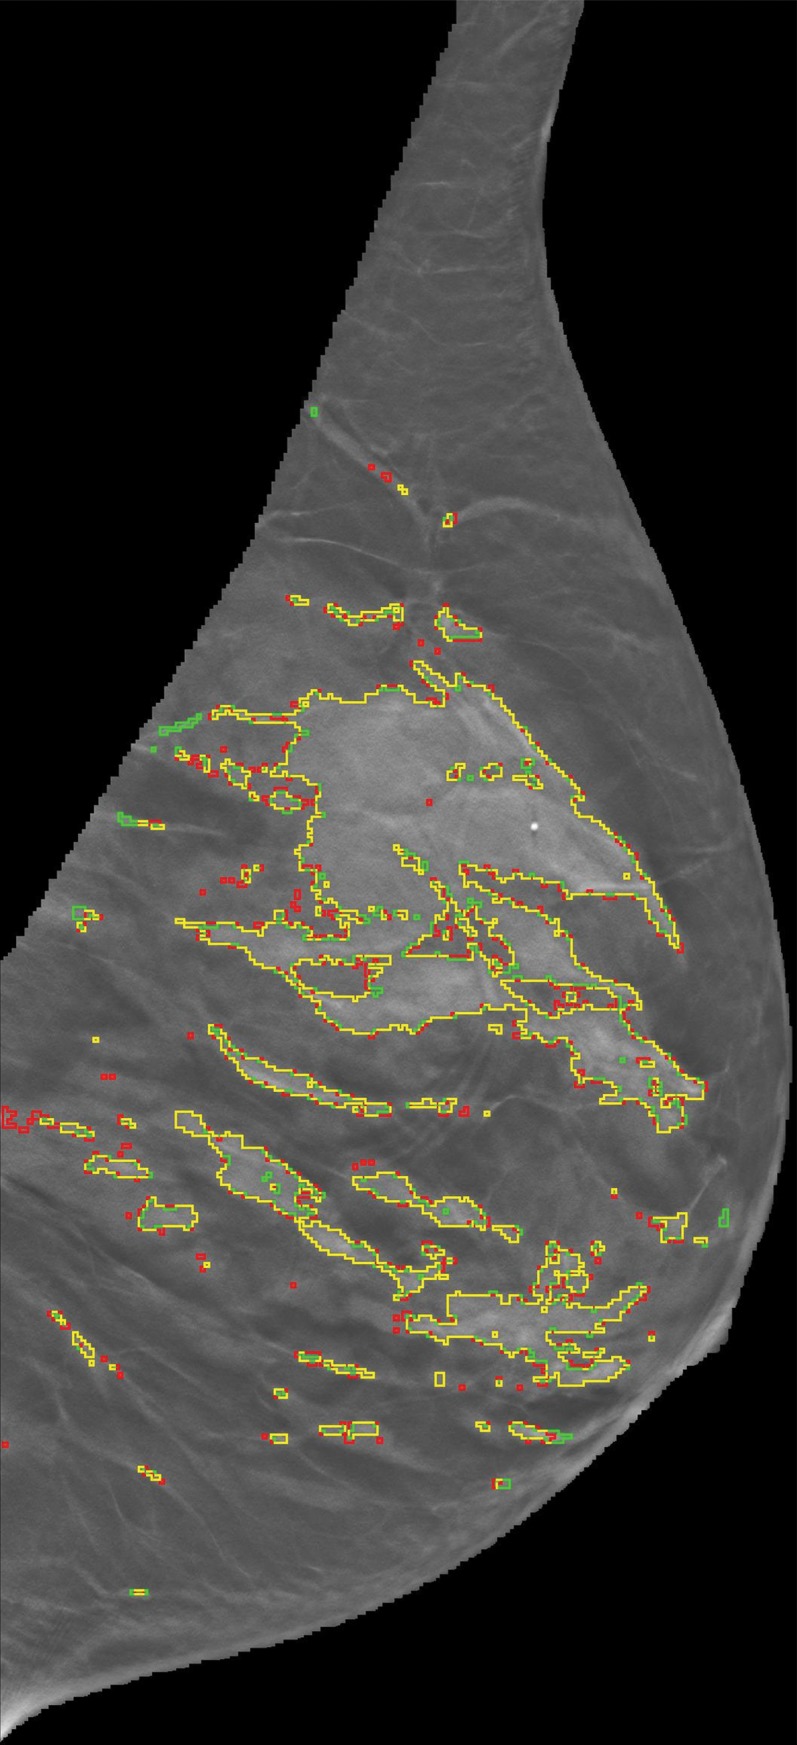
Representative DBT reconstructed sections for three different women undergoing routine screening show manual segmentation conducted by a human investigator (red) and automated segmentation (green). The women were (a) 69 years of age, (b) 68 years of age, and (c) 36 years of age. An almost perfect match between manual and automated segmentation is shown (yellow).
Figure 2c:
Representative DBT reconstructed sections for three different women undergoing routine screening show manual segmentation conducted by a human investigator (red) and automated segmentation (green). The women were (a) 69 years of age, (b) 68 years of age, and (c) 36 years of age. An almost perfect match between manual and automated segmentation is shown (yellow).
One-way analysis of variance was used for assessing differences in volumetric density estimates among the studied modalities. Subsequently, volumetric estimates from FFDM, DBT, and MR imaging were compared by using the Tukey-Kramer method as a post hoc test to identify significant differences between estimates from each pair of modalities. To establish the association between the VBD estimates from different modalities, linear regression analysis was performed, and the Pearson correlation coefficient and 95% CIs were computed between estimates of VBD, absolute fibroglandular tissue volume, and total breast volume on a per-woman basis. Finally, the VBD estimates from FFDM and DBT were also compared with conventional PD. The significance level for all tests was set at α = .05. All analyses were performed with Matlab software for Windows (version R2013b; Mathworks, Natick, Mass).
Results
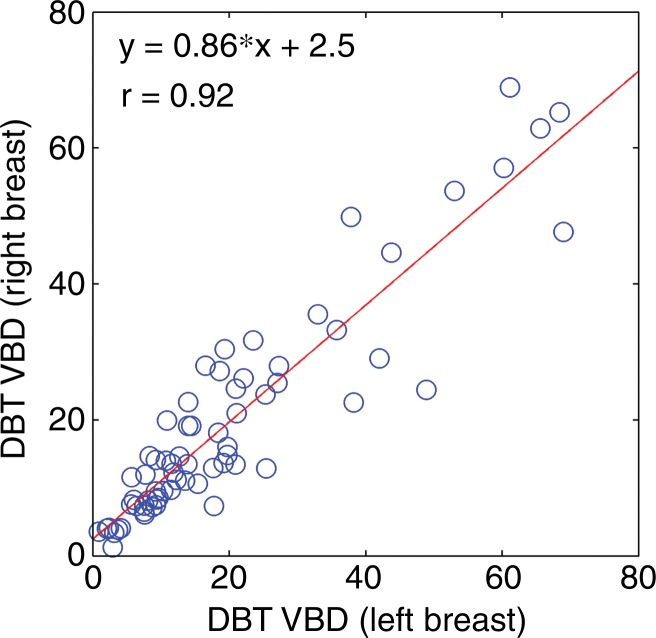
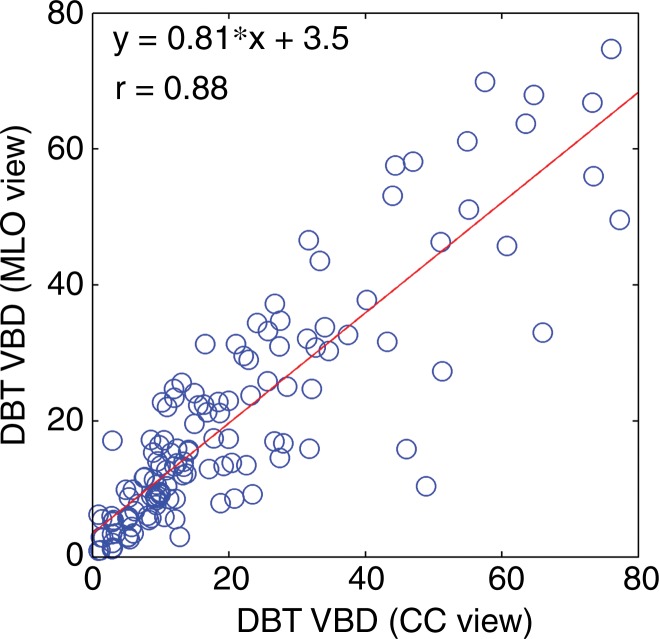
VBD estimates from DBT showed substantial agreement according to breast laterality, with r = 0.92 (95% CI: 0.88, 0.95), and according to acquisition view, with r = 0.88 (95% CI: 0.83, 0.91) (Fig 3). Substantial agreement was also observed among density estimates that resulted from manual versus automated fibroglandular tissue segmentation (Table 1).
Figure 3a:
Scatterplots for VBD estimates (a) per breast and (b) per side. Linear regression lines, along with related r values, show high agreement. CC = craniocaudal, MLO = mediolateral oblique.
Table 1.
Agreement between Multiple Readers and the Automated Method for Fibroglandular Tissue Segmentation on DBT Reconstruction Sections as Measured with the Pearson Correlation Coefficient

Note.—Numbers in parentheses are 95% CIs.
Figure 3b:
Scatterplots for VBD estimates (a) per breast and (b) per side. Linear regression lines, along with related r values, show high agreement. CC = craniocaudal, MLO = mediolateral oblique.
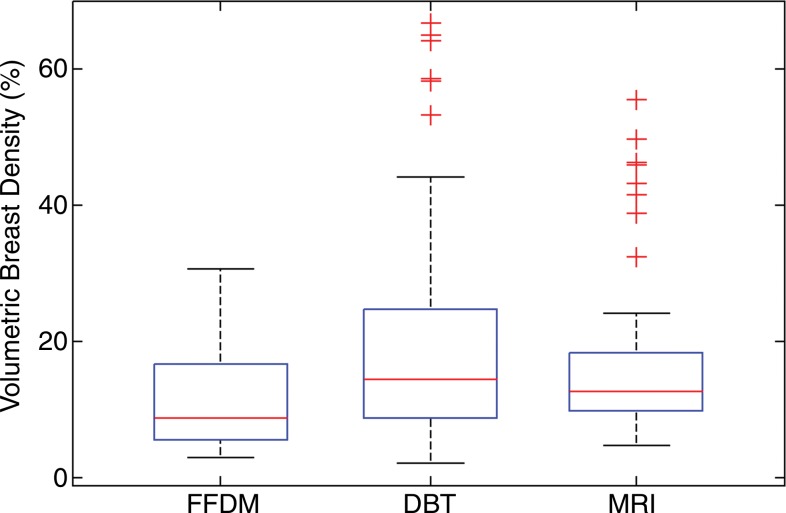
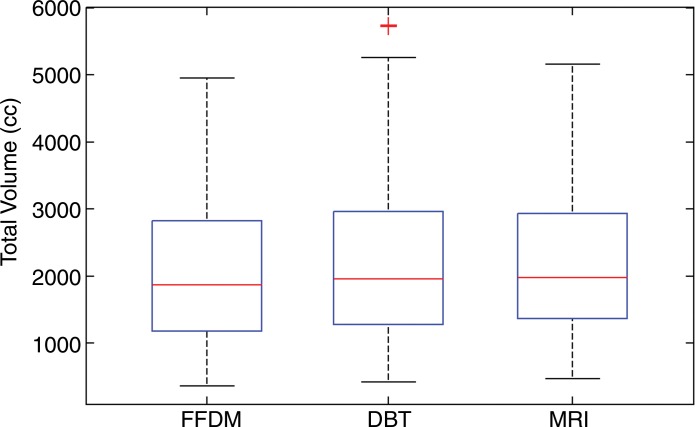
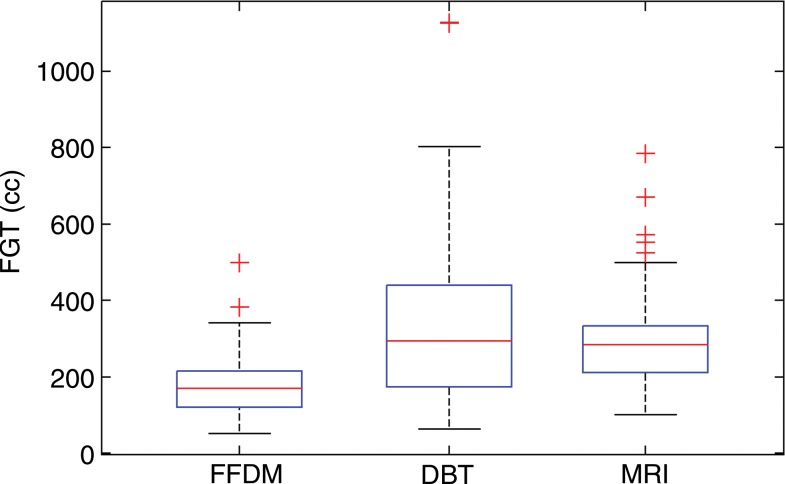
Analysis of variance results showed significant differences in VBD and fibroglandular tissue volume (P < .01) but not total breast volume (P = .61) among the studied modalities. The mean values of VBD estimates from FFDM, DBT, and MR imaging were 11.1% ± 7.0, 19.8% ± 16.2, and 16.6% ± 11.2, respectively. The mean values of fibroglandular tissue volume from FFDM, DBT, and MR imaging were 178 cm3 ± 83, 338 cm3 ± 218, and 297 cm3 ± 128, respectively. As for the total breast volume, the mean values were 2050 cm3 ± 1120, 2230 cm3 ± 1250, and 2210 cm3 ± 1125 for FFDM, DBT, and MR imaging, respectively. The Tukey-Kramer method showed that differences in VBD estimates from FFDM were significantly different than those from both MR imaging and DBT at the α = .05 significance level. In contrast, no significant differences between estimates from DBT and MR imaging were found (P = .26). Similar results were found for the fibroglandular tissue volume estimates. No statistically significant difference (P = .64–.99) was found in total breast volume between any of the modalities (Fig 4).
Figure 4a:
Box plots used to compare VBD estimates from FFDM, MR imaging, and DBT images. (a) VBD estimates from FFDM are significantly different than those from DBT and MR imaging. Estimates from MR imaging and DBT are not significantly different. (b) Total breast volume estimates are not significantly different. (c) Absolute fibroglandular tissue volume estimates from FFDM are significantly different than those from DBT and MR imaging. Estimates from MR imaging and DBT are not significantly different. FGT = fibroglandular tissue volume.
Figure 4b:
Box plots used to compare VBD estimates from FFDM, MR imaging, and DBT images. (a) VBD estimates from FFDM are significantly different than those from DBT and MR imaging. Estimates from MR imaging and DBT are not significantly different. (b) Total breast volume estimates are not significantly different. (c) Absolute fibroglandular tissue volume estimates from FFDM are significantly different than those from DBT and MR imaging. Estimates from MR imaging and DBT are not significantly different. FGT = fibroglandular tissue volume.
Figure 4c:
Box plots used to compare VBD estimates from FFDM, MR imaging, and DBT images. (a) VBD estimates from FFDM are significantly different than those from DBT and MR imaging. Estimates from MR imaging and DBT are not significantly different. (b) Total breast volume estimates are not significantly different. (c) Absolute fibroglandular tissue volume estimates from FFDM are significantly different than those from DBT and MR imaging. Estimates from MR imaging and DBT are not significantly different. FGT = fibroglandular tissue volume.
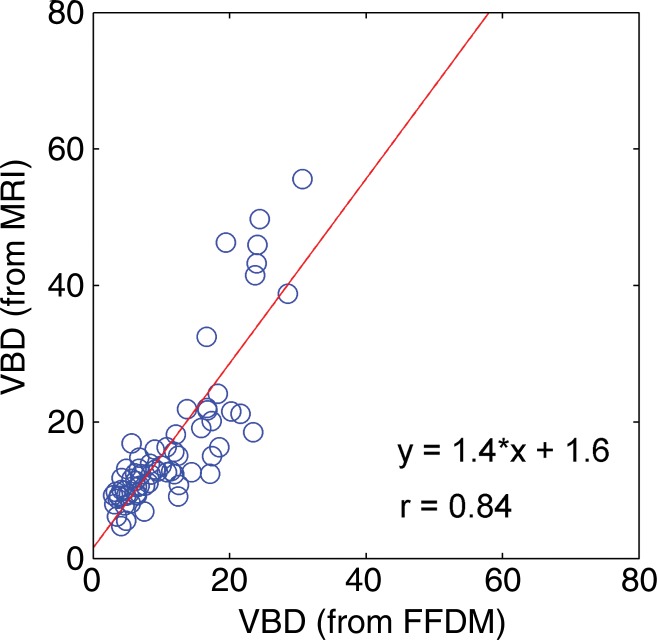
Regression analysis and Pearson correlation coefficients demonstrated substantial correlation among VBD from the different modalities, with the strongest agreement between MR imaging and DBT (r = 0.88). High agreement was also observed for estimates of total breast volume from different modalities (Table 2, Fig 5). Finally, the VBD estimates from FFDM and DBT were also compared with conventional PD. Regression analysis and Pearson correlation coefficients showed moderate agreement between VBD estimates from DBT and PD from FFDM, with r = 0.65 (95% CI: 0.48, 0.71), and high agreement between VBD and PD estimates from FFDM, with r = 0.85 (95% CI: 0.77, 0.81).
Table 2.
Pearson Correlation Coefficients among VBD Estimates Obtained from FFDM, MR Imaging, and DBT Images
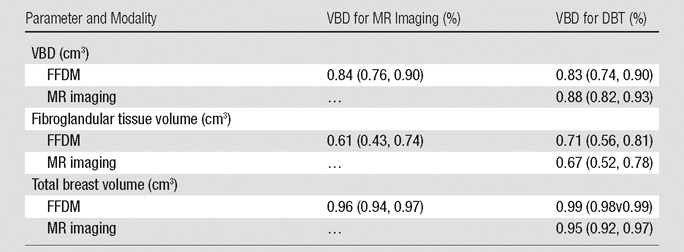
Note.—Numbers in parentheses are 95% CIs.
Figure 5a:
Scatterplots show strong associations between the VBD estimates obtained from FFDM, MR imaging, and DBT images. (a) FFDM versus MR imaging, (b) FFDM versus DBT, (c) and MR imaging versus DBT results are shown. Linear regression lines, along with the related r values, are also demonstrated.
Figure 5b:
Scatterplots show strong associations between the VBD estimates obtained from FFDM, MR imaging, and DBT images. (a) FFDM versus MR imaging, (b) FFDM versus DBT, (c) and MR imaging versus DBT results are shown. Linear regression lines, along with the related r values, are also demonstrated.
Figure 5c:
Scatterplots show strong associations between the VBD estimates obtained from FFDM, MR imaging, and DBT images. (a) FFDM versus MR imaging, (b) FFDM versus DBT, (c) and MR imaging versus DBT results are shown. Linear regression lines, along with the related r values, are also demonstrated.
Discussion
The contribution of this work is twofold. First, a method for fully automated estimation of VBD from DBT images has been developed. Second, quantitative estimates of VBD obtained with different modalities have been compared. In previous studies, PD estimates from different modalities have been compared (14,22). In this study, a fully automated method is introduced for the computation of quantitative VBD from DBT images and demonstrates a comparison with volume-based measures from FFDM, DBT, and MR imaging. The method developed in our study also showed substantial agreement with manual density segmentation of DBT.
In the past decade, several automatic volumetric methods have been developed for breast density measurement. Most existing approaches involve the use of either 2D mammograms or MR imaging, with each alternative having its own limitations. In the past, the appropriateness of estimating volumetric density from 2D projections, such as screen-film or digital mammograms, has been questioned (31,32). Additionally, other tridimensional images were rarely available, since mammography has been the standard modality used for screening purposes (33). Most current tomosynthesis units have dual functionality, where both 2D FFDM and DBT are performed with the same unit as a “combination mode” during the same breast compression. Recent studies in which single-vendor units were used have shown that this combination mode of DBT plus 2D FFDM is associated with increased specificity and sensitivity in breast cancer screening when compared with 2D FFDM alone (24,25,34,35). Additionally, DBT shares some of the advantages of FFDM, such as reproducibility, consistent quality, and ease of image processing. As a result, it is likely that more practices will shift their screening mammography population from FFDM to DBT imaging, combined with synthetic 2D reconstructed images (32,36,37). Thus, the development of reliable quantitative methods for the automatic estimation of volume-based density from DBT images in the clinical setting would be important to provide a new means to further evaluate the importance of density and breast cancer risk on a population level, as well as allow accurate density estimation for breast cancer risk assessment models and personalized breast cancer screening protocols.
Tagliafico et al compared MR imaging, FFDM, and DBT for the quantitative estimation of 2D area-based density (37). In that work, density measures were highly correlated, but a significant difference was found between PD estimates from FFDM images and DBT projection images, as well as between PD estimates from FFDM and MR imaging sections. Similarly, our results on the comparison of volume-based density estimates from FFDM, DBT, and MR imaging showed that the three measures correlate substantially well. Previous data involving the use of volume-based density estimates from FFDM and MR imaging (38,39) have also shown high correlation between volumetric density estimates, which supports our results. In the present study, statistically significant differences were found among VBD estimates from these modalities. Specifically, volume-based density estimates from FFDM were generally lower as compared with tridimensional imaging modalities (MR imaging and DBT), which is also in agreement with previous findings (19,21). Results on the comparison of VBD estimates from FFDM and DBT showed moderate to good agreement with PD estimates from FFDM. In the future, research should be focused on which modality yields density estimates that best correlate with risk.
Our study has certain limitations. First, the size of our data set is relatively small (n = 68), with most cases in the medium range of densities (n = 63 in BI-RADS categories II and III). A larger data set with more cases in the lower and higher density categories will be used in future research to approximate the true prevalence of density in the general population (24,34,40). A representative data set from a broader population would allow the translation of our findings into clinical settings. Additionally, to also have access to MR images for comparison, most women in our study population were undergoing high-risk screening or had mammographic findings suspicious for cancer, which may have introduced a selection bias. Prospective recruitment of asymptomatic women for multimodality imaging specifically for the purposes of this study would be ideal. Furthermore, an inherent limitation with comparative analyses of different imaging modalities is the lack of a standard of reference for the estimation of breast density, which makes it difficult to detect systematic errors when using automated tools. Finally, technical limitations of the algorithms, such as inaccuracies in the detection of the chest wall and the breast-air boundary, could affect the performance of 2D- and 3D-based imaging modalities differently, in terms of the estimation of the total breast volume. This, along with the potential bias introduced by blurring artifacts and the limited-angle acquisition in DBT, could explain the higher variance of DBT-based VBD estimates.
In conclusion, there is currently no consensus on whether volume-based or area-based density estimation is best suited for breast cancer risk assessment. Early case-control studies on the comparison of volume-based estimates from screen-film or digital mammograms with area-based estimates demonstrated that PD was a stronger predictor of breast cancer risk (41,42). However, a more recent study showed that volume-based density is a more accurate predictor of breast cancer risk than PD (43). We have developed a fully automated quantitative method for the estimation of VBD from tomosynthesis images and have compared this method with FFDM and MR imaging. This is a potentially important tool to allow reproducible and widely available volume-based density estimation.
Advances in Knowledge
■ Estimates from a quantitative method for fully automated estimation of volumetric breast density (VBD) from digital breast tomosynthesis (DBT) images were compared with estimates from full-field digital mammography (FFDM) and MR imaging and yielded correlations of r = 0.84 (95% confidence interval [CI]: 0.77, 0.91), r = 0.83 (95% CI: 0.74, 0.90), and r = 0.88 (95% CI: 0.92, 0.93) for FFDM versus MR imaging, FFDM versus DBT, and DBT versus MR imaging, respectively (P < .001).
■ FFDM estimates of VBD were lower than those from volumetric imaging modalities with distribution means ± standard deviations of 11.1% ± 7.0, 19.8% ± 16.2, and 16.6% ± 11.2 for FFDM, DBT, and MR imaging, respectively.
Implication for Patient Care
■ Fully automated, quantitative volumetric density estimation from DBT is feasible and may allow for further investigation into the breast cancer risk conferred by increased breast density and its clinical and epidemiological implications.
APPENDIX
SUPPLEMENTAL FIGURES
Received February 3, 2015; revision requested March 17; revision received June 8; accepted June 23; final version accepted August 18.
Current addresses: Escuela de Ingeniería Eléctrica, Electrónica y Telecomunicaciones, Universidad Industrial de Santander, Bucaramanga, Colombia.
Funding: This research was supported by the National Institutes of Health (grants R01 CA161749, R21 CA155906, and 1U54CA163313-01).
Disclosures of Conflicts of Interest: S.P. disclosed no relevant relationships. E.S.M. disclosed no relevant relationships. S.P.W. Activities related to the present article: disclosed no relevant relationships. Activities not related to the present article: author received payment from Siemens for consultancy. Other relationships: disclosed no relevant relationships. E.F.C. Activities related to the present article: disclosed no relevant relationships. Activities not related to the present article: author received personal fees from Hologic for serving on a scientific advisory panel and as a lecturer. Other relationships: disclosed no relevant relationships. D.K. disclosed no relevant relationships.
Abbreviations:
- BI-RADS
- Breast Imaging Reporting and Data System
- CI
- confidence interval
- DBT
- digital breast tomosynthesis
- FFDM
- full-field digital mammography
- PD
- percentage density
- VBD
- volumetric breast density
- 3D
- three-dimensional
- 2D
- two-dimensional
References
- 1.Boyd NF, Guo H, Martin LJ, et al. Mammographic density and the risk and detection of breast cancer. N Engl J Med 2007;356(3):227–236. [DOI] [PubMed] [Google Scholar]
- 2.McCormack VA, dos Santos Silva I. Breast density and parenchymal patterns as markers of breast cancer risk: a meta-analysis. Cancer Epidemiol Biomarkers Prev 2006;15(6):1159–1169. [DOI] [PubMed] [Google Scholar]
- 3.Harvey JA, Yaffe MJ, D’Orsi C, Sickles EA. Density and breast cancer risk. Radiology 2013;267(2):657–658. [DOI] [PubMed] [Google Scholar]
- 4.Price ER, Hargreaves J, Lipson JA, et al. The California breast density information group: a collaborative response to the issues of breast density, breast cancer risk, and breast density notification legislation. Radiology 2013;269(3):887–892. [DOI] [PubMed] [Google Scholar]
- 5.Boyd NF, Martin LJ, Yaffe MJ, Minkin S. Mammographic density and breast cancer risk: current understanding and future prospects. Breast Cancer Res 2011;13(6):223. [DOI] [PMC free article] [PubMed] [Google Scholar]
- 6.Vachon CM, van Gils CH, Sellers TA, et al. Mammographic density, breast cancer risk and risk prediction. Breast Cancer Res 2007;9(6):217. [DOI] [PMC free article] [PubMed] [Google Scholar]
- 7.Siegel R, Ma J, Zou Z, Jemal A. Cancer statistics, 2014. CA Cancer J Clin 2014;64(1):9–29. [DOI] [PubMed] [Google Scholar]
- 8.Pettersson A, Graff RE, Ursin G, et al. Mammographic density phenotypes and risk of breast cancer: a meta-analysis. J Natl Cancer Inst 2014;106(5):dju078. [DOI] [PMC free article] [PubMed] [Google Scholar]
- 9.Darabi H, Czene K, Zhao W, Liu J, Hall P, Humphreys K. Breast cancer risk prediction and individualised screening based on common genetic variation and breast density measurement. Breast Cancer Res 2012;14(1):R25. [DOI] [PMC free article] [PubMed] [Google Scholar]
- 10.Sprague BL, Stout NK, Schechter C, et al. Benefits, harms, and cost-effectiveness of supplemental ultrasonography screening for women with dense breasts. Ann Intern Med 2015;162(3):157–166. [DOI] [PMC free article] [PubMed] [Google Scholar]
- 11.Nicholson BT, LoRusso AP, Smolkin M, Bovbjerg VE, Petroni GR, Harvey JA. Accuracy of assigned BI-RADS breast density category definitions. Acad Radiol 2006;13(9):1143–1149. [DOI] [PubMed] [Google Scholar]
- 12.Redondo A, Comas M, Macià F, et al. Inter- and intraradiologist variability in the BI-RADS assessment and breast density categories for screening mammograms. Br J Radiol 2012;85(1019):1465–1470. [DOI] [PMC free article] [PubMed] [Google Scholar]
- 13.Tice JA, Cummings SR, Ziv E, Kerlikowske K. Mammographic breast density and the Gail model for breast cancer risk prediction in a screening population. Breast Cancer Res Treat 2005;94(2):115–122. [DOI] [PubMed] [Google Scholar]
- 14.Byng JW, Boyd NF, Fishell E, Jong RA, Yaffe MJ. The quantitative analysis of mammographic densities. Phys Med Biol 1994;39(10):1629–1638. [DOI] [PubMed] [Google Scholar]
- 15.Heine JJ, Carston MJ, Scott CG, et al. An automated approach for estimation of breast density. Cancer Epidemiol Biomarkers Prev 2008;17(11):3090–3097. [DOI] [PMC free article] [PubMed] [Google Scholar]
- 16.Keller BM, Nathan DL, Wang Y, et al. Estimation of breast percent density in raw and processed full field digital mammography images via adaptive fuzzy c-means clustering and support vector machine segmentation. Med Phys 2012;39(8):4903–4917. [DOI] [PMC free article] [PubMed] [Google Scholar]
- 17.Wu S, Weinstein SP, Conant EF, Kontos D. Automated fibroglandular tissue segmentation and volumetric density estimation in breast MRI using an atlas-aided fuzzy C-means method. Med Phys 2013;40(12):122302. [DOI] [PMC free article] [PubMed] [Google Scholar]
- 18.Gubern-Mérida A, Kallenberg M, Mann RM, Martí R, Karssemeijer N. Breast segmentation and density estimation in breast MRI: a fully automatic framework. IEEE J Biomed Health Inform 2015;19(1):349–357. [DOI] [PubMed] [Google Scholar]
- 19.Gubern-Mérida A, Kallenberg M, Platel B, Mann RM, Martí R, Karssemeijer N. Volumetric breast density estimation from full-field digital mammograms: a validation study. PLoS One 2014;9(1):e85952. [DOI] [PMC free article] [PubMed] [Google Scholar]
- 20.Alonzo-Proulx O, Packard N, Boone JM, et al. Validation of a method for measuring the volumetric breast density from digital mammograms. Phys Med Biol 2010;55(11):3027–3044. [DOI] [PMC free article] [PubMed] [Google Scholar]
- 21.van Engeland S, Snoeren PR, Huisman H, Boetes C, Karssemeijer N. Volumetric breast density estimation from full-field digital mammograms. IEEE Trans Med Imaging 2006;25(3):273–282. [DOI] [PubMed] [Google Scholar]
- 22.Morrish OW, Tucker L, Black R, Willsher P, Duffy SW, Gilbert FJ. Mammographic breast density: comparison of methods for quantitative evaluation. Radiology 2015;275(2):356–365. [DOI] [PubMed] [Google Scholar]
- 23.Skaane P, Bandos AI, Eben EB, et al. Two-view digital breast tomosynthesis screening with synthetically reconstructed projection images: comparison with digital breast tomosynthesis with full-field digital mammographic images. Radiology 2014;271(3):655–663. [DOI] [PubMed] [Google Scholar]
- 24.Friedewald SM, Rafferty EA, Rose SL, et al. Breast cancer screening using tomosynthesis in combination with digital mammography. JAMA 2014;311(24):2499–2507. [DOI] [PubMed] [Google Scholar]
- 25.McCarthy AM, Kontos D, Synnestvedt M, et al. Screening outcomes following implementation of digital breast tomosynthesis in a general-population screening program. J Natl Cancer Inst 2014;106(11):dju316. [DOI] [PMC free article] [PubMed] [Google Scholar]
- 26.Zuley ML, Guo B, Catullo VJ, et al. Comparison of two-dimensional synthesized mammograms versus original digital mammograms alone and in combination with tomosynthesis images. Radiology 2014;271(3):664–671. [DOI] [PMC free article] [PubMed] [Google Scholar]
- 27.Szeliski R. Computer vision: algorithms and applications. London, England: Springer, 2010. [Google Scholar]
- 28.Pertuz S, Puig D, Garcia MA. Analysis of focus measure operators for shape from focus. Pattern Recognit 2013;46(5):1415–1432. [Google Scholar]
- 29.Bakic PR, Carton AK, Kontos D, Zhang C, Troxel AB, Maidment AD. Breast percent density: estimation on digital mammograms and central tomosynthesis projections. Radiology 2009;252(1):40–49. [DOI] [PMC free article] [PubMed] [Google Scholar]
- 30.Highnam R, Brady M, Yaffe MJ, Karssemeijer N, Harvey J. Robust breast composition measurement—Volpara TM. Digit Mammogr 2010;6136:342–349. [Google Scholar]
- 31.Tagliafico A, Tagliafico G, Astengo D, Airaldi S, Calabrese M, Houssami N. Comparative estimation of percentage breast tissue density for digital mammography, digital breast tomosynthesis, and magnetic resonance imaging. Breast Cancer Res Treat 2013;138(1):311–317. [DOI] [PubMed] [Google Scholar]
- 32.Kopans DB. Basic physics and doubts about relationship between mammographically determined tissue density and breast cancer risk. Radiology 2008;246(2):348–353. [DOI] [PubMed] [Google Scholar]
- 33.Helvie MA. Digital mammography imaging: breast tomosynthesis and advanced applications. Radiol Clin North Am 2010;48(5):917–929. [DOI] [PMC free article] [PubMed] [Google Scholar]
- 34.Conant EF. Clinical implementation of digital breast tomosynthesis. Radiol Clin North Am 2014;52(3):499–518. [DOI] [PMC free article] [PubMed] [Google Scholar]
- 35.Haas BM, Kalra V, Geisel J, Raghu M, Durand M, Philpotts LE. Comparison of tomosynthesis plus digital mammography and digital mammography alone for breast cancer screening. Radiology 2013;269(3):694–700. [DOI] [PubMed] [Google Scholar]
- 36.Niklason LT, Christian BT, Niklason LE, et al. Digital tomosynthesis in breast imaging. Radiology 1997;205(2):399–406. [DOI] [PubMed] [Google Scholar]
- 37.Tagliafico A, Tagliafico G, Houssami N. Differences in breast density assessment using mammography, tomosynthesis and MRI and their implications for practice. Br J Radiol 2013;86(1032):20130528. [DOI] [PMC free article] [PubMed] [Google Scholar]
- 38.Wang J, Azziz A, Fan B, et al. Agreement of mammographic measures of volumetric breast density to MRI. PLoS One 2013;8(12):e81653. [DOI] [PMC free article] [PubMed] [Google Scholar]
- 39.Kontos D, Ying Y, Bakic PR, Conant EF, Maidment AD. A comparative study of volumetric breast density estimation in digital mammography and magnetic resonance imaging: results from a high-risk population. In: Karssemeijer N, Summers RM, eds. Proceedings of SPIE: medical imaging 2010—computer-aided diagnosis. Vol 7624. Bellingham, Wash: International Society for Optics and Photonics, 2010; 762409. [Google Scholar]
- 40.Sprague BL, Gangnon RE, Burt V, et al. Prevalence of mammographically dense breasts in the United States. J Natl Cancer Inst 2014;106(10):dju255. [DOI] [PMC free article] [PubMed] [Google Scholar]
- 41.Ding J, Warren R, Warsi I, et al. Evaluating the effectiveness of using standard mammogram form to predict breast cancer risk: case-control study. Cancer Epidemiol Biomarkers Prev 2008;17(5):1074–1081. [DOI] [PubMed] [Google Scholar]
- 42.Lokate M, Kallenberg MG, Karssemeijer N, Van den Bosch MA, Peeters PH, Van Gils CH. Volumetric breast density from full-field digital mammograms and its association with breast cancer risk factors: a comparison with a threshold method. Cancer Epidemiol Biomarkers Prev 2010;19(12):3096–3105. [DOI] [PubMed] [Google Scholar]
- 43.Shepherd JA, Kerlikowske K, Ma L, et al. Volume of mammographic density and risk of breast cancer. Cancer Epidemiol Biomarkers Prev 2011;20(7):1473–1482. [DOI] [PMC free article] [PubMed] [Google Scholar]
Associated Data
This section collects any data citations, data availability statements, or supplementary materials included in this article.


