

Abstract
2H quadrupolar line shapes deliver rich information about protein dynamics. A newly designed 3D 2H–13C–13C solid-state NMR magic angle spinning (MAS) experiment is presented and demonstrated on the microcrystalline β1 immunoglobulin binding domain of protein G (GB1). The implementation of 2H–13C adiabatic rotor-echo-short-pulse-irradiation cross-polarization (RESPIRATION CP) ensures the accuracy of the extracted line shapes and provides enhanced sensitivity relative to conventional CP methods. The 3D 2H–13C–13C spectrum reveals 2H line shapes for 140 resolved aliphatic deuterium sites. Motional-averaged 2H quadrupolar parameters obtained from the line-shape fitting identify side-chain motions. Restricted side-chain dynamics are observed for a number of polar residues including K13, D22, E27, K31, D36, N37, D46, D47, K50, and E56, which we attribute to the effects of salt bridges and hydrogen bonds. In contrast, we observe significantly enhanced side-chain flexibility for Q2, K4, K10, E15, E19, N35, N40, and E42, due to solvent exposure and low packing density. T11, T16, and T17 side chains exhibit motions with larger amplitudes than other Thr residues due to solvent interactions. The side chains of L5, V54, and V29 are highly rigid because they are packed in the core of the protein. High correlations were demonstrated between GB1 side-chain dynamics and its biological function. Large-amplitude side-chain motions are observed for regions contacting and interacting with immunoglobulin G (IgG). In contrast, rigid side chains are primarily found for residues in the structural core of the protein that are absent from protein binding and interactions.
Introduction
Protein dynamics plays critical roles in biological functions such as enzyme catalysis, ligand binding, and signal transduction.1,2 It has drawn increasing research attention in recent studies, as protein structures alone do not fully explain biological activities. X-ray diffraction (XRD) and nuclear magnetic resonance (NMR) are the premier methods to determine protein conformation. XRD reports primarily on structure, and the protein flexibility is only indirectly reflected in B-factors. Therefore, it is problematic to address protein dynamics solely from B-factors, which also are affected by crystal packing defects, whole-body motions and refinement artifacts.3,4 Further, B-factors are insensitive to reorientation motions and are unable to distinguish motions covering different time scales.3,4 Protein dynamics can be elucidated by NMR5−11 along with several other techniques, including MD simulations,12,13 fluorescence spectroscopy,14,15 and electron paramagnetic resonance (EPR).16,17 NMR is the premier technique for probing motions in proteins and widely implemented to investigate protein mobility at the atomic level.5,7,11 Well-developed methods in solution-state NMR include spin relaxation (R1, R2, and R1ρ),18−21 Carr–Purcell–Meiboom–Gill (CPMG) relaxation dispersion,22−24 residual dipolar couplings (RDCs),25,26 hydrogen–deuterium exchange,27 and deuterium relaxation.28 These measurements capture motions with time scales from picoseconds to seconds,10,11,29−32 which substantially expand our understanding of protein structure and dynamics. For example, a recent study successfully quantified side-chain χ1 distributions by RDCs for the third domain of protein G.33 Slow molecular tumbling leads to poor spectral resolution and sensitivity, which hinder the application of solution-state NMR to large proteins. In addition, chemical shift anisotropy (CSA), dipolar coupling, and quadrupolar coupling line shapes convey rich information on site-specific motional modes and rates.7,34−36 These anisotropic interactions are extensively averaged by isotropic Brownian tumbling motions in solution. In contrast, in solid-state NMR, the anisotropic line shapes are retrieved and can be detected accurately to illustrate dynamics of chemical groups in a protein. Similar to solution-state NMR, spin relaxation is routinely implemented in solid-state NMR for investigating dynamics.7,8,37−40 For example, a recent study determined 13 sets of bulk NMR relaxation times for the β1 immunoglobulin binding domain of protein G (GB1) microcrystals at various temperatures.41 The results explored the hierarchical distribution of backbone and side-chain motions as well as protein–solvent motion coupling for microcrystalline GB1 over the temperature window of 105–280 K. Recent studies showed that the CPMG relaxation dispersion approach was applicable in the solid state.42 These solid-state NMR developments paved the way for the elucidation of dynamics in large proteins and especially benefit the study of membrane proteins. Further, high similarity was shown for picosecond to submicrosecond dynamics elucidated by solid-state and solution-state NMR for SH3 and ubiquitin, implying the validation of extrapolating solid-state dynamics information to proteins in their native states.43−45
Extensive effort has been devoted to develop solid-state NMR pulse sequences for dynamics detection by utilizing dipole–dipole, CSA, and quadrupolar interactions. For example, studies managed to determine order parameters from scaled 1H–13C dipolar couplings measured using homonuclear coupling attenuation pulse schemes such as T-MREV,46 phase-modulated Lee–Goldberg irradiation,47 rotational-echo double resonance (REDOR),48−51 cross polarization combined with phase inversion (CPPI),52,53 and symmetry-based pulse sequences.54 Moreover, the use of these dipolar recoupling techniques in solid-state NMR has enabled the elucidation of dynamics for a number of proteins.55−60 The most commonly used quadrupolar nuclei in biological studies is deuterium, which can be enriched by replacing protons without altering critical chemical and physical properties of the systems. In comparison with the dipolar interaction and CSA, the 2H quadrupolar coupling constant (CQ) is significantly larger (∼200 kHz), which gives rise to opportunities to study dynamics as well as several spectroscopic challenges. The large amplitude of the 2H CQ enables much more accurate measurements than those of the dipolar coupling or CSA.61−65 Currently, however, the ability to quantitatively evaluate protein dynamics is partially complicated by the absence of a complete understanding of rigid-limit quadrupolar tensor values (addressed in the following section). 2H line shape and relaxation time together enable the characterization of protein dynamics covering time scales from picoseconds to seconds.66−68 On the other hand, limitations of NMR hardware and pulse sequences impede the application of 2H CQ measurements in large proteins or other macromolecules. Solid-state NMR probes enabling high power irradiation of 2H, simultaneously with 1H and 13C and/or 15N, combined with high magic angle spinning (MAS) rates, allow the efficient excitation and detection of 2H signals in a site-specific fashion with multidimensional NMR. Cross-polarization (CP)69,70 is one of the most common pulse elements exploited to transfer magnetization in multidimensional solid-state NMR. Several recent studies implemented 2H–13C tangent CP transfers in two-/three-dimensional (2D/3D) experiments to indirectly detect 2H quadrupolar line shapes and spin–lattice (T1) relaxation times to probe dynamics of NAV,71 amino acids,72 SH3 protein,73 and silk proteins.74,75 As pointed out in previous studies and observed in the current work, conventional 2H–13C CP schemes lead to nonuniform magnetization transfer across the broad 2H powder pattern.72 The optimal CP condition providing accurate 2H line shape covers an extraordinarily narrow rf band (<1 kHz) and is sensitive to 2H CQ.72 Thus, it is challenging to measure quadrupolar parameters accurately for sites with different CQ values using one particular CP condition. This impedes the utilization of conventional 2H–13C CP in multidimensional NMR to extract 2H quadrupolar information for proteins as the range of motional averaged CQ is up to ∼185 kHz.
A recently invented polarization transfer pulse scheme, rotor-echo-short-pulse-irradiation (RESPIRATION) CP,76−79 shows the potential to overcome the nonuniformity of magnetization transfer observed in conventional CP. This approach provides significantly enhanced efficiency for 13C–15N, 1H–15N, as well as 2H–13C CP and is more tolerant to the variation of experimental conditions such as rf mismatching, probe detuning, and spinning instability.78 Later studies demonstrated that adiabatic RESPIRATION CP further improves the performance even using very low rf field strengths.77,79 These studies primarily focused on the CP efficiency enhancement illustrated by numerical simulations and experimental data. The observed broad 2H–13C CP matching profile in adiabatic RESPIRATION CP implies that an optimal CP condition concurrently satisfies chemical groups with different CQ’s, namely, allowing accurate measurement of quadrupolar coupling parameters for all sites in complicated systems like perdeuterated proteins.
In the present work, the adiabatic RESPIRATION CP element is implemented
in a 3D 2H–13C–13C
solid-state NMR experiment to elucidate site-specific protein backbone
and side-chain dynamics. We show with crystalline Ala that superior 2H–13C magnetization transfer uniformity
is observed using adiabatic RESPIRATION CP transfer. SPC-580,81 is employed in the 3D experiment to build 13C–13C correlations in order to resolve 2H sites. In
comparison with commonly used multidimensional experiments that measure 1H–13C/15N dipolar coupling constants,
the presented 3D 2H–13C–13C approach has several advantages for dynamics detection. First,
the resulting 2H powder patterns are on the order of 100
kHz, which is significantly larger than 1H–13C/15N dipolar spectra covering less than ∼23
kHz. Thus, the current 3D 2H–13C–13C method is less prone to measurement error. Second, dipolar
measurements have higher demands on experimental conditions including
spinning rates and recoupling pulses in order to efficiently suppress
homonuclear dipolar couplings and reintroduce heteronuclear dipolar
couplings under MAS. In contrast, the 3D 2H–13C–13C experiment is more robust because
the accuracy of the obtained 2H spectra solely depends
on the 2H–13C CP step and is ensured
by the use of the adiabatic RESPIRATION CP. The third benefit of the
3D 2H–13C–13C approach
is that it offers improved spectral resolution through using samples
which are typically fully deuterated, relative to dipolar measurements
requiring protonated samples. However, one drawback to 2H NMR is that the current understanding of rigid-limit CQ values for proteins is incomplete, consequently impeding
the ability to access quantitative dynamics information. Specifically,
due to a general lack of systematic studies, the variation of quadrupolar
rigid-limit CQ values for deuterium bonded
to sp3-hybridized carbon has not been fully evaluated for
proteins. To assist quantification of protein side-chain motions using 2H relaxation times, two recent solution-state NMR studies
indirectly determined the rigid-limit CQ values for CD3 in the N-terminal drk SH3 domain82 as well as CαDα
in both ubiquitin and GB1 proteins.83 The
methyl deuterium rigid-limit CQ values
were found to be approximately uniform, at 167 ± 1.5 kHz.822Hα rigid-limit CQ values were determined to be 174 kHz on average with
6–8% uncertainty which the authors attribute to possible measurement
uncertainties rather than actual CQ variation.83 Together, these two studies suggest that the
rigid-limit CQ values for deuterium at
methyl and Cα sites in a protein are likely uniform. It is worth
noting that the quantification of rigid-limit CQ values in these studies may be associated with nontrivial
uncertainties resulting from a number of factors.82,83 To date, the rigid-limit CQ values for
deuterium at sites other than methyl and Cα sites have not been
systematically evaluated for proteins. The inherent variation of deuterium
quadrupolar interactions in the rigid lattice requires further investigation
in order to guide the 2H solution-state and solid-state
NMR dynamics studies for proteins. For example, one straightforward
approach to obtain the rigid-limit CQ values
is by the measurement of 2H line shapes for proteins with
multidimensional MAS solid-state NMR at ultralow temperatures where
the motions are quenched, which can be performed with the state-of-the-art
NMR instrumentation and is an interesting topic for future studies.
In this paper, we focus on the comparison of motionally averaged quadrupolar
coupling constant ( ) values for side chains of microcrystalline
protein GB1 to gain dynamics information. Because of the lack of the
quantitative rigid-limit CQ values and
the complexity brought by the nonzero motional averaged asymmetry
parameters (η̅), we interpret the data by comparing
) values for side chains of microcrystalline
protein GB1 to gain dynamics information. Because of the lack of the
quantitative rigid-limit CQ values and
the complexity brought by the nonzero motional averaged asymmetry
parameters (η̅), we interpret the data by comparing  values instead of using generalized order
parameters. Such comparisons are performed between the same chemical
groups of the same type of residues to minimize uncertainties originating
from the potential rigid-limit CQ differences.
This semiquantitative analysis provides critical insights into protein
dynamics, especially those of side chains, which have not been systematically
studied in detail.
values instead of using generalized order
parameters. Such comparisons are performed between the same chemical
groups of the same type of residues to minimize uncertainties originating
from the potential rigid-limit CQ differences.
This semiquantitative analysis provides critical insights into protein
dynamics, especially those of side chains, which have not been systematically
studied in detail.
In this study, we demonstrate the 3D 2H–13C–13C experiment on
microcrystalline GB1,
in order to extract 2H quadrupolar information for each
chemical group. The obtained  and η̅ elucidate the backbone
and side-chain motions for the majority of residues in a site-specific
manner. To our knowledge, this is the first example in which the backbone
and side-chain dynamic network is fully mapped based on 2H quadrupolar coupling parameters extracted from a single solid-state
NMR experiment. The results illustrate that side-chain dynamics of
GB1 highly correlate with its structure stability and biological functions.
We envisage that this approach will be widely applicable to investigate
backbone and side-chain motions in various biological systems such
as protein microcrystals/nanocrystals, insoluble fibrils, and membrane
proteins.
and η̅ elucidate the backbone
and side-chain motions for the majority of residues in a site-specific
manner. To our knowledge, this is the first example in which the backbone
and side-chain dynamic network is fully mapped based on 2H quadrupolar coupling parameters extracted from a single solid-state
NMR experiment. The results illustrate that side-chain dynamics of
GB1 highly correlate with its structure stability and biological functions.
We envisage that this approach will be widely applicable to investigate
backbone and side-chain motions in various biological systems such
as protein microcrystals/nanocrystals, insoluble fibrils, and membrane
proteins.
Materials and Methods
Preparation of Protein GB1
Uniformly labeled 2H,13C,15N-GB1 was expressed in E. coli BL12(DE3) using a previously published protocol.84 The protein solution was buffer exchanged against 90/10 D2O/H2O to replace 10% of the exchangeable deuterons with protons and then was concentrated to 25 mg/mL and precipitated with 3.0 equiv of 2-methyl-2,4-pentanediol (MPD) and isopropanol (IPA) solution (2:1 MPD/IPA volume ratio).84 Microcrystalline GB1 was packed into a 1.6 mm standard wall FastMAS rotor (Agilent Technologies Inc.) for use in solid-state NMR experiments.
Solid-State NMR Experiments
Data were collected on a customized 500 MHz Varian VNMRS DirectDrive spectrometer equipped with actively biased transmit–receive circuits and a 1.6 mm FastMAS quadruple resonance 1H–13C–2H–15N probe. A 22.222 kHz MAS was chosen as a compromise between peak sensitivity and the number of sidebands present from the 2H manifold. The variable temperature was 0 °C, and the actual sample temperature was 3 °C because of frictional heating induced by MAS (as determined by an ethylene glycol calibration85). The 3D 2H–13C–13C solid-state NMR pulse sequence is displayed in Figure 1A and will be discussed in detail in the following section. The 1H, 13C, 2H, and 15N π/2 pulse widths were 1.5, 1.6, 2.9, and 4.5 μs, respectively. In experiments performed on GB1, 86 kHz 2H and 100 kHz 13C spin-lock rf field strengths and a 900 μs contact time were used for adiabatic RESPIRATION CP magnetization transfer. The rotor-synchronized adiabatic RESPIRATION CP waveform was defined by the following optimized parameters: Δ = 4000 rad/s and b = 5000/2π Hz and RESPIRATION pulse τp = 1.8 μs (see Jain et al. for parameter definition79). The SPC-5 homonuclear recoupling scheme80,81 was implemented to build 13C–13C correlations with a 1.086 ms mixing time. Additional experimental parameters include a 100 ms recycle delay, 400 kHz 2H sweep width, 22.222 kHz and 50 kHz 13C sweep width for the second and third dimension, 192 t1 increment points, 160 t2 increment points, and a 20.48 ms acquisition time. Low-power 1H XiX86 and 15N WALTZ87 decoupling was employed during the pulse periods as indicated in Figure 1A. Data were processed in nmrPipe88 and analyzed in Sparky (T. D. Goddard and D. G. Kneller, University of California, San Francisco). 2H MAS line shapes were extracted from the 3D 2H–13C–13C correlation experiment and fitted in DMFit.89
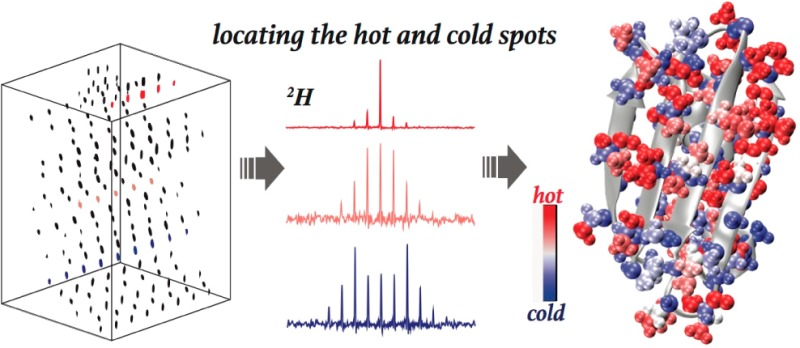
Figure 1.

(A) 3D 2H–13C–13C solid-state MAS NMR pulse sequence. (B) 2D 2H–13C planes of the 3D 2H–13C–13C spectrum collected for microcrystalline GB1 and the extracted 2H line shapes for the E56 residue. Experimental line shapes (black), fits (red), and fitting residuals (blue) are displayed in the right column. In the 2D planes, signals with positive and negative intensities are shown in black and green, respectively.
Results and Discussion
2H–13C Adiabatic RESPIRATION CP Enabling Accurate Indirect Detection of 2H Line Shapes
Figure 1A shows the 3D 2H–13C–13C NMR pulse sequence that was used for detecting 2H quadrupolar line shapes. The initial excited 2H magnetization was transferred to the directly bonded 13C and detected through 13C–13C correlation. One critical element is the CP transfer that dictates the accuracy of the extracted 2H line shapes and the sensitivity of the experiment. Conventional tangent CP was previously employed in 2D 2H–13C experiments to establish heteronuclear correlation in order to extract 2H line shapes for peptides and proteins.71−75 One drawback of the approach is that polarization transfer efficiency is not uniform across 2H MAS manifolds.72 Thus, an optimal CP condition providing accurate 2H line shape is valid only for sites with a particular CQ. It is unfeasible to use conventional CP to accurately determine 2H line shapes for all sites of a system, particularly in a protein where deuterium CQ values span ∼185 kHz range. A newly invented polarization transfer scheme, the so-called adiabatic RESPIRATION CP,77−79 shows the capability to overcome this issue. Motivated by the better performance of this CP scheme over conventional methods, in this section, we focus on evaluating the cross-polarization uniformity that was not previously discussed in detail.
2H–13C adiabatic
RESPIRATION CP was first performed on Ala crystalline powder using
a pulse sequence displayed in Figure S1A. The rf field strength matching condition profiles were presented
in Figure S1B. Polarization efficiency
at the optimal condition is enhanced by a factor of 2.4 and 1.8 for
Ala methine and methyl groups, respectively, in adiabatic RESPIRATION
CP compared with conventional tangent CP. The significantly broader
plateau of matching condition observed in the former case illustrates
that polarization transfer is less sensitive to CP rf field strength
variation (Figure S1B). As shown in a previous
study, in a 2D experiment with conventional tangent 2H–13C CP, no CP condition provides accurate 2H line
shapes for both of the Ala aliphatic groups concurrently.72 In other words, the CP condition yielding an
optimal 2H line shape for one Ala group fails to provide
similar CP efficiency for other sites. This arises from the fact that
magnetization transfer is nonuniform across the 2H powder
pattern in the conventional CP approach. To evaluate the situation
in adiabatic RESPIRATION CP, 2D 2H–13C correlation experiments were performed with various CP conditions.
As presented in Figures S2 and S3, Ala 2H quadrupolar parameters extracted from 2D 2H–13C adiabatic RESPIRATION CP experiments remain consistent
over a wide range of 2H CP rf carrier frequency offsets.
Further, these values agree very well with the quadrupolar parameters
obtained from the 2H one-pulse excitation experiment (Figures S2 and S4). Table S1 shows  values of Ala 2Hα and 2Hβ extracted
from 2D experiments utilizing 13C CP rf field strengths
varying between 22 and 77 kHz with the matching 2H rf condition.
The differences among the
values of Ala 2Hα and 2Hβ extracted
from 2D experiments utilizing 13C CP rf field strengths
varying between 22 and 77 kHz with the matching 2H rf condition.
The differences among the  values obtained at various CP conditions
are negligible, and the values agree with literature reports for the
two Ala aliphatic groups. These results demonstrate that adiabatic
RESPIRATION CP fulfills CP transfer uniformity over the 2H powder pattern. Further, it implies that the CP condition providing
accurate 2H line shapes is insensitive to rf strengths.
This performance is much improved in comparison with tangent CP, where
1 kHz rf strength variation can easily lead to 10% or more
values obtained at various CP conditions
are negligible, and the values agree with literature reports for the
two Ala aliphatic groups. These results demonstrate that adiabatic
RESPIRATION CP fulfills CP transfer uniformity over the 2H powder pattern. Further, it implies that the CP condition providing
accurate 2H line shapes is insensitive to rf strengths.
This performance is much improved in comparison with tangent CP, where
1 kHz rf strength variation can easily lead to 10% or more  difference, as observed in the current
work and the previous study.72 To summarize,
utilizing adiabatic RESPIRATION CP for the 2H–13C correlation step in multidimensional experiments to indirectly
extract 2H line shapes provides the following advantages.
First, 2H–13C CP efficiency is greatly
enhanced. Second, CP transfer is uniform across the 2H
powder pattern, ensuring the accuracy of the indirectly extracted 2H line shapes. Third, both CP efficiency and uniformity are
much less sensitive to CP condition variation that allows for stable
data collection of 3D/4D solid-state NMR spectra. These three features
are essential for detecting site-specific deuterium quadrupolar information
for proteins possessing deuterium CQ values
typically covering the range of 0 to ∼185 kHz.
difference, as observed in the current
work and the previous study.72 To summarize,
utilizing adiabatic RESPIRATION CP for the 2H–13C correlation step in multidimensional experiments to indirectly
extract 2H line shapes provides the following advantages.
First, 2H–13C CP efficiency is greatly
enhanced. Second, CP transfer is uniform across the 2H
powder pattern, ensuring the accuracy of the indirectly extracted 2H line shapes. Third, both CP efficiency and uniformity are
much less sensitive to CP condition variation that allows for stable
data collection of 3D/4D solid-state NMR spectra. These three features
are essential for detecting site-specific deuterium quadrupolar information
for proteins possessing deuterium CQ values
typically covering the range of 0 to ∼185 kHz.
3D 2H–13C–13C NMR Correlation Experiment Designed for Studying Protein Backbone and Side-Chain Dynamics
A 3D solid-state MAS NMR experiment
utilizing adiabatic RESPIRATION CP and SPC-5 homonuclear recoupling
to achieve 2H–13C and 13C–13C correlation, respectively, was designed in order to extract
site-specific 2H line shapes for large systems like proteins
(Figure 1A). The pulse
sequence allows 2H resonances to be resolved with the assistance
of 13C–13C correlation and the accurate
line shapes to be extracted from the first indirect dimension. Figure 1B displays 2D planes
of the 3D spectrum collected for microcrystalline GB1, where 2H line shapes are extracted for the aliphatic groups of E56.
The motional averaged 2H quadrupolar parameters are readily
obtained from line-shape fitting. 2H line shapes were extracted
from the 3D spectrum for the majority of aliphatic groups, except
those subject to resonance overlap or signal absence and aromatic
rings exhibiting inefficient CP. Line-shape fitting was performed
to extract motional averaged quadrupolar parameters,  and η̅, for 140 chemical groups
in GB1, and the fitting results are presented in Figure S5. The obtained 2H quadrupolar parameters
convey rich information about protein dynamics that correlate with
structure, local chemical environment, salt bridges, hydrogen bonds,
and other interactions. To our knowledge, this is the first example
that 2H motional averaged quadrupolar parameters have been
determined for most sites in a protein. In the following section,
discussion will first focus on the side-chain motions and then on
the backbone flexibility for microcrystalline GB1.
and η̅, for 140 chemical groups
in GB1, and the fitting results are presented in Figure S5. The obtained 2H quadrupolar parameters
convey rich information about protein dynamics that correlate with
structure, local chemical environment, salt bridges, hydrogen bonds,
and other interactions. To our knowledge, this is the first example
that 2H motional averaged quadrupolar parameters have been
determined for most sites in a protein. In the following section,
discussion will first focus on the side-chain motions and then on
the backbone flexibility for microcrystalline GB1.
Lys Side-Chain Dynamics in GB1
2H line shapes
for aliphatic groups of Lys were extracted from the 3D 2H–13C–13C spectrum. Table 1 shows  and η̅ values for Lys aliphatic
groups in microcrystalline GB1. The values present a large difference
between 2Hα and side-chain 2H as well
as among Lys residues, indicating various backbone and side-chain
motions.
and η̅ values for Lys aliphatic
groups in microcrystalline GB1. The values present a large difference
between 2Hα and side-chain 2H as well
as among Lys residues, indicating various backbone and side-chain
motions.  and η̅ contain detailed information
about the motional process, requiring analysis on a case-by-case basis
depending on the physical property of a chemical group. For example,
the line shape of K28 2Hβ gives a
and η̅ contain detailed information
about the motional process, requiring analysis on a case-by-case basis
depending on the physical property of a chemical group. For example,
the line shape of K28 2Hβ gives a  of 125.4 ± 1.8 kHz and a η̅
of 0.60 ± 0.05. If a reorientation in the fast-motion regime
between two sites with equal population is assumed for the K28 (CH2) β group, the reorientation angle satisfies cos θ
= 0.5, which is derived from the experimental η̅. Thus,
a
of 125.4 ± 1.8 kHz and a η̅
of 0.60 ± 0.05. If a reorientation in the fast-motion regime
between two sites with equal population is assumed for the K28 (CH2) β group, the reorientation angle satisfies cos θ
= 0.5, which is derived from the experimental η̅. Thus,
a  of 125.4 kHz corresponds to a CQ(rigid
limit) equal to 200.6 kHz. This large CQ(rigid-limit) value is physically impossible
for a deuteron bonded with an sp3-hybrized carbon.64 It infers that the K28 (CH2)β
group exhibits more complex dynamics than a simple two-site reorientation,
resulting from the combined effect of Cα–Cβ and
Cβ–Cγ librations; yet, the motional details involved
in this effect are beyond the scope of the current study. Here, the
focus is put on the evaluation of the
of 125.4 kHz corresponds to a CQ(rigid
limit) equal to 200.6 kHz. This large CQ(rigid-limit) value is physically impossible
for a deuteron bonded with an sp3-hybrized carbon.64 It infers that the K28 (CH2)β
group exhibits more complex dynamics than a simple two-site reorientation,
resulting from the combined effect of Cα–Cβ and
Cβ–Cγ librations; yet, the motional details involved
in this effect are beyond the scope of the current study. Here, the
focus is put on the evaluation of the  that is proportional to order parameter
derived from
that is proportional to order parameter
derived from  /CQ(rigid-limit).
It is rational to illustrate mobility by comparing
/CQ(rigid-limit).
It is rational to illustrate mobility by comparing  values of amino acid aliphatic groups in
a protein, even though they do not provide motional details.
values of amino acid aliphatic groups in
a protein, even though they do not provide motional details.
Table 1. 2H  and η̅ Values Determined for
Lys Aliphatic Sites in Microcrystalline GB1a.
and η̅ Values Determined for
Lys Aliphatic Sites in Microcrystalline GB1a.

For deuterium undergoing large-amplitude motion, η̅ was set to zero for line-shape fitting.
The 13Cγ–13Cδ and 13Cδ−13Cξ cross peaks of K4 severely overlap with those of K10. The same 2Hδ and 2Hξ quadrupolar values were assigned to K4 and K10, which were obtained from the overlapped 2H line shapes.
The GB1 crystal structure is displayed in Figure 2A with Lys residues shown in
van der Waals
spheres color coded by  values. The observed large
  variation indicates that molecular dynamics
differ significantly among Lys residues in protein GB1.
variation indicates that molecular dynamics
differ significantly among Lys residues in protein GB1.  values listed in Table 1 show that the K50 side chain exhibits much
more restricted movement than other Lys residues. The flexibility
of the amino acid backbone and side chain depends upon the local packing
density, salt bridges, hydrogen bonds, and solvent accessibility and
can in turn validate these phenomena. The detail of the local structure
for K50 is shown in Figure 2B. This residue is in the turn connecting β3 and is
exposed to the bulk solvent with more potential for interacting with
water molecules (31 water molecules ≤10 Å away from its
side chain based upon PDB: 2QMT(90)). It suggests that a
very dynamic side chain is expected for K50 that is controversial
to the experimental observation. The motion of the K50 side chain
is likely restricted by a stable salt bridge formed between K50 (NH3)ζ+ and D47 Oγ with a N–O distance
of 3.07 Å (PDB: 2QMT(90)). Five out of ten solid-state NMR energy
minimum structures (PDB: 2LGI(91)) show that the formation
of this salt bridge is allowed where the two groups are 2.73–3.09
Å apart. The existence of a stable salt bridge indicated by the
rigid K50 side chain can be used to evaluate the validity of a protein
structure model. Similarly, K31 and K13 exhibit moderate side-chain
dynamics among the five Lys in GB1, as implied by the
values listed in Table 1 show that the K50 side chain exhibits much
more restricted movement than other Lys residues. The flexibility
of the amino acid backbone and side chain depends upon the local packing
density, salt bridges, hydrogen bonds, and solvent accessibility and
can in turn validate these phenomena. The detail of the local structure
for K50 is shown in Figure 2B. This residue is in the turn connecting β3 and is
exposed to the bulk solvent with more potential for interacting with
water molecules (31 water molecules ≤10 Å away from its
side chain based upon PDB: 2QMT(90)). It suggests that a
very dynamic side chain is expected for K50 that is controversial
to the experimental observation. The motion of the K50 side chain
is likely restricted by a stable salt bridge formed between K50 (NH3)ζ+ and D47 Oγ with a N–O distance
of 3.07 Å (PDB: 2QMT(90)). Five out of ten solid-state NMR energy
minimum structures (PDB: 2LGI(91)) show that the formation
of this salt bridge is allowed where the two groups are 2.73–3.09
Å apart. The existence of a stable salt bridge indicated by the
rigid K50 side chain can be used to evaluate the validity of a protein
structure model. Similarly, K31 and K13 exhibit moderate side-chain
dynamics among the five Lys in GB1, as implied by the  values. A salt bridge built between K31
(NH3)ζ+ and E27 Oε appears to be
the reason for restricted K31 side-chain motion (Figure 2C). The O–N distance
is 2.76 Å in the XRD structure (PDB: 2QMT(90)) and ≤4
Å (3.49–3.78 Å) in seven of the ten solid-state NMR
minimum energy structures (PDB: 2LGI(91)), allowing
the formation of a salt bridge. The
values. A salt bridge built between K31
(NH3)ζ+ and E27 Oε appears to be
the reason for restricted K31 side-chain motion (Figure 2C). The O–N distance
is 2.76 Å in the XRD structure (PDB: 2QMT(90)) and ≤4
Å (3.49–3.78 Å) in seven of the ten solid-state NMR
minimum energy structures (PDB: 2LGI(91)), allowing
the formation of a salt bridge. The  values of K13 side-chain deuterium are
very similar to those of K31. The solvent-exposure feature of K13
dictates that its side chain likely displays a large degree of mobility
(Figure 2D); however,
this expectation does not agree with the determined
values of K13 side-chain deuterium are
very similar to those of K31. The solvent-exposure feature of K13
dictates that its side chain likely displays a large degree of mobility
(Figure 2D); however,
this expectation does not agree with the determined  values. Thus, the mobility must be quenched
by a salt bridge and/or a hydrogen bond. The local chemical environment
suggests that no nearby negatively charged groups are available for
forming a salt bridge with K13 side-chain amide group (Figure 2D). Upon the basis of the NMR
(PDB: 2LGI(91)) and XRD (PDB: 2QMT(90)) structures,
a hydrogen bond is likely formed between K13 (NH3)ζ+ and the G9 backbone CO groups with the O–N distance
<2.5 Å (2.73 Å in XRD structure) and the O–H–N
angle in the range of 122–128°. In addition, the N8 side-chain
CO group serves as another potential acceptor for a hydrogen bond
formed with K13 (NH3)ζ+ as indicated in
the XRD structure and one of the ten NMR minimum energy structures.
These hydrogen bonds overcome the desolvation energy barrier for K13
and are responsible for rigidifying its side chain. Much more dynamic
side chains are observed for K4, K10, and K28. The three residues
are completely extended into the solvent and have no neighboring electron
acceptors available to form a stable hydrogen bond or a salt bridge
(Figure 2E–G).
It is noted that a salt bridge could be formed between K4 and E15
side chains based on the distance (3.17 Å) shown in the XRD structure
(2QMT90). In addition, two intermolecular salt bridges,
K4–E42 (4.81 Å) and K10–D40 (4.95 Å), exist
in the X-ray crystal structure (2QMT90). The presence
of these salt bridges seems inconsistent with the large-amplitude
side-chain motions observed for K4 and K10. It is likely that the
salt bridges are dynamic and are undergoing continual breaking and
reformation. Alternatively, it is possible that these salt bridges
are absent in the structure of the currently studied GB1 sample, which
was prepared with crystallization conditions subtly different from
the X-ray study.
values. Thus, the mobility must be quenched
by a salt bridge and/or a hydrogen bond. The local chemical environment
suggests that no nearby negatively charged groups are available for
forming a salt bridge with K13 side-chain amide group (Figure 2D). Upon the basis of the NMR
(PDB: 2LGI(91)) and XRD (PDB: 2QMT(90)) structures,
a hydrogen bond is likely formed between K13 (NH3)ζ+ and the G9 backbone CO groups with the O–N distance
<2.5 Å (2.73 Å in XRD structure) and the O–H–N
angle in the range of 122–128°. In addition, the N8 side-chain
CO group serves as another potential acceptor for a hydrogen bond
formed with K13 (NH3)ζ+ as indicated in
the XRD structure and one of the ten NMR minimum energy structures.
These hydrogen bonds overcome the desolvation energy barrier for K13
and are responsible for rigidifying its side chain. Much more dynamic
side chains are observed for K4, K10, and K28. The three residues
are completely extended into the solvent and have no neighboring electron
acceptors available to form a stable hydrogen bond or a salt bridge
(Figure 2E–G).
It is noted that a salt bridge could be formed between K4 and E15
side chains based on the distance (3.17 Å) shown in the XRD structure
(2QMT90). In addition, two intermolecular salt bridges,
K4–E42 (4.81 Å) and K10–D40 (4.95 Å), exist
in the X-ray crystal structure (2QMT90). The presence
of these salt bridges seems inconsistent with the large-amplitude
side-chain motions observed for K4 and K10. It is likely that the
salt bridges are dynamic and are undergoing continual breaking and
reformation. Alternatively, it is possible that these salt bridges
are absent in the structure of the currently studied GB1 sample, which
was prepared with crystallization conditions subtly different from
the X-ray study.
Figure 2.

(A) Crystal
structure of GB1 (PDB: 2LGI) with Lys aliphatic groups shown in van
der Waals spheres and coded with color scaling to  values. Two different perspectives are
shown for better visualization. (B) K50, (C) K31, (D) K13, (E) K4,
(F) K10, and (G) K28 local chemical environment in GB1. The K31 (CH2)β group is color coded with cyan as the
values. Two different perspectives are
shown for better visualization. (B) K50, (C) K31, (D) K13, (E) K4,
(F) K10, and (G) K28 local chemical environment in GB1. The K31 (CH2)β group is color coded with cyan as the  value is not determined. The residues having
atoms within 5 Å away for the corresponding Lys residue are shown
in sticks. The salt bridges between K50 and D47, E27, and K31 and
the hydrogen bond between K13 side chain NH3 and G9 backbone
CO are displayed by dash lines.
value is not determined. The residues having
atoms within 5 Å away for the corresponding Lys residue are shown
in sticks. The salt bridges between K50 and D47, E27, and K31 and
the hydrogen bond between K13 side chain NH3 and G9 backbone
CO are displayed by dash lines.
Asp and Asn Side-Chain Dynamics in GB1
Motional averaged
deuterium quadrupolar coupling constants and asymmetry parameters
for Asp and Asn residues are listed in Table 2. Considerable variation is observed for
the backbone 2Hα and side-chain 2Hβ
(Figure 3A). In general,
the large  values indicate that Asp/Asn local backbones
exhibit restricted motions. The side chains are less flexible than
those of Lys residues due to the shorter side chains possessing more
limited spatial extension. It is shown that the side-chain dynamics
are likely further quenched by hydrogen bonds, salt bridges, and desolvation
for D22, D36, N37, D46, and D47. As discussed above, D47 (COO)− forms a stable salt bridge with K50 (NH3)ζ+, resulting in the stiffness of side chains for
both residues (Figure 3B). Upon the basis of the chemical environment of D22 (Figure 3C), a strong hydrogen bond
likely established between the D22 side chain COO– group with T25 backbone NH, where the O–N and O–H–N
angles are in the range of 1.77–2.02 Å and 138–142°,
respectively. Thus, the hydrogen bond contributes to the restricted
side-chain motion of D22. Further, it presumes that this strong hydrogen
bond formed between the loop and the α helix contributes to
the structural stability of GB1. Figure 3D shows the local environment of D46. It
infers that the rigid side-chain motion of D46 is due to the hydrogen
bonds between COO– and the A48 backbone NH with
an O–N distance of 2.66–2.71 Å and an O–H–N
angle of 138–143° according to the solid-state NMR structure
(PDB: 2LGI(91)). The T49 NH is another possible electron donor
involved in forming a hydrogen bond, which is weaker as the O–N
distance is 3.33–3.43 Å and the O–H–N angle
is 144–148°. The validity of the hydrogen bonding is further
supported by the absence of a competing electron acceptor for D46.
It is noted that the O–N distance for the two hydrogen bonds
is larger based upon the XRD structure (PDB: 2QMT(90)), 3.11 and 4.13 Å, most likely due to minor structural
variation between the solid-state NMR and XRD structures originating
from subtle sample preparation differences. The inflexible D36 (CH2)β group is contradictory to its solvent exposure and
the lack of hydrogen bonds and a salt bridge (Figure 3E). The possible explanation is that D36
packs close to itself in the crystal lattice, deactivating the side-chain
motions. This tight packing is also found to be responsible for its
COO– pKa value being
higher than expected.92 The
values indicate that Asp/Asn local backbones
exhibit restricted motions. The side chains are less flexible than
those of Lys residues due to the shorter side chains possessing more
limited spatial extension. It is shown that the side-chain dynamics
are likely further quenched by hydrogen bonds, salt bridges, and desolvation
for D22, D36, N37, D46, and D47. As discussed above, D47 (COO)− forms a stable salt bridge with K50 (NH3)ζ+, resulting in the stiffness of side chains for
both residues (Figure 3B). Upon the basis of the chemical environment of D22 (Figure 3C), a strong hydrogen bond
likely established between the D22 side chain COO– group with T25 backbone NH, where the O–N and O–H–N
angles are in the range of 1.77–2.02 Å and 138–142°,
respectively. Thus, the hydrogen bond contributes to the restricted
side-chain motion of D22. Further, it presumes that this strong hydrogen
bond formed between the loop and the α helix contributes to
the structural stability of GB1. Figure 3D shows the local environment of D46. It
infers that the rigid side-chain motion of D46 is due to the hydrogen
bonds between COO– and the A48 backbone NH with
an O–N distance of 2.66–2.71 Å and an O–H–N
angle of 138–143° according to the solid-state NMR structure
(PDB: 2LGI(91)). The T49 NH is another possible electron donor
involved in forming a hydrogen bond, which is weaker as the O–N
distance is 3.33–3.43 Å and the O–H–N angle
is 144–148°. The validity of the hydrogen bonding is further
supported by the absence of a competing electron acceptor for D46.
It is noted that the O–N distance for the two hydrogen bonds
is larger based upon the XRD structure (PDB: 2QMT(90)), 3.11 and 4.13 Å, most likely due to minor structural
variation between the solid-state NMR and XRD structures originating
from subtle sample preparation differences. The inflexible D36 (CH2)β group is contradictory to its solvent exposure and
the lack of hydrogen bonds and a salt bridge (Figure 3E). The possible explanation is that D36
packs close to itself in the crystal lattice, deactivating the side-chain
motions. This tight packing is also found to be responsible for its
COO– pKa value being
higher than expected.92 The  values of N37 imply the immobility of the
side chain that resides at the edge of the open pocket formed between
β strands and the α helix and is partially exposed to
solvent (Figure 3F).
This unique position does not explain the rigidity of the side chain.
It is noted that the Y33 aromatic ring is right above N37 (NH2)δ2, allowing the formation of a N–H−π
hydrogen bond between the two. Impacted by this hydrogen bond, N37
side-chain motion is significantly restricted. In fact, the N–H−π
hydrogen bond is often observed in proteins and greatly contributes
to structure stability.93
values of N37 imply the immobility of the
side chain that resides at the edge of the open pocket formed between
β strands and the α helix and is partially exposed to
solvent (Figure 3F).
This unique position does not explain the rigidity of the side chain.
It is noted that the Y33 aromatic ring is right above N37 (NH2)δ2, allowing the formation of a N–H−π
hydrogen bond between the two. Impacted by this hydrogen bond, N37
side-chain motion is significantly restricted. In fact, the N–H−π
hydrogen bond is often observed in proteins and greatly contributes
to structure stability.93
Table 2. 2H  and η̅ Values Determined for
Asn and Asp Aliphatic Sites in Microcrystalline GB1 Proteina.
and η̅ Values Determined for
Asn and Asp Aliphatic Sites in Microcrystalline GB1 Proteina.
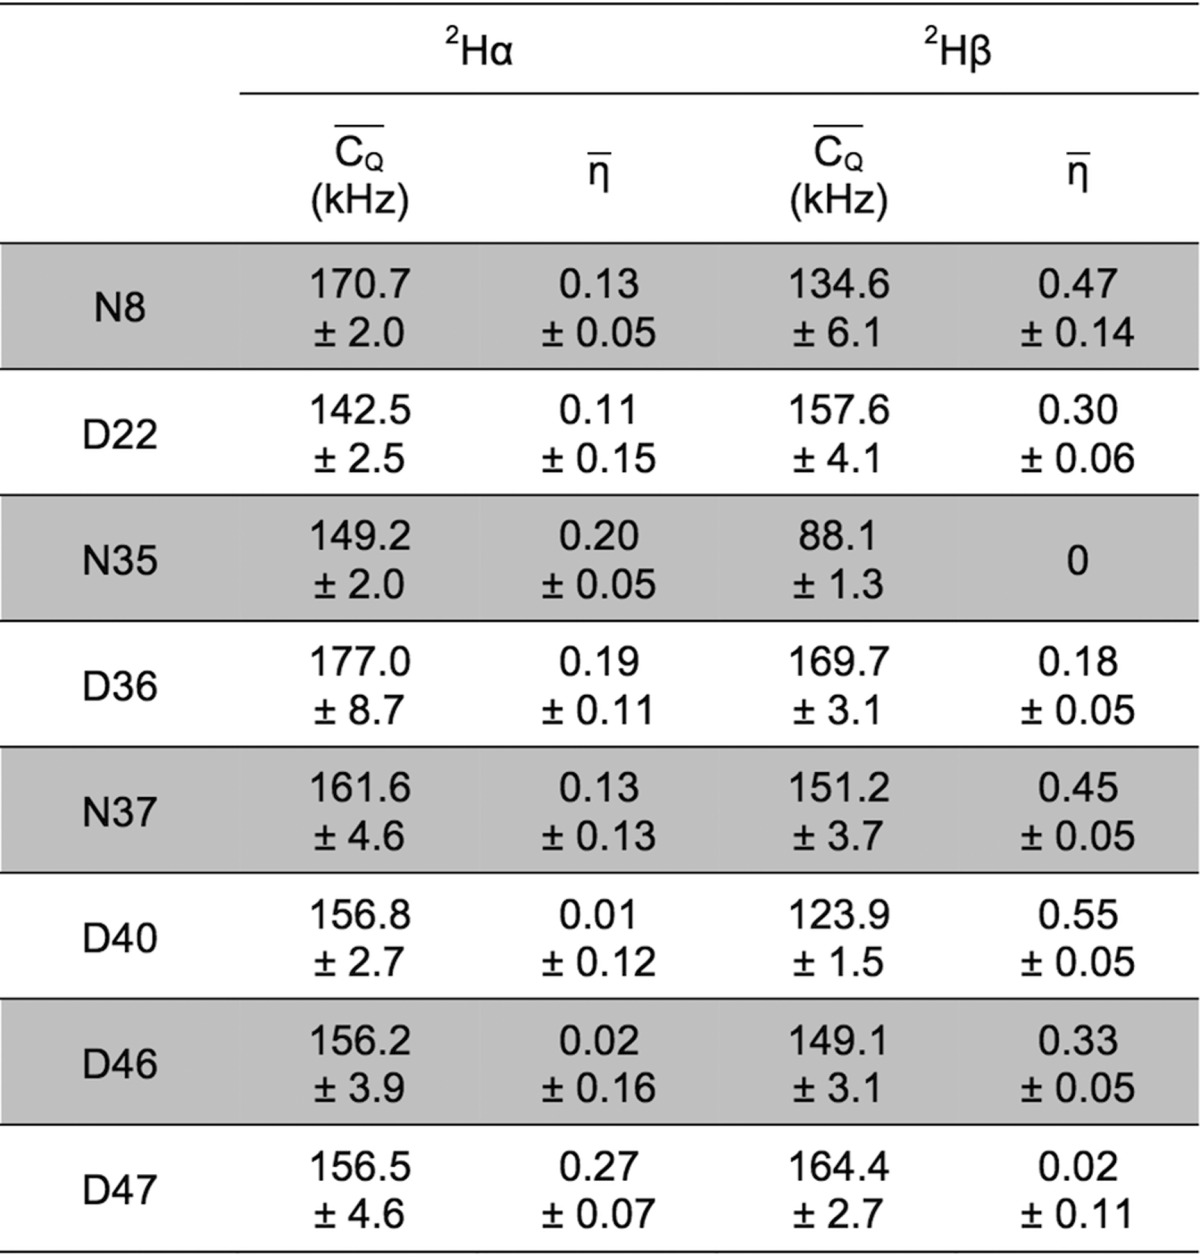
For deuterium undergoing large-amplitude motion, η̅ was set to zero for line-shape fitting.
Figure 3.

(A) Crystal structure
of GB1 (PDB: 2LGI) with Asp and Asn aliphatic groups shown
in van der Waals spheres and coded with color scaling to  values. Two different perspectives are
shown for better visualization. (B) D47, (C) D22, (D) D46, (E) D36,
(F) N37, (G) N35, (H) D40, and (I) N8 local chemical environment in
GB1. The residues having atoms within 5 Å away for the corresponding
Asn or Asp residue are shown in sticks. The salt bridge between D47
and K50 and the hydrogen bonds between D22 and T25, D46 and A48/T49,
and N8 and T55 are presented by dashed lines.
values. Two different perspectives are
shown for better visualization. (B) D47, (C) D22, (D) D46, (E) D36,
(F) N37, (G) N35, (H) D40, and (I) N8 local chemical environment in
GB1. The residues having atoms within 5 Å away for the corresponding
Asn or Asp residue are shown in sticks. The salt bridge between D47
and K50 and the hydrogen bonds between D22 and T25, D46 and A48/T49,
and N8 and T55 are presented by dashed lines.
N8, N35, and D40 possess more flexible side chains compared with other Asn and Asp residues discussed above. Among the three, N35 is the most dynamic one as it points outward from the protein surface and interacts with surrounding solvent molecules (Figure 3G). Because of the similar situation, large-amplitude side-chain motion is expected for D40 (Figure 3H). However, it is impacted by an intermolecular interaction, where D40 forms a salt bridge with K10 (4.95 Å).90,92 As discussed above for K10, the salt bridge, if it exists, is highly dynamic and only slightly rigidifies the D40 and K10 side chains. The N8 side chain presents moderate flexibility due to the coexistence of opposite effects—being mobilized by the surrounding solvent and potentially restricted by hydrogen bonds (Figure 3I). Three out of the ten minimum energy solid-state NMR structures show that a hydrogen bond tends to form between N8 (NH2)δ and T55 (OH)δ1. The O–N distance and O–H–N angle are 2.56–2.59 Å and 141–148°, respectively, according to the NMR structure (PDB: 2LGI(91)). Further, K13 (NH3)ζ+ serves as another possible electron donor for hydrogen bonding with the N8 side-chain carbonyl group based upon one of the ten minimum energy solid-state NMR structures (PDB: 2LGI(91)) and the XRD structure (PDB: 2QMT(90)). The validity of these hydrogen bonds is not supported concurrently by the solid-state NMR and XRD structures, which is likely due to minor structural differences originated from the distinct protein crystallization conditions. Despite this, it is rational to conclude at this point that the hydrogen bonds discussed here likely obstruct N8 side chain motions and compensate for the solvent mobilization effect.
Glu and Gln Side-Chain Dynamics in GB1
Table 3 lists motionally
averaged deuterium
quadrupolar coupling constants and asymmetry parameters for Gln and
Glu residues in microcrystalline GB1. The data imply that dynamics
vary significantly among these residues, particularly for side chains.
Due to the absence of signal, quadrupolar coupling values were not
determined for several groups as indicated in Table 3. The absence of signals can happen in one
of the three scenarios: inefficient 2H–13C CP transfer, significant 2H line broadening correlating
with 10–5–10–6 s time scale
motion, or zero net 13C–13C magnetization
transfer during SPC-5 recoupling. The slow motion in the 10–5–10–6 s regime unlikely exists as both the
backbone and side chains present <10–7 s motion
as implied by  values measured in this study. Further,
efficient 13C–13C polarization transfer
is expected for Cβ → Cα as high transfer efficiency
is observed in the direction of Cα → Cβ for Q2
and E19. This rules out the third possibility that signal absence
is caused by zero net 13C–13C magnetization
transfer during the SPC-5 mixing period. Thus, the explanation of
signal absence is that 2H–13C cross-polarization
is significantly quenched by large-amplitude motion for the groups
with undetermined Gln/Glu
values measured in this study. Further,
efficient 13C–13C polarization transfer
is expected for Cβ → Cα as high transfer efficiency
is observed in the direction of Cα → Cβ for Q2
and E19. This rules out the third possibility that signal absence
is caused by zero net 13C–13C magnetization
transfer during the SPC-5 mixing period. Thus, the explanation of
signal absence is that 2H–13C cross-polarization
is significantly quenched by large-amplitude motion for the groups
with undetermined Gln/Glu  and η̅ values.
Table 3. 2H  and η̅ Values Determined for
Glu and Gln Aliphatic Sites in Microcrystalline GB1a.
and η̅ Values Determined for
Glu and Gln Aliphatic Sites in Microcrystalline GB1a.
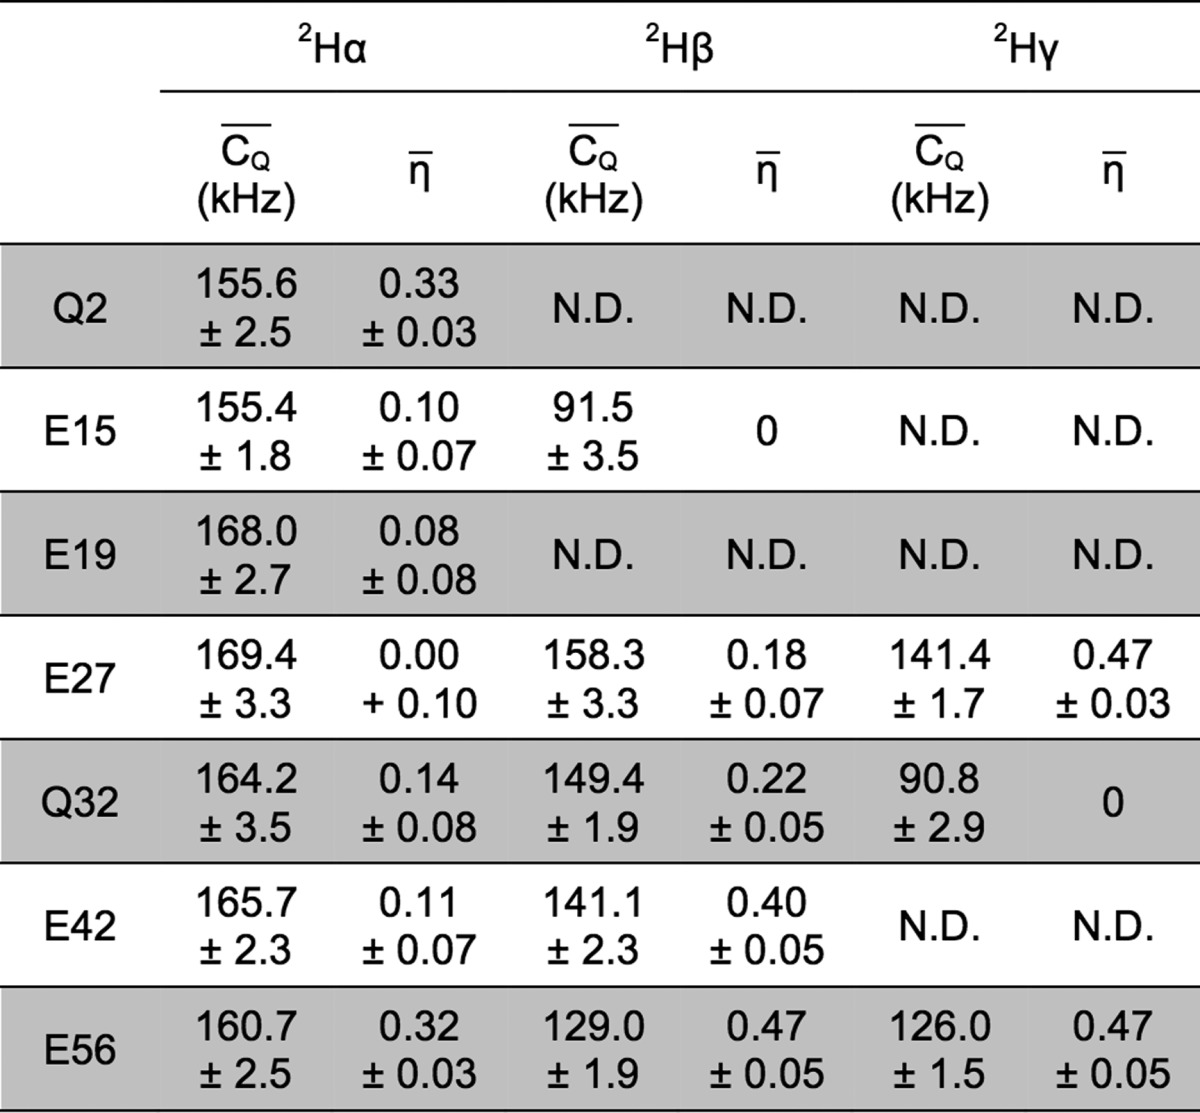
For deuterium undergoing large-amplitude motion, η̅ was set to zero for line-shape fitting.
E27 has the largest  values among the seven residues, indicating
its rigidity in GB1 microcrystals (Table 3 and Figure 4A). As discussed in the previous section, E27 COO– forms a salt bridge with K31 (NH3)ζ+ that significantly hinders side-chain motions for the two residues
(Figure 4B). The moderate
values among the seven residues, indicating
its rigidity in GB1 microcrystals (Table 3 and Figure 4A). As discussed in the previous section, E27 COO– forms a salt bridge with K31 (NH3)ζ+ that significantly hinders side-chain motions for the two residues
(Figure 4B). The moderate  values (∼130 kHz) imply that E56
exhibits restricted side-chain motion that is uncommon for a terminal
residue. Figure 4C
displays the local chemical environment for E56 in GB1 crystal structure.
The side chain points inward to the protein core and places COO– in a unique position that has a strong tendency to
form hydrogen bonds with D40 and the K10 backbone NH. The strong–moderate
hydrogen bond between E56 and K10 is expected as the O–H–N
angle is close to 180° (162–176°) and the O–N
distance is 2.60–3.08 Å according to the solid-state NMR
structures (PDB: 2LGI(91)). In addition, a weak hydrogen bond
is presumably established between E56 COO– and K10
considering the values of the O–N distance (3.00–3.49
Å) and the O–H–N angle (119–133°).
Thus, E56 side-chain motion is significantly impeded by the two hydrogen
bonds. It also explains why strong NMR signals are observed for E56
despite it being the C-terminal residue. Further, the two intrastrand
hydrogen bonds likely have great contribution to stabilize the protein
structure. The side chain of Q32 is much more dynamic than E27 and
E56 illustrated by the
values (∼130 kHz) imply that E56
exhibits restricted side-chain motion that is uncommon for a terminal
residue. Figure 4C
displays the local chemical environment for E56 in GB1 crystal structure.
The side chain points inward to the protein core and places COO– in a unique position that has a strong tendency to
form hydrogen bonds with D40 and the K10 backbone NH. The strong–moderate
hydrogen bond between E56 and K10 is expected as the O–H–N
angle is close to 180° (162–176°) and the O–N
distance is 2.60–3.08 Å according to the solid-state NMR
structures (PDB: 2LGI(91)). In addition, a weak hydrogen bond
is presumably established between E56 COO– and K10
considering the values of the O–N distance (3.00–3.49
Å) and the O–H–N angle (119–133°).
Thus, E56 side-chain motion is significantly impeded by the two hydrogen
bonds. It also explains why strong NMR signals are observed for E56
despite it being the C-terminal residue. Further, the two intrastrand
hydrogen bonds likely have great contribution to stabilize the protein
structure. The side chain of Q32 is much more dynamic than E27 and
E56 illustrated by the  values. This is consistent with the local
structure, where no hydrogen bond or tight packing is indicated (Figure 4D). Although a relatively
large
values. This is consistent with the local
structure, where no hydrogen bond or tight packing is indicated (Figure 4D). Although a relatively
large  (141.1 kHz) is determined for E42 (CH2)β possibly
due to the backbone restriction, its (CH2)γ exhibits
larger-amplitude motion in comparison with
Glu/Gln (discussed above) as indicated by the undetectable 2H–13C cross-polarization. Thus, E42 (CH2)γ presents large-amplitude mobility because it is solvent
exposed and actively interacts with the surrounding water molecules.
The significantly motional attenuated
(141.1 kHz) is determined for E42 (CH2)β possibly
due to the backbone restriction, its (CH2)γ exhibits
larger-amplitude motion in comparison with
Glu/Gln (discussed above) as indicated by the undetectable 2H–13C cross-polarization. Thus, E42 (CH2)γ presents large-amplitude mobility because it is solvent
exposed and actively interacts with the surrounding water molecules.
The significantly motional attenuated  (91.5 kHz) is observed for E15 2Hβ, indicating the side chain is more dynamic than those of
E15, E27, Q32, and E56. This is further illustrated by that the mobility
of E15 (CH2)γ is significantly enhanced leading to
inefficient 2H–13C cross-polarization
transfer. The dynamic E15 side chain is consistent with that it points
outward from the protein surface and is unlikely to participate in
the formation of a hydrogen bond (Figure 4F). However, an intramolecular salt bridge
is likely formed between E15 COO– and K4 (NH3)ζ+ as supported by the XRD structure (PDB: 2QMT(90)) and E15 pH titration behavior.92 This seems controversial to the large-amplitude side-chain motions
of both E15 and K4. The most likely explanation is that the salt bridge
is continually broken and reformed and, therefore, shows negligible
impact on the residue side-chain motions. Q2 and E19 possess the most
flexible side chains because they are exposed to solvent and have
no involvement in any hydrogen bonding or salt bridging (Figure 4G and 4H).
(91.5 kHz) is observed for E15 2Hβ, indicating the side chain is more dynamic than those of
E15, E27, Q32, and E56. This is further illustrated by that the mobility
of E15 (CH2)γ is significantly enhanced leading to
inefficient 2H–13C cross-polarization
transfer. The dynamic E15 side chain is consistent with that it points
outward from the protein surface and is unlikely to participate in
the formation of a hydrogen bond (Figure 4F). However, an intramolecular salt bridge
is likely formed between E15 COO– and K4 (NH3)ζ+ as supported by the XRD structure (PDB: 2QMT(90)) and E15 pH titration behavior.92 This seems controversial to the large-amplitude side-chain motions
of both E15 and K4. The most likely explanation is that the salt bridge
is continually broken and reformed and, therefore, shows negligible
impact on the residue side-chain motions. Q2 and E19 possess the most
flexible side chains because they are exposed to solvent and have
no involvement in any hydrogen bonding or salt bridging (Figure 4G and 4H).
Figure 4.

(A) Crystal structure of GB1 (PDB: 2LGI) with Glu and Gln aliphatic groups shown
in van der Waals spheres and coded with color scaling to  values. Two different perspectives are
shown for better visualization. (B) E27, (C) E56, (D) Q32, (E) E42,
(F) E15, (G) E19, and (H) Q2 local chemical environment in GB1. Aliphatic
groups having deuterium
values. Two different perspectives are
shown for better visualization. (B) E27, (C) E56, (D) Q32, (E) E42,
(F) E15, (G) E19, and (H) Q2 local chemical environment in GB1. Aliphatic
groups having deuterium  values undetermined are color coded with
cyan. The residues having atoms within 5 Å away for the corresponding
Glu or Gln residue are shown in sticks. The salt bridge between E27
and K31 and the hydrogen bond between E56 and D40/K10 are presented
by dashed lines.
values undetermined are color coded with
cyan. The residues having atoms within 5 Å away for the corresponding
Glu or Gln residue are shown in sticks. The salt bridge between E27
and K31 and the hydrogen bond between E56 and D40/K10 are presented
by dashed lines.
Thr Side-Chain Dynamics in GB1
The side-chain OH group
of Thr shows a strong tendency to form a hydrogen bond, particularly
with the protein backbone, as it can act as either an electron donor
or acceptor.94,95 The hydrogen bond is expected
to impede the dynamics of the Thr side chain to some extent. However,
this effect seems to be substantially attenuated based on  values determined for Thr residues in microcrystalline
GB1. Table 4 lists
the motional averaged deuterium quadrupolar coupling parameters for
Thr aliphatic groups. It implies that the (CH2)β
presents restricted motions as the
values determined for Thr residues in microcrystalline
GB1. Table 4 lists
the motional averaged deuterium quadrupolar coupling parameters for
Thr aliphatic groups. It implies that the (CH2)β
presents restricted motions as the  values are close to those of backbone 2Hα for T18, T25, T44, T49, T51, and T55. The difference
of
values are close to those of backbone 2Hα for T18, T25, T44, T49, T51, and T55. The difference
of  is <8 kHz among (CH2)β
groups for these residues, illustrating motions with similar amplitudes.
Based on the local chemical environment, no hydrogen bond is found
for side chain OH groups without ambiguity due to the divergence between
reported XRD90 and NMR91 structures as well as between different NMR conformers.
However, the existence of several hydrogen bonds is expected as supported
by NMR conformers and XRD structure. A hydrogen bond likely forms
between T55 (OH)δ1 and N8 (NH2)δ2, where the distance of O–N and the angle of O–H–N
is 2.56–2.59 Å and 141–148°, respectively,
in three of the NMR conformers (Figure 5B). The positions of T25 in five of the lowest energy
NMR structures are such that its (OH)δ1 tends to
form a hydrogen bond with a D22 backbone CO group (Figure 5C). The O–O distance
and O–H–O angle falls in the range of 3.09–3.10
Å and 159–162°, respectively. As displayed in Figure 5D, T51 has the (OH)δ1 potentially involved in hydrogen bonding to the T49 backbone
NH as shown in the XRD structure (O–O distance is 2.93 Å)
and three NMR energy minimum structures (O–N distance and O–H–N
angle is 3.15–3.19 Å and 124–141°, respectively).
Despite the potential existence of these hydrogen bonds, the (CH2)β groups of the corresponding residues do not show
further restricted motions compared to those of T18, T44, and T49.
is <8 kHz among (CH2)β
groups for these residues, illustrating motions with similar amplitudes.
Based on the local chemical environment, no hydrogen bond is found
for side chain OH groups without ambiguity due to the divergence between
reported XRD90 and NMR91 structures as well as between different NMR conformers.
However, the existence of several hydrogen bonds is expected as supported
by NMR conformers and XRD structure. A hydrogen bond likely forms
between T55 (OH)δ1 and N8 (NH2)δ2, where the distance of O–N and the angle of O–H–N
is 2.56–2.59 Å and 141–148°, respectively,
in three of the NMR conformers (Figure 5B). The positions of T25 in five of the lowest energy
NMR structures are such that its (OH)δ1 tends to
form a hydrogen bond with a D22 backbone CO group (Figure 5C). The O–O distance
and O–H–O angle falls in the range of 3.09–3.10
Å and 159–162°, respectively. As displayed in Figure 5D, T51 has the (OH)δ1 potentially involved in hydrogen bonding to the T49 backbone
NH as shown in the XRD structure (O–O distance is 2.93 Å)
and three NMR energy minimum structures (O–N distance and O–H–N
angle is 3.15–3.19 Å and 124–141°, respectively).
Despite the potential existence of these hydrogen bonds, the (CH2)β groups of the corresponding residues do not show
further restricted motions compared to those of T18, T44, and T49.
Table 4. 2H  and η̅ Values Determined for
Thr Aliphatic Sites in Microcrystalline GB1a.
and η̅ Values Determined for
Thr Aliphatic Sites in Microcrystalline GB1a.
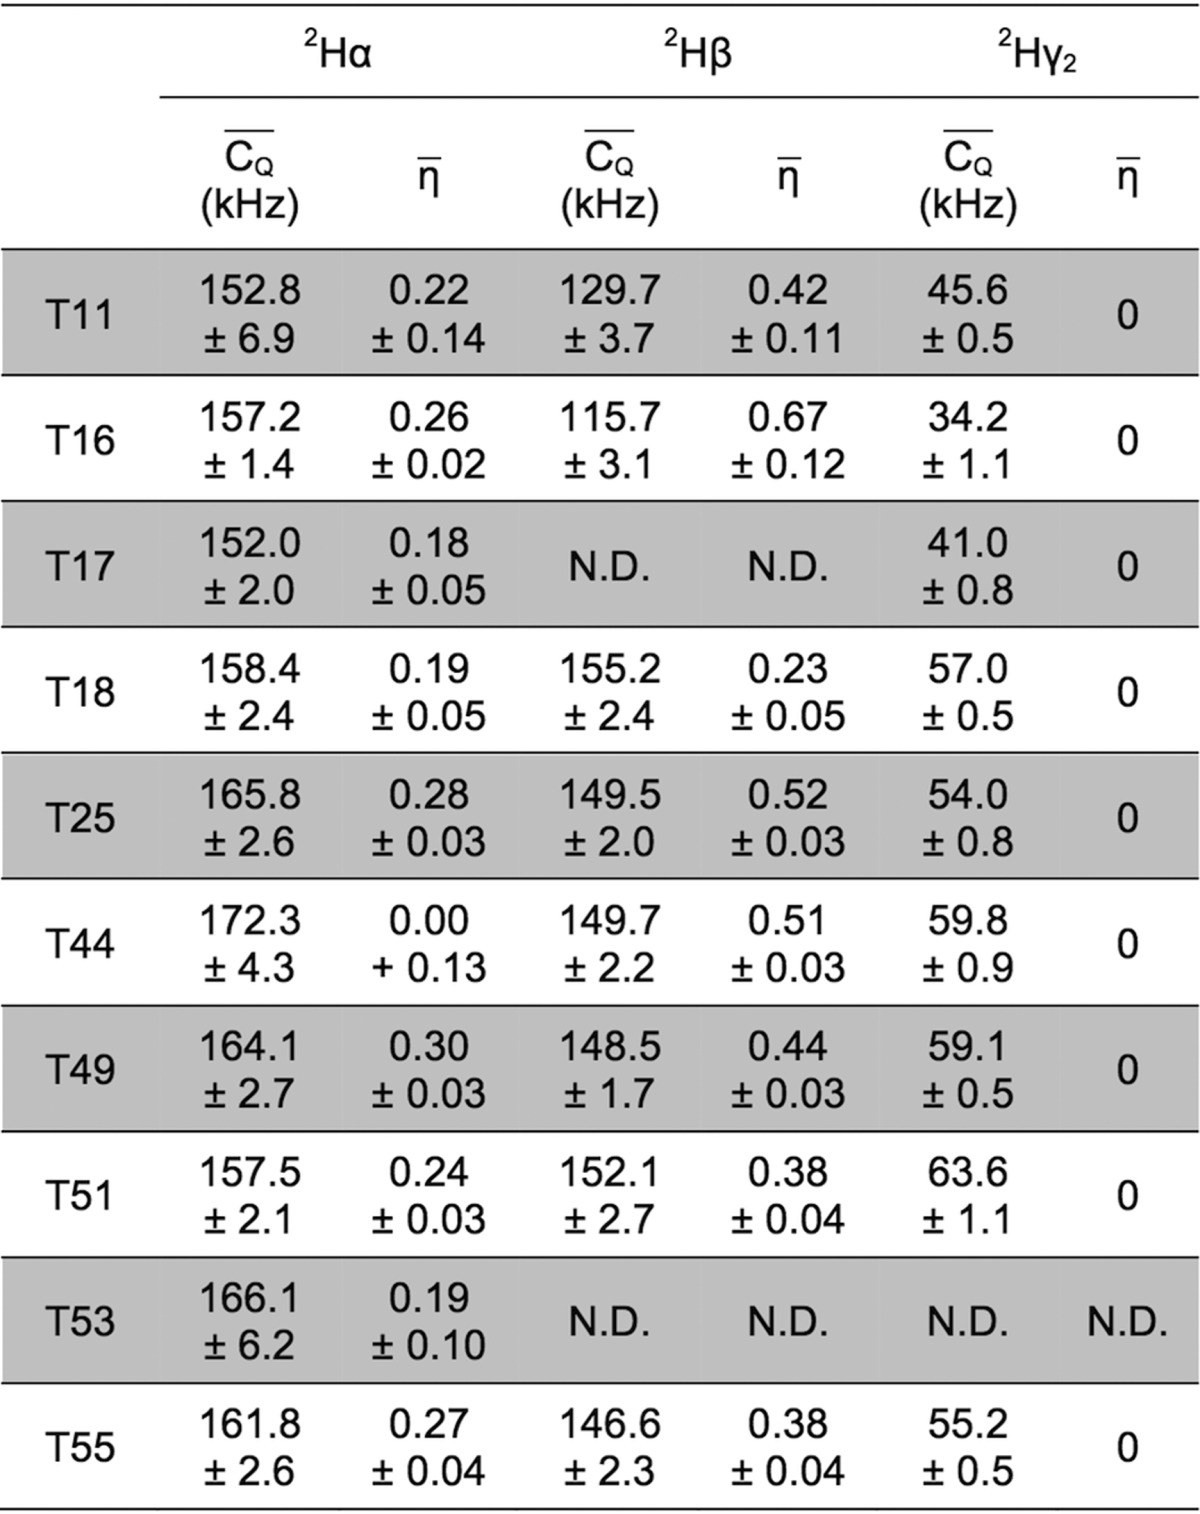
For deuterium undergoing large-amplitude motion, η̅ was set to zero for line-shape fitting.
Figure 5.
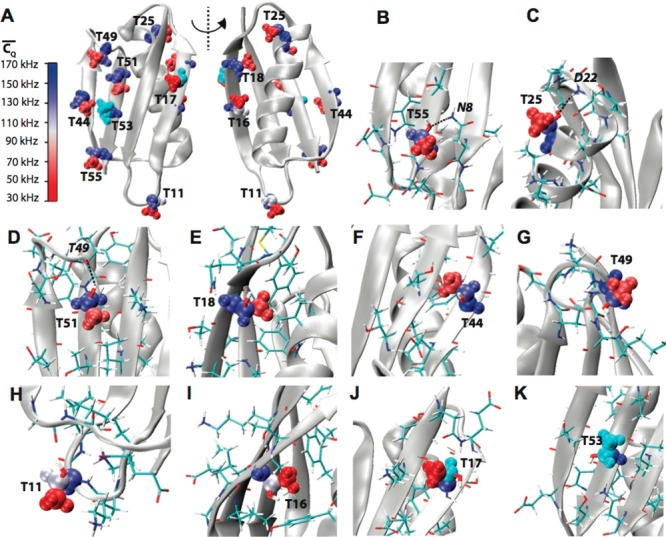
(A) Crystal structure of GB1 (PDB: 2LGI) with Thr aliphatic
groups shown in van
der Waals spheres and coded with color scaling to  values. Two different perspectives are
shown for better visualization. (B) T55, (C) T25, (D) T49, (E) T18,
(F) T44, (G) T49, (H) T11, (I) T16, (J) T17, and (K) T53 local chemical
environment in GB1. Aliphatic groups having deuterium
values. Two different perspectives are
shown for better visualization. (B) T55, (C) T25, (D) T49, (E) T18,
(F) T44, (G) T49, (H) T11, (I) T16, (J) T17, and (K) T53 local chemical
environment in GB1. Aliphatic groups having deuterium  values undetermined are color coded with
cyan. The residues having atoms within 5 Å away for the corresponding
Thr residues are shown in sticks. The hydrogen bonds between T55 and
N8, T25 and D22, and T51 and T49 are presented by dashed lines.
values undetermined are color coded with
cyan. The residues having atoms within 5 Å away for the corresponding
Thr residues are shown in sticks. The hydrogen bonds between T55 and
N8, T25 and D22, and T51 and T49 are presented by dashed lines.
The motionally reduced CQ of a Thr
(CH3)γ2 originates from two processes—methyl
rotation (also considered as three-site reorientation) along its C3v symmetry axis and C3v axis libration. The  of a methyl deuterium is equal to 55.67
kHz if assuming a CQ of 167 ± 1.5
kHz82 and an ideal tetrahedral geometry
for the methyl group and is further reduced by the C3v axis libration. The (CH3)γ2
of a methyl deuterium is equal to 55.67
kHz if assuming a CQ of 167 ± 1.5
kHz82 and an ideal tetrahedral geometry
for the methyl group and is further reduced by the C3v axis libration. The (CH3)γ2 values of T18, T25, T44, T49, T51, and
T55 are all close to this value but exhibit small discrepancies. These
deviations could be explained by a slight departure of the methyl
group geometry from the ideal tetrahedron. Such methyl geometry distortions
have indeed been observed for proteins and small molecules in previous
studies.68,96−98 For example, Ottiger
and Bax determined the Hmethyl–Cmethyl–C angle deviation for methyl groups of human ubiquitin to
be ±1° from 110.9°.97 In
addition, Mittermaier and Kay reported that the angle between the
unique axis of the deuterium electric field gradient tensor and the C3v rotating axis (referred
to as β) was 109.5°.82 It should
be noted that the Hmethyl–Cmethyl–C
angle is not necessary to be identical to the β angle. If a
±1° deviation from 109.5° is assumed for the β
angle, a CQ of 167 ± 1.5 kHz will
yield a
values of T18, T25, T44, T49, T51, and
T55 are all close to this value but exhibit small discrepancies. These
deviations could be explained by a slight departure of the methyl
group geometry from the ideal tetrahedron. Such methyl geometry distortions
have indeed been observed for proteins and small molecules in previous
studies.68,96−98 For example, Ottiger
and Bax determined the Hmethyl–Cmethyl–C angle deviation for methyl groups of human ubiquitin to
be ±1° from 110.9°.97 In
addition, Mittermaier and Kay reported that the angle between the
unique axis of the deuterium electric field gradient tensor and the C3v rotating axis (referred
to as β) was 109.5°.82 It should
be noted that the Hmethyl–Cmethyl–C
angle is not necessary to be identical to the β angle. If a
±1° deviation from 109.5° is assumed for the β
angle, a CQ of 167 ± 1.5 kHz will
yield a  equaling 53.3–58.8 kHz for a methyl
group undergoing fast rotation. The (CH3)γ2
equaling 53.3–58.8 kHz for a methyl
group undergoing fast rotation. The (CH3)γ2 values for T18, T25, T44, T49, and T55
determined here all fall within experimental error of this range,
as shown in Table 4. One outlying group is T51 (CH3)γ2,
in which the
values for T18, T25, T44, T49, and T55
determined here all fall within experimental error of this range,
as shown in Table 4. One outlying group is T51 (CH3)γ2,
in which the  corresponds to its C3v axis departing at least 2.4° from
that of the ideal tetrahedral geometry, under the assumption that CQ is 167 ± 1.5 kHz.82 Nonetheless, discrepancies of this magnitude are indeed
likely to occur in nature, as deviations of 1.9° for the β
angle from an ideal tetrahedron have been observed for proteins by
previous studies.96,97 The other possibilities contributing
to this large discrepancy include a slight deviation of the actual CQ from 167 ± 1.5 kHz as well as any unidentified
corresponds to its C3v axis departing at least 2.4° from
that of the ideal tetrahedral geometry, under the assumption that CQ is 167 ± 1.5 kHz.82 Nonetheless, discrepancies of this magnitude are indeed
likely to occur in nature, as deviations of 1.9° for the β
angle from an ideal tetrahedron have been observed for proteins by
previous studies.96,97 The other possibilities contributing
to this large discrepancy include a slight deviation of the actual CQ from 167 ± 1.5 kHz as well as any unidentified  measurement errors. Overall, the six Thr
residues exhibit very similar dynamics despite the large variation
of local chemical environment; the T18 side-chain points inward to
the protein core, while T49 and T44 residues are completely exposed
to solvent (Figure 5E–G). It implies that Thr (CH2)β motions
are dominantly restricted by the backbone and (CH3)γ2 rotations are in the fast regime and are insensitive to the
local geometry as they do not require much free space.
measurement errors. Overall, the six Thr
residues exhibit very similar dynamics despite the large variation
of local chemical environment; the T18 side-chain points inward to
the protein core, while T49 and T44 residues are completely exposed
to solvent (Figure 5E–G). It implies that Thr (CH2)β motions
are dominantly restricted by the backbone and (CH3)γ2 rotations are in the fast regime and are insensitive to the
local geometry as they do not require much free space.
The side
chains of T11, T16, and T17 are much more dynamic. (CH3)γ2 values are determined to be less than 46
kHz, which are far smaller than that of a methyl group undergoing
three-site reorientation as discussed above. This observation implies
the presence of methyl C3v axis librations for these Thr (CH3)γ2 groups. This is typically observed for systems actively interacting
with solvent (water) molecules. The local environment indicates that
T11, T16, and T17 are fully extended into the solvent (Figure 5H–J). Thus, surrounding
solvent significantly mobilizes the side chains of T11, T16, and T17,
including the (CH2)β and (CH3)γ2 groups. It is noted that the
values are determined to be less than 46
kHz, which are far smaller than that of a methyl group undergoing
three-site reorientation as discussed above. This observation implies
the presence of methyl C3v axis librations for these Thr (CH3)γ2 groups. This is typically observed for systems actively interacting
with solvent (water) molecules. The local environment indicates that
T11, T16, and T17 are fully extended into the solvent (Figure 5H–J). Thus, surrounding
solvent significantly mobilizes the side chains of T11, T16, and T17,
including the (CH2)β and (CH3)γ2 groups. It is noted that the  is not determined for T17 (CH2)β due to weak signal as the 2H–13C cross-polarization transfer is reduced by the large-amplitude motion.
Similarly, the absence of NMR signal for T53 (CH2)β
and (CH3)γ2 indicates its significant
mobile side chain and is consistent with solvent exposure (Figure 5K).
is not determined for T17 (CH2)β due to weak signal as the 2H–13C cross-polarization transfer is reduced by the large-amplitude motion.
Similarly, the absence of NMR signal for T53 (CH2)β
and (CH3)γ2 indicates its significant
mobile side chain and is consistent with solvent exposure (Figure 5K).
Side-Chain Dynamics of Nonpolar Residues in GB1
In
a protein, nonpolar residues are often directed toward the molecule
interior, and the side chains have no involvement in strong noncovalent
interactions such as hydrogen bonding and salt bridging. The side-chain
dynamics are typically dictated by local packing density and solvent
accessibility. Here, we discuss the dynamics of the nonpolar residues
in GB1 using the determined site-specific deuterium quadrupolar coupling
parameters. Motionally averaged  and η̅ values are shown in Table 5 for Leu and Ile residues.
It implies that the (CH2)β and (CH2)γ
groups in the three residues exhibit motions with similar amplitudes
and are dominantly restricted by the rigid backbone. As expected,
(CH2)γ groups are slightly more flexible as they
extend further away from the backbone. The two (CH3)δ
groups reside at the end of the side chain and are observed undergoing
rotations in the fast motion regime. Again, in the current article,
we do not focus the subtle differences of
and η̅ values are shown in Table 5 for Leu and Ile residues.
It implies that the (CH2)β and (CH2)γ
groups in the three residues exhibit motions with similar amplitudes
and are dominantly restricted by the rigid backbone. As expected,
(CH2)γ groups are slightly more flexible as they
extend further away from the backbone. The two (CH3)δ
groups reside at the end of the side chain and are observed undergoing
rotations in the fast motion regime. Again, in the current article,
we do not focus the subtle differences of  and η̅ that contain detailed
dynamics information regarding motional modes. Overall, the deuterium
and η̅ that contain detailed
dynamics information regarding motional modes. Overall, the deuterium  values indicate that the side chain of
L5 is the most rigid one among the three. This is attributed to the
surrounding high packing density as the side chain is buried deeply
in the protein core (Figure 6). The side chain of L12 is more dynamic compared with those
of L5 and L7. The
values indicate that the side chain of
L5 is the most rigid one among the three. This is attributed to the
surrounding high packing density as the side chain is buried deeply
in the protein core (Figure 6). The side chain of L12 is more dynamic compared with those
of L5 and L7. The  values of its two (CH3)δ
groups are significantly reduced to 40.5 and 44.5 kHz, indicating
that the C3v axes of
the methyl groups undergo librations, while each deuterium is involved
in fast three-site reorientation. The high mobility of the L12 side
chain is a consequence of the much lower packing density and partial
solvent exposure as displayed in Figure 6C. The moderately crowded local chemical
environment of L7 is responsible for the side-chain dynamics with
intermediate amplitude between that of L5 and L12 (Figure 6D). As discussed for Thr residues
in the previous section, the
values of its two (CH3)δ
groups are significantly reduced to 40.5 and 44.5 kHz, indicating
that the C3v axes of
the methyl groups undergo librations, while each deuterium is involved
in fast three-site reorientation. The high mobility of the L12 side
chain is a consequence of the much lower packing density and partial
solvent exposure as displayed in Figure 6C. The moderately crowded local chemical
environment of L7 is responsible for the side-chain dynamics with
intermediate amplitude between that of L5 and L12 (Figure 6D). As discussed for Thr residues
in the previous section, the  of a methyl group is reduced to 53.3–58.8
kHz by three-site reorientation if we assume the CQ equals 167 ± 1.5 kHz82 and the β angle possesses a 1.0° deviation from 109.5°.82,97 Thus, the
of a methyl group is reduced to 53.3–58.8
kHz by three-site reorientation if we assume the CQ equals 167 ± 1.5 kHz82 and the β angle possesses a 1.0° deviation from 109.5°.82,97 Thus, the  of the L7 (CH3)δ2 group (59.3 ±
1.5 kHz) infers the presence of fast methyl group
rotation and the immobility of the C3v axis which is equivalent to the rigidity of the
Cγ–Cδ2 bond. In contrast, L5 (CH3)δ groups possess
of the L7 (CH3)δ2 group (59.3 ±
1.5 kHz) infers the presence of fast methyl group
rotation and the immobility of the C3v axis which is equivalent to the rigidity of the
Cγ–Cδ2 bond. In contrast, L5 (CH3)δ groups possess  values larger than those for methyl groups
undergoing free three-site reorientations in the rigid lattice. The
(CH3)δ2
values larger than those for methyl groups
undergoing free three-site reorientations in the rigid lattice. The
(CH3)δ2 , 61.0 ± 1.6 kHz, exhibits a small
discrepancy (within error), possibly due to the methyl geometry departing
slightly further from the tetrahedron. The largest discrepancy is
observed for the
, 61.0 ± 1.6 kHz, exhibits a small
discrepancy (within error), possibly due to the methyl geometry departing
slightly further from the tetrahedron. The largest discrepancy is
observed for the  of L5 (CH3)δ2, which presents a β
angle difference of at least 4.6°
relative to an ideal tetrahedral geometry. Such a large deviation
has not been reported by any previous study. It is noteworthy that
this deviation could simply result from an analytical uncertainty
due to the poor signal-to-noise ratio of the L5 (CH3)δ22H spectrum (Figure S5), which will require replicated data for error determination. In
addition, in the three cases, different
of L5 (CH3)δ2, which presents a β
angle difference of at least 4.6°
relative to an ideal tetrahedral geometry. Such a large deviation
has not been reported by any previous study. It is noteworthy that
this deviation could simply result from an analytical uncertainty
due to the poor signal-to-noise ratio of the L5 (CH3)δ22H spectrum (Figure S5), which will require replicated data for error determination. In
addition, in the three cases, different  values are determined for the two (CH2)δ groups. It results from the restricted Cγ–Cδ
bond rotation and the distinguishable local pack densities that cause
appreciable different effects on the geometries and motions of the
two methyl groups. I6 resides in the middle of β1, and the side
chain points outward from the protein surface (Figure 6E). I6 (CH2)γ1 possesses a much smaller motional averaged
values are determined for the two (CH2)δ groups. It results from the restricted Cγ–Cδ
bond rotation and the distinguishable local pack densities that cause
appreciable different effects on the geometries and motions of the
two methyl groups. I6 resides in the middle of β1, and the side
chain points outward from the protein surface (Figure 6E). I6 (CH2)γ1 possesses a much smaller motional averaged  compared with Leu (CH2)γ
due to that it is exposed to solvent and less branched. It is interesting
to note that the I6 methyl group is not as dynamic as L12 despite
the fact that they are both exposed to solvent. This is likely due
to the packing density and side-chain geometry differences correlated
with the side-chain dihedral angles.
compared with Leu (CH2)γ
due to that it is exposed to solvent and less branched. It is interesting
to note that the I6 methyl group is not as dynamic as L12 despite
the fact that they are both exposed to solvent. This is likely due
to the packing density and side-chain geometry differences correlated
with the side-chain dihedral angles.
Table 5. 2H  and η̅ Values Determined for
Leu and Ile Aliphatic Sites in Microcrystalline GB1a.
and η̅ Values Determined for
Leu and Ile Aliphatic Sites in Microcrystalline GB1a.

For deuterium undergoing large-amplitude motion, η̅ was set to zero for line-shape fitting. Quadrupolar coupling parameters were not determined for L7 (CH2)δ1 due to signal overlap.
Figure 6.

(A) Crystal
structure of GB1 (PDB: 2LGI) with Leu and Ile aliphatic groups shown
in van der Waals spheres and coded with color scaling to  values. (B) L5, (C) L12, (D) L7, and (E)
I6 local chemical environment in GB1. Aliphatic groups having deuterium
values. (B) L5, (C) L12, (D) L7, and (E)
I6 local chemical environment in GB1. Aliphatic groups having deuterium  values undetermined are color coded with
cyan. The residues having atoms within 5 Å away for the corresponding
Leu/Ile residue are shown in sticks.
values undetermined are color coded with
cyan. The residues having atoms within 5 Å away for the corresponding
Leu/Ile residue are shown in sticks.
Motional averaged deuterium quadrupolar coupling parameters
of
Val residues in GB1 are displayed in Table 6. The parameters are not determined for the
V21 side chain due to the absence of signal. It indicates that this
side chain is significantly mobilized, leading to inefficient 2H → 13C cross-polarization transfer. This
is consistent with the local chemical environment in the protein structure,
where V21 is in a turn between β2 and the helix and fully extended
to the solvent (Figure 7A and B). In contrast, V54 is observed to be the most rigid Val residue
in GB1 as indicated by the  values. The restricted motion is caused
by the high packing density, as this residue points inward and is
completely buried in the interior of the protein (Figure 7C). V29 exhibits dynamics with
similar amplitudes as V54. The chemical environment shows that V29
resides in the middle of the well-ordered amphipathic helix (Figure 7D). Further, the
geometry of the local structure and the short side-chain length likely
reduce the possibility of V29 substantially interacting with solvent.
V39 is in the loop between β3 and the helix and at the edge
of the protein core (Figure 7E). The absence of observable 2H → 13C transfer for V39 (CH3)γ2 implies
that the dynamics of this group is significantly enhanced. One possible
explanation is that V39 is partially exposed to solvent as shown in Figure 7E, and only (CH3)γ2 actively interacts with solvent due to
the restricted Cα–Cβ rotation. The Val dynamics
discovered here further explain the polarization transfer efficiency
observed for these residues in GB1 in a previous study.84
values. The restricted motion is caused
by the high packing density, as this residue points inward and is
completely buried in the interior of the protein (Figure 7C). V29 exhibits dynamics with
similar amplitudes as V54. The chemical environment shows that V29
resides in the middle of the well-ordered amphipathic helix (Figure 7D). Further, the
geometry of the local structure and the short side-chain length likely
reduce the possibility of V29 substantially interacting with solvent.
V39 is in the loop between β3 and the helix and at the edge
of the protein core (Figure 7E). The absence of observable 2H → 13C transfer for V39 (CH3)γ2 implies
that the dynamics of this group is significantly enhanced. One possible
explanation is that V39 is partially exposed to solvent as shown in Figure 7E, and only (CH3)γ2 actively interacts with solvent due to
the restricted Cα–Cβ rotation. The Val dynamics
discovered here further explain the polarization transfer efficiency
observed for these residues in GB1 in a previous study.84
Table 6. 2H  and η̅ Values Determined for
Val Aliphatic Sites in Microcrystalline GB1a.
and η̅ Values Determined for
Val Aliphatic Sites in Microcrystalline GB1a.

For deuterium undergoing large-amplitude motion, η̅ was set to zero for line-shape fitting.
Figure 7.

(A) Crystal structure of GB1 (PDB: 2LGI) with Val aliphatic
groups shown in van
der Waals spheres and coded with color scaling to  values. (B) V21, (C) V54, (D) V29, and
(E) V39 local chemical environment in GB1. Aliphatic groups having
deuterium
values. (B) V21, (C) V54, (D) V29, and
(E) V39 local chemical environment in GB1. Aliphatic groups having
deuterium  values undetermined are color coded with
cyan. The residues having atoms within 5 Å away for the corresponding
Val residue are shown in sticks.
values undetermined are color coded with
cyan. The residues having atoms within 5 Å away for the corresponding
Val residue are shown in sticks.
Deuterium quadrupolar coupling parameters were determined
for Ala
residues in GB1 as listed in Table S2.
Despite the large variation in chemical environment, A20, A23, A34,
and A48 possess the same 2Hβ  value within experimental error (Figure S6). These values agree well with those
of methyl groups undergoing fast three-site reorientations in rigid
lattices. The small side chain methyl group makes its dynamics much
less sensitive to packing density. Slightly larger
value within experimental error (Figure S6). These values agree well with those
of methyl groups undergoing fast three-site reorientations in rigid
lattices. The small side chain methyl group makes its dynamics much
less sensitive to packing density. Slightly larger  values are observed for A26 and A24 (Table S3), likely due to similar small deviations
from ideal tetrahedral geometry, the discrepancies of the CQ values, or a combination of the two (as observed
for several Thr, Leu, and Ile methyl groups discussed above). It is
noted that solvent exposure leads to negligible effect on the dynamics
of the Ala side chain. Similarly, weak correlation between dynamics
and chemical environment was previously reported for Ala methyl groups
in several proteins in solution.99
values are observed for A26 and A24 (Table S3), likely due to similar small deviations
from ideal tetrahedral geometry, the discrepancies of the CQ values, or a combination of the two (as observed
for several Thr, Leu, and Ile methyl groups discussed above). It is
noted that solvent exposure leads to negligible effect on the dynamics
of the Ala side chain. Similarly, weak correlation between dynamics
and chemical environment was previously reported for Ala methyl groups
in several proteins in solution.99
Backbone Dynamics of Microcrystalline GB1
Figure 82Hα
shows the  values for all residues in microcrystalline
GB1 except for F52 of which the
values for all residues in microcrystalline
GB1 except for F52 of which the  is not determined due to signal overlap.
It is noted that the 2Hα
is not determined due to signal overlap.
It is noted that the 2Hα  values are close to those observed for
the rigid lattice in peptides and proteins,71,74,75,100 implying
that the backbone in GB1 exhibits high rigidity. Further, the detected
nonzero η̅ values infer that the rigid backbone undergoes
small-amplitude fluctuations and reorientations. The overall larger 2Hα
values are close to those observed for
the rigid lattice in peptides and proteins,71,74,75,100 implying
that the backbone in GB1 exhibits high rigidity. Further, the detected
nonzero η̅ values infer that the rigid backbone undergoes
small-amplitude fluctuations and reorientations. The overall larger 2Hα  values infer that the backbone of GB1 microcrystals
exhibits motions with significantly smaller amplitudes in comparison
to the side chains. Further, the small variation of the 2Hα
values infer that the backbone of GB1 microcrystals
exhibits motions with significantly smaller amplitudes in comparison
to the side chains. Further, the small variation of the 2Hα  indicates the high similarity of local
backbone rigidity for all residues in microcrystalline GB1, despite
the significant deviations of side-chain motions. This agrees with
previous NMR and MD simulation studies showing that the backbone order
parameter covers a narrow window.37,38,83,91,101−103
indicates the high similarity of local
backbone rigidity for all residues in microcrystalline GB1, despite
the significant deviations of side-chain motions. This agrees with
previous NMR and MD simulation studies showing that the backbone order
parameter covers a narrow window.37,38,83,91,101−103
Figure 8.

2Hα  values determined for amino acid residues
in microcrystalline GB1. The value for residue F52 was not determined
due to signal overlap.
values determined for amino acid residues
in microcrystalline GB1. The value for residue F52 was not determined
due to signal overlap.
If a rigid-limit 2Hα CQ value
of 174
kHz is assumed,83 the backbone order parameters
derived from  /CQ(rigid-limit)
cover the range of 0.82–1.0 (Figure S7), which shows a good overall agreement with 15N R1/R1ρ, CαH, and NH dipolar coupling
solution-state and solid-state NMR measurements.37,38,83,91,101−103 Particularly, the backbone order
parameters obtained in the present 2H measurements agree
very well with previously reported CαHα dipolar coupling
data within error on the per residue basis (Figure S7). Somewhat larger discrepancies are observed between the
current results and the previous relaxation and NH dipolar coupling
data, which likely originates from inherent protein properties and
various experimental conditions. First, the CH/CD and NH vectors are
motionally distinct from each other, resulting in the discrepancies
on the order parameters derived from 2Hα CQ (or CαH dipolar couplings) and NH dipolar couplings91 as well as 2Hα and 15N solution-state NMR relaxation rates.83 Second, discrepancies also exist between CαH vector order
parameters derived from the
/CQ(rigid-limit)
cover the range of 0.82–1.0 (Figure S7), which shows a good overall agreement with 15N R1/R1ρ, CαH, and NH dipolar coupling
solution-state and solid-state NMR measurements.37,38,83,91,101−103 Particularly, the backbone order
parameters obtained in the present 2H measurements agree
very well with previously reported CαHα dipolar coupling
data within error on the per residue basis (Figure S7). Somewhat larger discrepancies are observed between the
current results and the previous relaxation and NH dipolar coupling
data, which likely originates from inherent protein properties and
various experimental conditions. First, the CH/CD and NH vectors are
motionally distinct from each other, resulting in the discrepancies
on the order parameters derived from 2Hα CQ (or CαH dipolar couplings) and NH dipolar couplings91 as well as 2Hα and 15N solution-state NMR relaxation rates.83 Second, discrepancies also exist between CαH vector order
parameters derived from the  values determined in this work (Figure 4S) and those determined by the previous 2H solution-state
NMR relaxation studies.83 The disagreement
could be a consequence of a number of
factors, including the non-negligible differences between proteins
in solution and microcrystalline forms, experimental temperature differences
as well as unidentified systematic uncertainties of the methodologies.
Certainly, a quantitative discussion of these disagreements between
studies requires complete understanding of these factors; however,
this is beyond the scope of the present paper. Overall, the order
parameters obtained in the current work fall within the range of 0.82–1.0
and agree well with previous studies. Interestingly, a “zigzag”
pattern is observed primarily for the order parameters of the helix
regions, which cannot be fully explained by the solvent exposure or
packing density. It is noteworthy that the above discussion excludes
the motional averaged tensor asymmetry parameters, of which the interpretation
is important to characterize details of protein dynamics when using
both quadrupolar and dipolar coupling measurements.104 Slow motions at nanosecond time scales were explored for
the GB1 backbone by the solid-state 15N rotating-frame
relaxation rate.37 It is known that the 2H NMR line shapes report the motional modes but not the quantitative
motional rates at this dynamic regime, and 2H relaxation
measurements are typically employed to assist in elucidating correlation
time information.66,67 Backbone fluctuation/reorientation
angles and rates can be extracted from 2H line shapes and
relaxation times. This type of analysis requires interpretation of
values determined in this work (Figure 4S) and those determined by the previous 2H solution-state
NMR relaxation studies.83 The disagreement
could be a consequence of a number of
factors, including the non-negligible differences between proteins
in solution and microcrystalline forms, experimental temperature differences
as well as unidentified systematic uncertainties of the methodologies.
Certainly, a quantitative discussion of these disagreements between
studies requires complete understanding of these factors; however,
this is beyond the scope of the present paper. Overall, the order
parameters obtained in the current work fall within the range of 0.82–1.0
and agree well with previous studies. Interestingly, a “zigzag”
pattern is observed primarily for the order parameters of the helix
regions, which cannot be fully explained by the solvent exposure or
packing density. It is noteworthy that the above discussion excludes
the motional averaged tensor asymmetry parameters, of which the interpretation
is important to characterize details of protein dynamics when using
both quadrupolar and dipolar coupling measurements.104 Slow motions at nanosecond time scales were explored for
the GB1 backbone by the solid-state 15N rotating-frame
relaxation rate.37 It is known that the 2H NMR line shapes report the motional modes but not the quantitative
motional rates at this dynamic regime, and 2H relaxation
measurements are typically employed to assist in elucidating correlation
time information.66,67 Backbone fluctuation/reorientation
angles and rates can be extracted from 2H line shapes and
relaxation times. This type of analysis requires interpretation of  and η̅ with NMR line shape
simulations on particular motional models, which is an interesting
topic for future studies.
and η̅ with NMR line shape
simulations on particular motional models, which is an interesting
topic for future studies.
Correlations between the Dynamics of GB1 and Its Structure and Biological Function
In order to understand the side-chain
dynamics of GB1 in the context of protein structure and biological
function, we map out the side-chain motions across the whole protein
as displayed in Figure 9. Chain lengths, degrees of branching, and polarities have distinct
effects on the mobilities of different chemical groups of the side
chains. Thus, the side-chain dynamics are identified as large, moderate,
and small amplitude motions based on comparisons within the same type
of amino acids. The analyses are conducted for amino acids presenting
multiple times in GB1, including Lys, Asn/Asp, Gln/Glu, Thr, Leu,
and Val, except for Ala residues that exhibit similar dynamics. On
the basis of the  values, K4, K10, N35, Q2, E15, E19, E42,
T11, T16, T17, T53, L12, and V21 exhibit large-amplitude side-chain
motions; K13, K28, K31, N8, D40, Q32, and V39 display moderate side-chain
flexibilities; K50, D22, D36, N37, D46, D47, T18, T25, T44, T49, T51,
T55, L5, L7, V29, and V54 present small-amplitude dynamics. The most
dynamic side chains in GB1 are primarily observed for the β2
strand and the loop between the β1 and β2 strands (Figure 9). Previous studies
revealed that these domains showed large chemical shift perturbations
when binding to immunoglobulin G (IgG) and were involved in interacting
with IgG.105−109 In addition, as shown in Figure 9, side-chain motions with large to moderate amplitudes
are present at the helix regions facing the β3 strand and the
loop between the helix and the β3 strand, which also serve as
binding domains during the interaction with IgG. The overlap between
dynamic domains and binding regions suggests that the high degrees
of side-chain mobilities play important roles in the contacts and
interactions between GB1 and IgG. It is interesting to note that the
helix regions facing the opposite direction of the mobile regions
(facing way from the β3 strand) possess highly rigid side chains
(Figure 9). The corresponding
side chains are involved in hydrogen bonding or salt bridging and
likely contribute to the stability of the protein structures, while
the dynamic regions interact with IgG. The β3 strand serves
as another protein binding interface, and the first residue on this
β strand, E42, exhibits significant perturbed chemical shifts
upon binding IgG.106 Our results indicate
that E42 is highly mobile, which likely contributes to the interaction
of GB1 with IgG. It is noteworthy that the remaining residues of the
β3 strand demonstrate small-amplitude side-chain motions. Among
these, W43 and Y45 have the aromatic rings buried in the core of the
protein, leading to the rigidity of side chains that are absent from
protein interactions. The other two residues (T44 and D46) also present
somewhat restricted side-chain motions. Further, the regions possessing
immobile side chains include the β4 strand, the middle portion
of the β1 strand, and the loop between the β3 and β4
strands, which are not involved in the interactions with IgG. It is
also interesting to note that high flexibility is determined for the
side chain of T53 on the β4 strand. Previous studies demonstrated
that large chemical shift perturbations occurred to T53 and suggested
that this residue might participate in the modulation of hydrogen
bonds during protein binding.108 Thus,
the large-amplitude side-chain motions of T53 potentially assist the
hydrogen bonding modulation process. In addition, the first several
residues on the β1 strand possess flexible side chains as shown
in Figure 9, which
are expected for terminal regions. Overall, the dynamics of GB1 side
chains highly correlate with its biological interactions with IgG.
The residues at the binding regions exhibit large-amplitude side-chain
motions, which likely facilitate protein contacts and interactions.
In contrast, low side-chain mobility is primarily observed for regions
that are not involved in protein binding and interactions, and the
rigidity of the side chains likely assists in stabilizing the protein
structure. These high correlations highlight the importance of side-chain
motions in protein activities, which directly correlate to conformational
entropy and have critical contributions in energetics of biological
events as shown by a number of recent studies.110−113
values, K4, K10, N35, Q2, E15, E19, E42,
T11, T16, T17, T53, L12, and V21 exhibit large-amplitude side-chain
motions; K13, K28, K31, N8, D40, Q32, and V39 display moderate side-chain
flexibilities; K50, D22, D36, N37, D46, D47, T18, T25, T44, T49, T51,
T55, L5, L7, V29, and V54 present small-amplitude dynamics. The most
dynamic side chains in GB1 are primarily observed for the β2
strand and the loop between the β1 and β2 strands (Figure 9). Previous studies
revealed that these domains showed large chemical shift perturbations
when binding to immunoglobulin G (IgG) and were involved in interacting
with IgG.105−109 In addition, as shown in Figure 9, side-chain motions with large to moderate amplitudes
are present at the helix regions facing the β3 strand and the
loop between the helix and the β3 strand, which also serve as
binding domains during the interaction with IgG. The overlap between
dynamic domains and binding regions suggests that the high degrees
of side-chain mobilities play important roles in the contacts and
interactions between GB1 and IgG. It is interesting to note that the
helix regions facing the opposite direction of the mobile regions
(facing way from the β3 strand) possess highly rigid side chains
(Figure 9). The corresponding
side chains are involved in hydrogen bonding or salt bridging and
likely contribute to the stability of the protein structures, while
the dynamic regions interact with IgG. The β3 strand serves
as another protein binding interface, and the first residue on this
β strand, E42, exhibits significant perturbed chemical shifts
upon binding IgG.106 Our results indicate
that E42 is highly mobile, which likely contributes to the interaction
of GB1 with IgG. It is noteworthy that the remaining residues of the
β3 strand demonstrate small-amplitude side-chain motions. Among
these, W43 and Y45 have the aromatic rings buried in the core of the
protein, leading to the rigidity of side chains that are absent from
protein interactions. The other two residues (T44 and D46) also present
somewhat restricted side-chain motions. Further, the regions possessing
immobile side chains include the β4 strand, the middle portion
of the β1 strand, and the loop between the β3 and β4
strands, which are not involved in the interactions with IgG. It is
also interesting to note that high flexibility is determined for the
side chain of T53 on the β4 strand. Previous studies demonstrated
that large chemical shift perturbations occurred to T53 and suggested
that this residue might participate in the modulation of hydrogen
bonds during protein binding.108 Thus,
the large-amplitude side-chain motions of T53 potentially assist the
hydrogen bonding modulation process. In addition, the first several
residues on the β1 strand possess flexible side chains as shown
in Figure 9, which
are expected for terminal regions. Overall, the dynamics of GB1 side
chains highly correlate with its biological interactions with IgG.
The residues at the binding regions exhibit large-amplitude side-chain
motions, which likely facilitate protein contacts and interactions.
In contrast, low side-chain mobility is primarily observed for regions
that are not involved in protein binding and interactions, and the
rigidity of the side chains likely assists in stabilizing the protein
structure. These high correlations highlight the importance of side-chain
motions in protein activities, which directly correlate to conformational
entropy and have critical contributions in energetics of biological
events as shown by a number of recent studies.110−113
Figure 9.
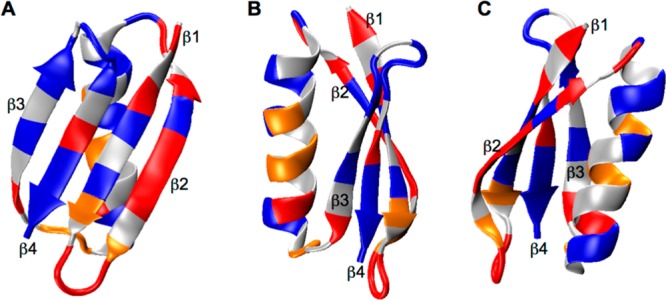
Protein side-chain dynamics map for microcrystalline GB1, shown in three different viewpoints. Lys, Asn, Asp, Gln, Glu, Thr, Leu, and Val residues exhibiting large, moderate, and small amplitude side-chain motions are highlighted in red, orange, and blue, respectively. The rest of the residues (gray) are not considered in this illustration.
Conclusions
The
study of atomic-level protein dynamics has lagged far behind
structure determination due to the lack of high-resolution techniques.
The significant role of molecular motions in protein biological function
has led to increased demand for developing new approaches to probe
molecular dynamics. In the current work, we present a newly designed
3D 2H–13C–13C MAS solid-state
NMR pulse sequence. 2H–13C adiabatic
RESPRIRATION CP implemented in the 3D pulse sequence allows for the
accurate detection of 2H line shapes for deuterium-residing
chemical groups in a protein in a site-specific fashion. The extracted
motional averaged deuterium quadrupolar parameters provide protein
backbone and side-chain dynamics for every isotopically labeled site.
Here, 2H line shapes are extracted for 140 chemical groups
in the protein from the 3D 2H–13C–13C MAS NMR spectrum collected for microcrystalline GB1. The
obtained  values elucidate various internal motions
exhibited in the protein. The site-specific side-chain dynamics are
interpreted by correlating with factors including local structure,
packing density, solvent exposure, salt bridging, and hydrogen bonding.
It in turn allows for validating the presence of these factors and
their impact on protein dynamics and stability. Further, high correlations
are demonstrated between GB1 side-chain dynamics and the biological
activities. Large-amplitude side-chain motions are observed for regions
that are involved in interactions with IgG. In contrast, rigid side
chains are primarily found for residues that are in the core of the
protein and are absent from protein binding and interactions. It infers
that the high mobility of GB1 side chains likely contributes to protein
contacts and binding, while the low flexibility of the side chains
facilitates maintaining its structures during biological activities.
These results provide critical insights into the roles of side-chain
dynamics in protein biological functions. In perspective, we expect
this technique to have wide applications to studies of dynamics for
proteins including protein fibrils and microcrystals, as well as large
membrane proteins. Further, to date, CQ has been only systematically reported for 2H at methyl
and Cα sites in proteins by solution-state NMR studies.82,83 The current work is the first study that determines
values elucidate various internal motions
exhibited in the protein. The site-specific side-chain dynamics are
interpreted by correlating with factors including local structure,
packing density, solvent exposure, salt bridging, and hydrogen bonding.
It in turn allows for validating the presence of these factors and
their impact on protein dynamics and stability. Further, high correlations
are demonstrated between GB1 side-chain dynamics and the biological
activities. Large-amplitude side-chain motions are observed for regions
that are involved in interactions with IgG. In contrast, rigid side
chains are primarily found for residues that are in the core of the
protein and are absent from protein binding and interactions. It infers
that the high mobility of GB1 side chains likely contributes to protein
contacts and binding, while the low flexibility of the side chains
facilitates maintaining its structures during biological activities.
These results provide critical insights into the roles of side-chain
dynamics in protein biological functions. In perspective, we expect
this technique to have wide applications to studies of dynamics for
proteins including protein fibrils and microcrystals, as well as large
membrane proteins. Further, to date, CQ has been only systematically reported for 2H at methyl
and Cα sites in proteins by solution-state NMR studies.82,83 The current work is the first study that determines  values for the majority of the resolved
aliphatic deuterium sites in a protein. These data will enhance and
extend the interpretation of 2H relaxation analysis widely
used in solution-state and solid-state NMR.
values for the majority of the resolved
aliphatic deuterium sites in a protein. These data will enhance and
extend the interpretation of 2H relaxation analysis widely
used in solution-state and solid-state NMR.
Acknowledgments
This research is supported by R01-HL103999, R01-GM073770, R01-GM112845, and R21-GM107905. XS is an American Heart Association Postdoctoral Fellow (15POST25700070). We thank Dr. Deborah Berthold for help with GB1 protein sample preparation. We also thank Dr. Kristin Nuzzio, Mr. Dennis Piehl, and Ms. Lisa Della Ripa for careful reading of the manuscript.
Supporting Information Available
The Supporting Information is available free of charge on the ACS Publications website at DOI: 10.1021/jacs.5b12974.
Uniform 2H magnetization transfer in 2H–13C adiabatic RESPIRATION CP (Figures S1, S2, and S3 and Table S1), Ala 2H one-pulse spectrum fit (Figure S4), GB1 2H line shape fits (Figure S5), Ala dynamics in GB1 (Table S2 and Figure S6), backbone order parameters derived from 2H measurement and CH dipolar measurement (Figure S7), GB1 2Hα η̅ values (Figure S8) (PDF)
The authors declare no competing financial interest.
Supplementary Material
References
- Teilum K.; Olsen J. G.; Kragelund B. B. Cell. Mol. Life Sci. 2009, 66, 2231–2247. 10.1007/s00018-009-0014-6. [DOI] [PMC free article] [PubMed] [Google Scholar]
- Henzler-Wildman K.; Kern D. Nature 2007, 450, 964–972. 10.1038/nature06522. [DOI] [PubMed] [Google Scholar]
- Reichert D.; Zinkevich T.; Saalwachter K.; Krushelnitsky A. J. Biomol. Struct. Dyn. 2012, 30, 617–627. 10.1080/07391102.2012.689695. [DOI] [PubMed] [Google Scholar]
- Kuzmanic A.; Pannu N. S.; Zagrovic B. Nat. Commun. 2014, 5, 3220. 10.1038/ncomms4220. [DOI] [PMC free article] [PubMed] [Google Scholar]
- McDermott A. Annu. Rev. Biophys. 2009, 38, 385–403. 10.1146/annurev.biophys.050708.133719. [DOI] [PubMed] [Google Scholar]
- Meirovitch E.; Shapiro Y. E.; Polimeno A.; Freed J. H. Prog. Nucl. Magn. Reson. Spectrosc. 2010, 56, 360–405. 10.1016/j.pnmrs.2010.03.002. [DOI] [PMC free article] [PubMed] [Google Scholar]
- Krushelnitsky A.; Reichert D.; Saalwachter K. Acc. Chem. Res. 2013, 46, 2028–2036. 10.1021/ar300292p. [DOI] [PubMed] [Google Scholar]
- Krushelnitsky A.; Reichert D. Prog. Nucl. Magn. Reson. Spectrosc. 2005, 47, 1–25. 10.1016/j.pnmrs.2005.04.001. [DOI] [Google Scholar]
- Watt E. D.; Rienstra C. M. Anal. Chem. 2014, 86, 58–64. 10.1021/ac403956k. [DOI] [PMC free article] [PubMed] [Google Scholar]
- Kay L. E. J. Magn. Reson. 2005, 173, 193–207. 10.1016/j.jmr.2004.11.021. [DOI] [PubMed] [Google Scholar]
- Kleckner I. R.; Foster M. P. Biochim. Biophys. Acta, Proteins Proteomics 2011, 1814, 942–968. 10.1016/j.bbapap.2010.10.012. [DOI] [PMC free article] [PubMed] [Google Scholar]
- Yang L. Q.; Sang P.; Tao Y.; Fu Y. X.; Zhang K. Q.; Xie Y. H.; Liu S. Q. J. Biomol. Struct. Dyn. 2014, 32, 372–393. 10.1080/07391102.2013.770372. [DOI] [PMC free article] [PubMed] [Google Scholar]
- Karplus M.; Kuriyan J. Proc. Natl. Acad. Sci. U. S. A. 2005, 102, 6679–6685. 10.1073/pnas.0408930102. [DOI] [PMC free article] [PubMed] [Google Scholar]
- Lam A. J.; St-Pierre F.; Gong Y.; Marshall J. D.; Cranfill P. J.; Baird M. A.; McKeown M. R.; Wiedenmann J.; Davidson M. W.; Schnitzer M. J.; Tsien R. Y.; Lin M. Z. Nat. Methods 2012, 9, 1005–1012. 10.1038/nmeth.2171. [DOI] [PMC free article] [PubMed] [Google Scholar]
- Schuler B. J. Nanobiotechnol. 2013, 11 (Suppl 1), S2. 10.1186/1477-3155-11-S1-S2. [DOI] [PMC free article] [PubMed] [Google Scholar]
- Nesmelov Y. E.; Thomas D. D. Biophys. Rev. 2010, 2, 91–99. 10.1007/s12551-010-0032-5. [DOI] [PMC free article] [PubMed] [Google Scholar]
- Fleissner M. R.; Bridges M. D.; Brooks E. K.; Cascio D.; Kalai T.; Hideg K.; Hubbell W. L. Proc. Natl. Acad. Sci. U. S. A. 2011, 108, 16241–16246. 10.1073/pnas.1111420108. [DOI] [PMC free article] [PubMed] [Google Scholar]
- Allerhand A.; Doddrell D.; Glushko V.; Cochran D. W.; Wenkert E.; Lawson P. J.; Gurd F. R. J. Am. Chem. Soc. 1971, 93, 544–546. 10.1021/ja00731a053. [DOI] [PubMed] [Google Scholar]
- Levy R. M.; Karplus M.; Mccammon J. A. J. Am. Chem. Soc. 1981, 103, 994–996. 10.1021/ja00394a072. [DOI] [Google Scholar]
- Deverell C.; Morgan R. E.; Strange J. H. Mol. Phys. 1970, 18, 553–559. 10.1080/00268977000100611. [DOI] [Google Scholar]
- Wittebort R. J.; Szabo A. J. Chem. Phys. 1978, 69, 1722. 10.1063/1.436748. [DOI] [Google Scholar]
- Carr H. Y.; Purcell E. M. Phys. Rev. 1954, 94, 630–638. 10.1103/PhysRev.94.630. [DOI] [Google Scholar]
- Luz Z.; Meiboom S. J. Chem. Phys. 1963, 39, 366–370. 10.1063/1.1734254. [DOI] [Google Scholar]
- Loria J. P.; Rance M.; Palmer A. G. J. Am. Chem. Soc. 1999, 121, 2331–2332. 10.1021/ja983961a. [DOI] [Google Scholar]
- Tolman J. R.; Flanagan J. M.; Kennedy M. A.; Prestegard J. H. Proc. Natl. Acad. Sci. U. S. A. 1995, 92, 9279–9283. 10.1073/pnas.92.20.9279. [DOI] [PMC free article] [PubMed] [Google Scholar]
- Saupe A.; Englert G. Phys. Rev. Lett. 1963, 11, 462–464. 10.1103/PhysRevLett.11.462. [DOI] [Google Scholar]
- Woodward C. K.; Hilton B. D. Annu. Rev. Biophys. Bioeng. 1979, 8, 99–127. 10.1146/annurev.bb.08.060179.000531. [DOI] [PubMed] [Google Scholar]
- Muhandiram D. R.; Yamazaki T.; Sykes B. D.; Kay L. E. J. Am. Chem. Soc. 1995, 117, 11536–11544. 10.1021/ja00151a018. [DOI] [Google Scholar]
- Gobl C.; Madl T.; Simon B.; Sattler M. Prog. Nucl. Magn. Reson. Spectrosc. 2014, 80, 26–63. 10.1016/j.pnmrs.2014.05.003. [DOI] [PubMed] [Google Scholar]
- Mittermaier A.; Kay L. E. Science 2006, 312, 224–228. 10.1126/science.1124964. [DOI] [PubMed] [Google Scholar]
- Sheppard D.; Sprangers R.; Tugarinov V. Prog. Nucl. Magn. Reson. Spectrosc. 2010, 56, 1–45. 10.1016/j.pnmrs.2009.07.004. [DOI] [PubMed] [Google Scholar]
- Göbl C.; Tjandra N. Entropy 2012, 14, 581–598. 10.3390/e14030581. [DOI] [Google Scholar]
- Li F.; Grishaev A.; Ying J.; Bax A. J. Am. Chem. Soc. 2015, 137, 14798–14811. 10.1021/jacs.5b10072. [DOI] [PMC free article] [PubMed] [Google Scholar]
- Im W.; Jo S.; Kim T. Biochim. Biophys. Acta, Biomembr. 2012, 1818, 252–262. 10.1016/j.bbamem.2011.07.048. [DOI] [PubMed] [Google Scholar]
- Hu F.; Luo W.; Hong M. Science 2010, 330, 505–508. 10.1126/science.1191714. [DOI] [PMC free article] [PubMed] [Google Scholar]
- Bocian D. F.; Chan S. I. Annu. Rev. Phys. Chem. 1978, 29, 307–335. 10.1146/annurev.pc.29.100178.001515. [DOI] [Google Scholar]
- Lewandowski J. R.; Sass H. J.; Grzesiek S.; Blackledge M.; Emsley L. J. Am. Chem. Soc. 2011, 133, 16762–16765. 10.1021/ja206815h. [DOI] [PubMed] [Google Scholar]
- Mollica L.; Baias M.; Lewandowski J. R.; Wylie B. J.; Sperling L. J.; Rienstra C. M.; Emsley L.; Blackledge M. J. Phys. Chem. Lett. 2012, 3, 3657–3662. 10.1021/jz3016233. [DOI] [PubMed] [Google Scholar]
- Lewandowski J. R. Acc. Chem. Res. 2013, 46, 2018–2027. 10.1021/ar300334g. [DOI] [PubMed] [Google Scholar]
- Krushelnitsky A.; Zinkevich T.; Reif B.; Saalwachter K. J. Magn. Reson. 2014, 248, 8–12. 10.1016/j.jmr.2014.09.007. [DOI] [PubMed] [Google Scholar]
- Lewandowski J. R.; Halse M. E.; Blackledge M.; Emsley L. Science 2015, 348, 578–581. 10.1126/science.aaa6111. [DOI] [PubMed] [Google Scholar]
- Tollinger M.; Sivertsen A. C.; Meier B. H.; Ernst M.; Schanda P. J. Am. Chem. Soc. 2012, 134, 14800–14807. 10.1021/ja303591y. [DOI] [PMC free article] [PubMed] [Google Scholar]
- Agarwal V.; Xue Y.; Reif B.; Skrynnikov N. R. J. Am. Chem. Soc. 2008, 130, 16611–16621. 10.1021/ja804275p. [DOI] [PubMed] [Google Scholar]
- Haller J. D.; Schanda P. J. Biomol. NMR 2013, 57, 263–280. 10.1007/s10858-013-9787-x. [DOI] [PMC free article] [PubMed] [Google Scholar]
- Chevelkov V.; Xue Y.; Linser R.; Skrynnikov N. R.; Reif B. J. Am. Chem. Soc. 2010, 132, 5015–5017. 10.1021/ja100645k. [DOI] [PubMed] [Google Scholar]
- Hohwy M.; Jaroniec C. P.; Reif B.; Rienstra C. M.; Griffin R. G. J. Am. Chem. Soc. 2000, 122, 3218–3219. 10.1021/ja9913737. [DOI] [Google Scholar]
- Vinogradov E.; Madhu P. K.; Vega S. J. Chem. Phys. 2001, 115, 8983. 10.1063/1.1408287. [DOI] [Google Scholar]
- Gullion T.; Schaefer J. J. Magn. Reson. 1989, 81, 196–200. 10.1016/0022-2364(89)90280-1. [DOI] [Google Scholar]
- Gullion T.; Schaefer J. Adv. Magn. Opt. Reson. 1989, 13, 57–83. 10.1016/B978-0-12-025513-9.50009-4. [DOI] [Google Scholar]
- Jaroniec C. P.; Tounge B. A.; Rienstra C. M.; Herzfeld J.; Griffin R. G. J. Magn. Reson. 2000, 146, 132–139. 10.1006/jmre.2000.2128. [DOI] [PubMed] [Google Scholar]
- Schanda P.; Meier B. H.; Ernst M. J. Magn. Reson. 2011, 210, 246–259. 10.1016/j.jmr.2011.03.015. [DOI] [PubMed] [Google Scholar]
- Dvinskikh S. V.; Zimmermann H.; Maliniak A.; Sandström D. J. Magn. Reson. 2003, 164, 165–170. 10.1016/S1090-7807(03)00180-0. [DOI] [PubMed] [Google Scholar]
- Dvinskikh S. V.; Zimmermann H.; Maliniak A.; Sandstrom D. J. Chem. Phys. 2005, 122, 44512. 10.1063/1.1834569. [DOI] [PubMed] [Google Scholar]
- Levitt M. H. In Encyclopedia of Nuclear Magnetic Resonance; Grant D. M., Harris R. K., Eds.; John Wiley & Sons: Chichester U.K., 2002; Vol. 9, pp 165–196. [Google Scholar]
- Lorieau J. L.; Day L. A.; McDermott A. E. Proc. Natl. Acad. Sci. U. S. A. 2008, 105, 10366–10371. 10.1073/pnas.0800405105. [DOI] [PMC free article] [PubMed] [Google Scholar]
- Lorieau J. L.; McDermott A. E. J. Am. Chem. Soc. 2006, 128, 11505–11512. 10.1021/ja062443u. [DOI] [PubMed] [Google Scholar]
- Zhao X.; Sudmeier J. L.; Bachovchin W. W.; Levitt M. H. J. Am. Chem. Soc. 2001, 123, 11097–11098. 10.1021/ja016328p. [DOI] [PubMed] [Google Scholar]
- Schanda P.; Meier B. H.; Ernst M. J. Am. Chem. Soc. 2010, 132, 15957–15967. 10.1021/ja100726a. [DOI] [PubMed] [Google Scholar]
- Yang J.; Tasayco M. L.; Polenova T. J. Am. Chem. Soc. 2009, 131, 13690–13702. 10.1021/ja9037802. [DOI] [PMC free article] [PubMed] [Google Scholar]
- Chevelkov V.; Fink U.; Reif B. J. Am. Chem. Soc. 2009, 131, 14018–14022. 10.1021/ja902649u. [DOI] [PubMed] [Google Scholar]
- Meirovitch E.; Liang Z.; Freed J. H. J. Phys. Chem. B 2015, 119, 2857–2868. 10.1021/jp511386b. [DOI] [PMC free article] [PubMed] [Google Scholar]
- Torchia D. A. Annu. Rev. Biophys. Bioeng. 1984, 13, 125–144. 10.1146/annurev.bb.13.060184.001013. [DOI] [PubMed] [Google Scholar]
- Torchia D. A.; Szabo A. J. Magn. Reson. 1982, 49, 107–121. 10.1016/0022-2364(82)90301-8. [DOI] [Google Scholar]
- Olympia P. L.; Wei I. Y.; Fung B. M. J. Chem. Phys. 1969, 51, 1610–1614. 10.1063/1.1672220. [DOI] [Google Scholar]
- Hologne M.; Chevelkov V.; Reif B. Prog. Nucl. Magn. Reson. Spectrosc. 2006, 48, 211–232. 10.1016/j.pnmrs.2006.05.004. [DOI] [Google Scholar]
- Jelinski L. W. Annu. Rev. Mater. Sci. 1985, 15, 359–377. 10.1146/annurev.ms.15.080185.002043. [DOI] [Google Scholar]
- Hologne M.; Hirschinger J. Solid State Nucl. Magn. Reson. 2004, 26, 1–10. 10.1016/S0926-2040(03)00062-6. [DOI] [PubMed] [Google Scholar]
- Batchelder L. S.; Niu C. H.; Torchia D. A. J. Am. Chem. Soc. 1983, 105, 2228–2231. 10.1021/ja00346a021. [DOI] [Google Scholar]
- Pines A.; Gibby M. G.; Waugh J. S. J. Chem. Phys. 1973, 59, 569–590. 10.1063/1.1680061. [DOI] [Google Scholar]
- Hartmann S. R.; Hahn E. L. Phys. Rev. 1962, 128, 2042–2053. 10.1103/PhysRev.128.2042. [DOI] [Google Scholar]
- Hologne M.; Chen Z.; Reif B. J. Magn. Reson. 2006, 179, 20–28. 10.1016/j.jmr.2005.10.014. [DOI] [PubMed] [Google Scholar]
- Shi X.; Yarger J. L.; Holland G. P. J. Magn. Reson. 2013, 226, 1–12. 10.1016/j.jmr.2012.10.013. [DOI] [PubMed] [Google Scholar]
- Hologne M.; Faelber K.; Diehl A.; Reif B. J. Am. Chem. Soc. 2005, 127, 11208–11209. 10.1021/ja051830l. [DOI] [PubMed] [Google Scholar]
- Shi X.; Yarger J. L.; Holland G. P. Chem. Commun. 2014, 50, 4856–4859. 10.1039/c4cc00971a. [DOI] [PubMed] [Google Scholar]
- Shi X.; Holland G. P.; Yarger J. L. Biomacromolecules 2015, 16, 852–859. 10.1021/bm5017578. [DOI] [PubMed] [Google Scholar]
- Wei D.; Akbey U. m.; Paaske B.; Oschkinat H.; Reif B.; Bjerring M.; Nielsen N. C. J. Phys. Chem. Lett. 2011, 2, 1289–1294. 10.1021/jz200511b. [DOI] [PubMed] [Google Scholar]
- Nielsen A. B.; Jain S.; Ernst M.; Meier B. H.; Nielsen N. C. J. Magn. Reson. 2013, 237, 147–151. 10.1016/j.jmr.2013.09.002. [DOI] [PubMed] [Google Scholar]
- Jain S.; Bjerring M.; Nielsen N. C. J. Phys. Chem. Lett. 2012, 3, 703–708. 10.1021/jz3000905. [DOI] [PubMed] [Google Scholar]
- Jain S. K.; Nielsen A. B.; Hiller M.; Handel L.; Ernst M.; Oschkinat H.; Akbey U.; Nielsen N. C. Phys. Chem. Chem. Phys. 2014, 16, 2827–2830. 10.1039/c3cp54419b. [DOI] [PubMed] [Google Scholar]
- Hohwy M.; Rienstra C. M.; Griffin R. G. J. Chem. Phys. 2002, 117, 4973–4987. 10.1063/1.1488136. [DOI] [Google Scholar]
- Hohwy M.; Rienstra C. M.; Jaroniec C. P.; Griffin R. G. J. Chem. Phys. 1999, 110, 7983–7992. 10.1063/1.478702. [DOI] [Google Scholar]
- Mittermaier A.; Kay L. E. J. Am. Chem. Soc. 1999, 121, 10608–10613. 10.1021/ja9925047. [DOI] [Google Scholar]
- Sheppard D.; Li D. W.; Bruschweiler R.; Tugarinov V. J. Am. Chem. Soc. 2009, 131, 15853–15865. 10.1021/ja9063958. [DOI] [PMC free article] [PubMed] [Google Scholar]
- Franks W. T.; Zhou D. H.; Wylie B. J.; Money B. G.; Graesser D. T.; Frericks H. L.; Sahota G.; Rienstra C. M. J. Am. Chem. Soc. 2005, 127, 12291–12305. 10.1021/ja044497e. [DOI] [PubMed] [Google Scholar]
- Van Geet A. L. Anal. Chem. 1968, 40, 2227–2229. 10.1021/ac50158a064. [DOI] [Google Scholar]
- Ernst M.; Samoson A.; Meier B. H. J. Magn. Reson. 2003, 163, 332–339. 10.1016/S1090-7807(03)00155-1. [DOI] [PubMed] [Google Scholar]
- Shaka A. J.; Keeler J.; Freeman R. J. Magn. Reson. 1983, 53, 313–340. 10.1016/0022-2364(83)90035-5. [DOI] [Google Scholar]
- Delaglio F.; Grzesiek S.; Vuister G. W.; Zhu G.; Pfeifer J.; Bax A. J. Biomol. NMR 1995, 6, 277–293. 10.1007/BF00197809. [DOI] [PubMed] [Google Scholar]
- Massiot D.; Fayon F.; Capron M.; King I.; Le Calve S.; Alonso B.; Durand J. O.; Bujoli B.; Gan Z. H.; Hoatson G. Magn. Reson. Chem. 2002, 40, 70–76. 10.1002/mrc.984. [DOI] [Google Scholar]
- Schmidt H. L. F.; Sperling L. J.; Gao Y. G.; Wylie B. J.; Boettcher J. M.; Wilson S. R.; Rienstra C. A. J. Phys. Chem. B 2007, 111, 14362–14369. 10.1021/jp075531p. [DOI] [PMC free article] [PubMed] [Google Scholar]
- Wylie B. J.; Sperling L. J.; Nieuwkoop A. J.; Franks W. T.; Oldfield E.; Rienstra C. M. Proc. Natl. Acad. Sci. U. S. A. 2011, 108, 16974–16979. 10.1073/pnas.1103728108. [DOI] [PMC free article] [PubMed] [Google Scholar]
- Schmidt H. L.; Shah G. J.; Sperling L. J.; Rienstra C. M. J. Phys. Chem. Lett. 2010, 1, 1623–1628. 10.1021/jz1004413. [DOI] [PMC free article] [PubMed] [Google Scholar]
- Salonen L. M.; Ellermann M.; Diederich F. Angew. Chem., Int. Ed. 2011, 50, 4808–4842. 10.1002/anie.201007560. [DOI] [PubMed] [Google Scholar]
- Eswar N.; Ramakrishnan C. Protein Eng., Des. Sel. 2000, 13, 227–238. 10.1093/protein/13.4.227. [DOI] [PubMed] [Google Scholar]
- Vijayakumar M.; Qian H.; Zhou H. X. Proteins: Struct., Funct., Genet. 1999, 34, 497–507. 10.1002/(SICI)1097-0134(19990301)34:4<497::AID-PROT9>3.0.CO;2-G. [DOI] [PubMed] [Google Scholar]
- Vugmeyster L.; Ostrovsky D.; Lipton A. S. J. Phys. Chem. B 2013, 117, 6129–6137. 10.1021/jp4021596. [DOI] [PubMed] [Google Scholar]
- Ottiger M.; Bax A. J. Am. Chem. Soc. 1999, 121, 4690–4695. 10.1021/ja984484z. [DOI] [Google Scholar]
- Iijima T.; Tsuchiya S. J. Mol. Spectrosc. 1972, 44, 88–107. 10.1016/0022-2852(72)90194-4. [DOI] [Google Scholar]
- Mittermaier A.; Kay L. E.; Forman-Kay J. D. J. Biomol. NMR 1999, 13, 181–185. 10.1023/A:1008387715167. [DOI] [PubMed] [Google Scholar]
- Sarkar S. K.; Young P. E.; Torchia D. A. J. Am. Chem. Soc. 1986, 108, 6459–6464. 10.1021/ja00281a002. [DOI] [Google Scholar]
- Barchi J. J. Jr.; Grasberger B.; Gronenborn A. M.; Clore G. M. Protein Sci. 1994, 3, 15–21. 10.1002/pro.5560030103. [DOI] [PMC free article] [PubMed] [Google Scholar]
- Seewald M. J.; Pichumani K.; Stowell C.; Tibbals B. V.; Regan L.; Stone M. J. Protein Sci. 2000, 9, 1177–1193. 10.1110/ps.9.6.1177. [DOI] [PMC free article] [PubMed] [Google Scholar]
- Idiyatullin D.; Nesmelova I.; Daragan V. A.; Mayo K. H. Protein Sci. 2003, 12, 914–922. 10.1110/ps.0228703. [DOI] [PMC free article] [PubMed] [Google Scholar]
- Schanda P.; Huber M.; Boisbouvier J.; Meier B. H.; Ernst M. Angew. Chem., Int. Ed. 2011, 50, 11005–11009. 10.1002/anie.201103944. [DOI] [PubMed] [Google Scholar]
- Derrick J. P.; Wigley D. B. Nature 1992, 359, 752–754. 10.1038/359752a0. [DOI] [PubMed] [Google Scholar]
- Gronenborn A. M.; Clore G. M. J. Mol. Biol. 1993, 233, 331–335. 10.1006/jmbi.1993.1514. [DOI] [PubMed] [Google Scholar]
- Lian L. Y.; Barsukov I. L.; Derrick J. P.; Roberts G. C. K. Nat. Struct. Biol. 1994, 1, 355–357. 10.1038/nsb0694-355. [DOI] [PubMed] [Google Scholar]
- Lamley J. M.; Iuga D.; Oster C.; Sass H. J.; Rogowski M.; Oss A.; Past J.; Reinhold A.; Grzesiek S.; Samoson A.; Lewandowski J. R. J. Am. Chem. Soc. 2014, 136, 16800–16806. 10.1021/ja5069992. [DOI] [PubMed] [Google Scholar]
- Kato K.; Lian L. Y.; Barsukov I. L.; Derrick J. P.; Kim H. H.; Tanaka R.; Yoshino A.; Shiraishi M.; Shimada I.; Arata Y.; Roberts G. C. K. Structure 1995, 3, 79–85. 10.1016/S0969-2126(01)00136-8. [DOI] [PubMed] [Google Scholar]
- Wand A. J. Curr. Opin. Struct. Biol. 2013, 23, 75–81. 10.1016/j.sbi.2012.11.005. [DOI] [PMC free article] [PubMed] [Google Scholar]
- Marlow M. S.; Dogan J.; Frederick K. K.; Valentine K. G.; Wand A. J. Nat. Chem. Biol. 2010, 6, 352–358. 10.1038/nchembio.347. [DOI] [PMC free article] [PubMed] [Google Scholar]
- Frederick K. K.; Marlow M. S.; Valentine K. G.; Wand A. J. Nature 2007, 448, 325–329. 10.1038/nature05959. [DOI] [PMC free article] [PubMed] [Google Scholar]
- Lee A. L.; Wand A. J. Nature 2001, 411, 501–504. 10.1038/35078119. [DOI] [PubMed] [Google Scholar]
Associated Data
This section collects any data citations, data availability statements, or supplementary materials included in this article.