

A rapid technique for quantitative abdominal imaging was developed by using a fast imaging with steady-state free precession MR fingerprinting acquisition in combination with the Bloch-Siegert B1 mapping method, allowing simultaneous quantification of T1 and T2 in the abdomen within a 19-second breath hold.
Abstract
Purpose
To develop a magnetic resonance (MR) “fingerprinting” technique for quantitative abdominal imaging.
Materials and Methods
This HIPAA-compliant study had institutional review board approval, and informed consent was obtained from all subjects. To achieve accurate quantification in the presence of marked B0 and B1 field inhomogeneities, the MR fingerprinting framework was extended by using a two-dimensional fast imaging with steady-state free precession, or FISP, acquisition and a Bloch-Siegert B1 mapping method. The accuracy of the proposed technique was validated by using agarose phantoms. Quantitative measurements were performed in eight asymptomatic subjects and in six patients with 20 focal liver lesions. A two-tailed Student t test was used to compare the T1 and T2 results in metastatic adenocarcinoma with those in surrounding liver parenchyma and healthy subjects.
Results
Phantom experiments showed good agreement with standard methods in T1 and T2 after B1 correction. In vivo studies demonstrated that quantitative T1, T2, and B1 maps can be acquired within a breath hold of approximately 19 seconds. T1 and T2 measurements were compatible with those in the literature. Representative values included the following: liver, 745 msec ± 65 (standard deviation) and 31 msec ± 6; renal medulla, 1702 msec ± 205 and 60 msec ± 21; renal cortex, 1314 msec ± 77 and 47 msec ± 10; spleen, 1232 msec ± 92 and 60 msec ± 19; skeletal muscle, 1100 msec ± 59 and 44 msec ± 9; and fat, 253 msec ± 42 and 77 msec ± 16, respectively. T1 and T2 in metastatic adenocarcinoma were 1673 msec ± 331 and 43 msec ± 13, respectively, significantly different from surrounding liver parenchyma relaxation times of 840 msec ± 113 and 28 msec ± 3 (P < .0001 and P < .01) and those in hepatic parenchyma in healthy volunteers (745 msec ± 65 and 31 msec ± 6, P < .0001 and P = .021, respectively).
Conclusion
A rapid technique for quantitative abdominal imaging was developed that allows simultaneous quantification of multiple tissue properties within one 19-second breath hold, with measurements comparable to those in published literature.
© RSNA, 2016
Introduction
Magnetic resonance (MR) imaging is traditionally qualitative, and underlying tissue properties, especially the relaxation times T1 and T2, which affect the signal of every MR image, are rarely measured. However, when they are obtained, quantitative measurements have the potential for usefulness in multiple clinical scenarios, such as differentiating cirrhotic from noncirrhotic liver (1), providing surrogate markers of function in native and transplanted kidneys (2), hepatic lesion characterization (3–5), and assessment of response to treatment (6,7). However, quantitative MR imaging is often an inefficient process, because multiple weighted images are needed to generate a single map, and can be extremely challenging in moving regions, such as the abdomen. Presently, in most clinical scenarios, it is not time efficient to map a physical property rather than examine a single image weighted by that property. The need for quantitative property mapping must be proven for each clinical scenario, and this can also be challenging because of acquisition time constraints.
Recently, a new approach, namely, MR “fingerprinting,” was introduced to simultaneously measure several important properties in a single examination (8). MR fingerprinting uses an acquisition in which imaging unit settings are allowed to vary greatly in a seemingly random manner to generate incoherent magnetization signals. To process these signals, Bloch simulations are first used to generate a dictionary of signal evolutions from all possible property values. A template-matching algorithm is then applied to identify the closest signal evolution for each pixel, thereby yielding the property values for the pixel. Work in the brain has shown that accurate quantification of proton density (M0) and T1 and T2 relaxation times can be achieved in less than 10 seconds, which opens the door to rapid quantitative analysis of pathologic conditions in a multiproperty space (9).
Although it has shown great promise in stationary brain imaging, quantitative parameter measurement in the abdomen is even more challenging. In extending the MR fingerprinting technique from brain to abdominal imaging, physiologic motion is a major concern, and an efficient measurement that can be completed within a clinically feasible breath hold is needed. Second, achieving sufficient spatial resolution to detect small lesions is challenging in abdominal imaging, as very large fields of view (FOVs) (40–50 cm) are needed for coverage of large or spatially diffuse organs such as the liver and bowel. Finally, because of the large FOV requirements, substantial challenges for quantitative imaging are expected from both static (B0) and transmit (B1) magnetic field inhomogeneities, which are particularly problematic at high field strengths (3.0 T and beyond). The goal of this study was to develop an MR fingerprinting technique for quantitative abdominal imaging.
Materials and Methods
The authors receive research grant support from Siemens Healthcare (Erlangen, Germany). They hold patents for MR fingerprinting technology, which has been licensed by Siemens. The authors had full control of the research and all data presented here, and no influence on the content was exerted by Siemens Healthcare. This prospective study was approved by the institutional review board and was compliant with the Health Insurance Portability and Accountability Act. Informed written consent was obtained from all volunteers before the MR imaging examinations.
Data Acquisition for Abdominal MR Fingerprinting
MR imaging experiments were performed with a 3.0-T imaging unit (Skyra; Siemens Healthcare). The original MR fingerprinting acquisition proposed for brain imaging was based on an inversion-recovery balanced steady-state free precession (bSSFP) pulse sequence. However, magnetic field inhomogeneities are a major problem for bSSFP-based sequences for abdominal MR imaging at 3.0 T. Thus, an alternative MR fingerprinting method based on another steady-state sequence, namely, fast imaging with steady-state free precession (FISP), was used (10). For FISP MR fingerprinting, an adiabatic inversion pulse was applied first, followed by a FISP data acquisition with pseudorandomized repetition times and flip angles (Fig 1, A and B) (8,10). Although 82 914 possible signal time courses are in the MR fingerprinting dictionary, several simulated signal evolution curves from five abdominal tissues (based on known T1 and T2 for these tissues) are shown in Figure 1, C. Because these tissues have different characteristic T1 and T2 values (11), different signal evolution patterns were observed, which provided the basis for using the MR fingerprinting algorithm to differentiate various tissue types in the abdomen.
Figure 1:

A–C, Simulation of signal evolution curves for FISP MR fingerprinting. A, B, Example of first 500 points of repetition time (TR) and flip angle patterns. C, Signal evolution curves for multiple tissues in the abdomen created by using the patterns in, A and B. T1 and T2 values, respectively, used to generate the curves included 1140 and 75 msec for the renal cortex, 1540 and 80 msec for the renal medulla, 820 and 35 msec for the liver, 720 and 45 msec for the pancreas, and 400 and 70 msec for fat (11).
To accelerate data sampling, highly undersampled images were acquired with a fast spiral readout. With the minimum-time gradient design method, 48 spiral interleaves with zero moment gradient compensation were designed for a two-dimensional image to meet the Nyquist criteria. The maximum gradient amplitude and slew rate were 21 mT/m and 162 mT/m/msec, respectively. To achieve a fast signal readout for the enlarged FOV of abdominal imaging, a uniform-density spiral trajectory was used instead of the variable-density spiral trajectory introduced in the original MR fingerprinting method (8). With the same spatial coverage (44 cm) and resolution (2 mm), the readout time was reduced from 6.2 to 2.9 msec for each spiral interleaf. The designed trajectory was measured by using the method proposed by Duyn et al (12) with a doped water phantom. For FISP MR fingerprinting, only one spiral interleaf was actually used to generate each image (acceleration factor, 48), which resulted in highly aliased images. A total of 2500 spiral arms, and thus 2500 undersampled images, were acquired in 17 seconds; the spiral interleaf in each image was rotated 7.5° to provide different spatial encoding. Other imaging parameters were as follows: FOV, 44 × 44 cm; matrix size, 224 × 224 (for an effective in-plane resolution of 1.9 mm); echo time, 1.3 msec; section thickness, 5 mm (single-section two-dimensional acquisition); and radiofrequency pulse, 1-msec sinc pulse (time-bandwidth product, 4).
A major concern in the application of FISP MR fingerprinting for high-field-strength abdominal imaging is the transmit field (B1) inhomogeneities encountered over the large FOV. In this study, a transmit field (B1) map was acquired by using the Bloch-Siegert technique within the same breath hold used for the FISP MR fingerprinting acquisition (13). For fast imaging purposes and for the reduction of specific absorption rate, a gradient-echo–based Bloch-Siegert sequence was implemented with a multi-shot spiral acquisition (24 spiral interleaves for each image). Two images were acquired with ± 4 kHz frequency off-resonance in an interleaved manner; the total acquisition time for a B1 map was 1.8 seconds.
Image Reconstruction and Processing
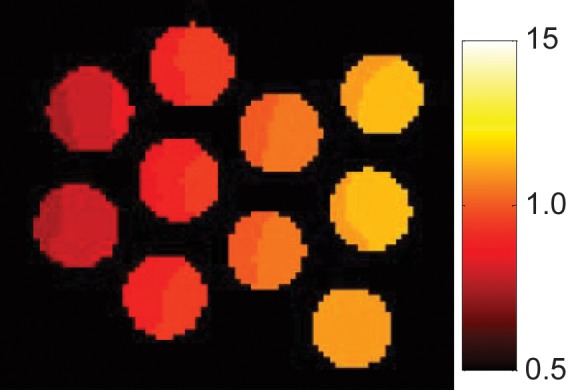
Image reconstruction and postprocessing were performed offline in Matlab (Mathworks, Natick, Mass). To retrieve tissue properties (T1, T2, and M0) from the FISP MR fingerprinting experiment, a dictionary that included the signal evolutions from all possible combinations of parameters for a T1 range of 100–3000 msec, a T2 range of 5–500 msec, and a B1 range of 10%–200% of the nominal value was calculated by using Bloch simulations (14). B1 was simulated as a ratio of obtained flip angle divided by the nominal (expected) flip angle and thus was unitless. A perfect agreement between obtained and expected flip angle would be expected to give a ratio of 1.
The detailed ranges and step sizes used for T1, T2, and B1 in the calculation are presented in Table 1. Step sizes are defined as the incremental changes in T1, T2, or B1 between adjacent entries in the simulated dictionary. The acquired signal in each pixel of highly accelerated images was then matched to those entries in the dictionary that had the same B1 values as measured (Fig 2). One best entry was identified by using the same method used in the original MR fingerprinting implementation (8), which in turn yielded all underlying parameters that were used to form the dictionary entry. The original MR fingerprinting reconstruction without the B1 correction (assuming a uniform B1 map of 1) was also performed as a comparison. The calculation time for parameter mapping of one section was about 3 minutes with a standard desktop computer (Xeon E3–1270 quad-core central processing units at 3.4 GHz and 16 GB of random-access memory; Intel, Santa Clara, Calif).
Table 1.
Ranges and Step Sizes for T1, T2, and B1 in the Dictionary
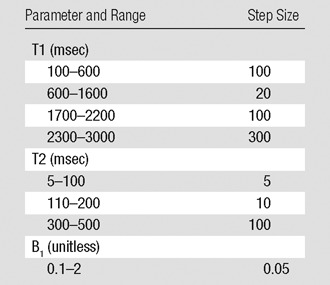
Figure 2:

Diagram for the FISP MR fingerprinting (MRF) analysis with the inclusion of B1 correction. FA = flip angle, TR = repetition time.
Phantom Studies
The accuracy of the FISP MR fingerprinting method was first validated by using an agarose gel phantom. Because phantom experiments typically have a uniform transmit B1 field, a tuned transmit surface coil passively coupled to the body coil was used for the FISP MR fingerprinting measurement to purposely generate a nonuniform B1 field. T1 and T2 relaxation times obtained from the FISP MR fingerprinting measurements (with or without consideration of the induced B1 field) were then compared with reference T1 and T2 values obtained by using standard single-echo spin-echo sequences. Reference T1 values were established by using an inversion-recovery single-echo spin-echo sequence with a repetition time of 6 seconds and seven inversion times from 50 to 3800 msec. Reference T2 values were measured by using a single-echo spin-echo sequence with a repetition time of 6 seconds and eight echo times from 20 to 800 msec.
In Vivo Studies
After phantom validation, quantitative measurements with FISP MR fingerprinting were obtained in eight asymptomatic subjects (three men [mean age, 22 years; range, 19–23 years] and five women [mean age, 25 years; range, 19–43 years]) and six patients (four men [mean age, 60 years; range, 53–69 years] and two women [mean age, 58 years; range, 46–69 years]) with metastatic adenocarcinoma and a total of 20 lesions. For each asymptomatic subject, the FISP MR fingerprinting and B1 measurements were performed at one to three different section locations in the axial orientation. For each section, the two acquisitions (FISP MR fingerprinting and B1) were performed consecutively in a single breath hold of approximately 19 seconds to ensure the same section coverage. For the examinations in patients, the sections were prescribed at the location of liver lesions on coronal T2-weighted images or on the basis of findings at previous MR imaging studies.
Statistical Analysis
A two-tailed Student t test was used to compare the T1 and T2 results obtained in eight healthy subjects and in six patients with metastatic adenocarcinoma. Normal distributions for each population and each relaxation property were verified. P < .05 was considered to indicate a significant difference.
Results
Figure 3 presents the T1, T2, and proton density maps acquired in phantom studies in which the FISP MR fingerprinting method was used before and after B1 correction. With the additional surface coil–induced transmit inhomogeneity, a maximum of 45% change in B1 magnitude was observed, which is similar in scale to the B1 variation observed in in vivo abdominal measurements (15,16). Unlike conventional methods, which typically show a dependence of T1 on B1, our phantom results consistently showed a dependence of T2 on B1 without correction. However, after B1 correction, both T1 and T2 values were in improved agreement with values acquired by using the reference-standard measurement. The average T2 deviations from the reference standard were 18.4 msec ± 10.6 (range, 4.0–34.3 msec) before correction and 8.3 msec ± 4.4 (range, 0.8–15.0 msec) after correction.
Figure 3a:

(a) Phantom T1, T2, and proton density (M0) maps acquired by using the FISP MR fingerprinting method before and after B1 correction. (b) B1 map for the phantoms. Although a close match in the T1 maps was observed before and after B1 correction, substantial changes in the T2 map were noticed after B1 correction. (c, d) Graphs show comparison of T1 (c) and T2 (d) values obtained with the FISP MR fingerprinting method and those obtained with the reference method.
Figure 3b:
(a) Phantom T1, T2, and proton density (M0) maps acquired by using the FISP MR fingerprinting method before and after B1 correction. (b) B1 map for the phantoms. Although a close match in the T1 maps was observed before and after B1 correction, substantial changes in the T2 map were noticed after B1 correction. (c, d) Graphs show comparison of T1 (c) and T2 (d) values obtained with the FISP MR fingerprinting method and those obtained with the reference method.
Figure 3c:

(a) Phantom T1, T2, and proton density (M0) maps acquired by using the FISP MR fingerprinting method before and after B1 correction. (b) B1 map for the phantoms. Although a close match in the T1 maps was observed before and after B1 correction, substantial changes in the T2 map were noticed after B1 correction. (c, d) Graphs show comparison of T1 (c) and T2 (d) values obtained with the FISP MR fingerprinting method and those obtained with the reference method.
Figure 3d:

(a) Phantom T1, T2, and proton density (M0) maps acquired by using the FISP MR fingerprinting method before and after B1 correction. (b) B1 map for the phantoms. Although a close match in the T1 maps was observed before and after B1 correction, substantial changes in the T2 map were noticed after B1 correction. (c, d) Graphs show comparison of T1 (c) and T2 (d) values obtained with the FISP MR fingerprinting method and those obtained with the reference method.
Figure 4, A shows a representative image from 2500 images in a healthy volunteer. As expected, substantial aliasing artifacts are present because of the high acceleration factor of 48 for each image in the FISP MR fingerprinting acquisition. The corresponding B1 map for this section is shown in Figure 4, B. The three quantitative maps (T1, T2, and M0) obtained before and after B1 correction are shown in Figure 4, C–H, and the difference maps between them are shown in Figure 4, I–K. As in the phantom experiment, a more pronounced difference was seen in the T2 map (compared with the T1 map) after B1 correction, and the pattern of T2 difference matched well with that of the B1 map (Fig 4, B and J). Compared with the T2 map without B1 correction (Fig 4, D), a smoother T2 map was observed in the whole liver after B1 correction (Fig 4, G). Average T1 and T2 values of multiple abdominal organs acquired in the eight healthy subjects are presented in Table 2.
Figure 4:

A–K, Representative quantitative maps (T1, T2, M0) acquired in a healthy subject. A, A representative highly undersampled image shows marked aliasing artifacts (acceleration factor for each image, 48). B, B1 map. C–E, Quantitative maps (T1, T2, and M0) obtained without B1 correction. F–H, Quantitative maps obtained with B1 correction. I–K, Difference maps. A clear difference in the T2 map rather than the T1 map was observed after B1 correction, and the pattern of T2 difference matches well with that of the B1 map (in B).
Table 2.
Average T1 and T2 Relaxation Times of Abdominal Tissues Acquired in Healthy Subjects at 3.0 T

Note.—Data are means ± standard deviations.
*The liver T1 and T2 relaxation times were compared with patient data.
Figure 5 shows the quantitative MR fingerprinting maps and several conventional images acquired in a patient with metastatic lung adenocarcinoma. Two metastatic lesions (lesion 1, 33 mm; lesion 2, 10 mm) were observed in the liver on the basis of the quantitative MR fingerprinting results (Fig 5, D and E) corresponding to the lesions seen on the clinical computed tomographic (CT) and MR images (Fig 5, A and B). Compared with relaxation times in the healthy surrounding tissue, longer T1 relaxation times were observed for both metastatic lesions (lesion 1, 1462 msec; lesion 2, 1582 msec; surrounding tissue, 686 msec). Longer T2 was observed only in lesion 1, and not in lesion 2, as compared with the surrounding tissue (lesion 1, 57 msec; lesion 2, 19 msec; surrounding tissue, 26 msec). The mean T1 and T2 relaxation times in all 20 lesions in the six patients with metastatic adenocarcinoma were 1673 msec ± 331 and 43 msec ± 13, respectively—significantly higher than those in the surrounding liver parenchyma (T1, msec 840 ± 113 [P < .0001]; T2, 28 msec ± 3 [P < .01]) and in asymptomatic volunteers (Table 2) (P < .0001 for T1 and P = .021 for T2).
Figure 5:

Images acquired in a patient with lung adenocarcinoma metastatic to the liver. A, Conventional contrast material–enhanced T1-weighted MR image (three-dimensional fat-saturated gradient-echo; repetition time msec/echo time msec, 4.34/1.84; flip angle, 13°; FOV, 440 × 282 mm; matrix, 224 × 146; section thickness, 3 mm). B, CT image. C, Image summed from all undersampled images. D–F, Quantitative T1, T2, and M0 maps. Two metastatic lesions measuring 33 and 10 mm in diameter (arrows) on the T1 map were seen on both conventional images and quantitative maps.
Discussion
A variety of fast imaging techniques have been proposed for quantification of T1 and T2 relaxation times. However, most of the technologies focus on imaging stationary brain tissues. This work demonstrates simultaneous measurement of multiple physical properties for abdominal imaging. All property maps are coregistered, which aids in creating a multiproperty quantitative space for lesion characterization.
B1 inhomogeneity is a well-known problem in 3.0 T imaging and is thus expected to affect the accuracy of relaxation property mapping (15,16,19). While it is less of an issue for MR fingerprinting studies with brain imaging at 1.5 T or 3.0 T, it is well known that large variation in B1 is expected with abdominal imaging at 3.0 T because of the large FOV and increased dielectric effects. Thus, this issue must be accounted for in abdominal MR fingerprinting. In this study, we adopted the Bloch-Siegert technique, which has been shown to provide accurate and efficient B1 mapping that is insensitive to T1 and B0 field inhomogeneities (13). We further improved the efficiency of this technique by combining it with a fast spiral readout. The improved method provides a 12-fold acceleration in imaging time while preserving similar spatial resolution. Although the proposed technique was developed and validated at 3.0 T for the abdomen, the degree of B1 inhomogeneities encountered were similar to those encountered in the brain at 7.0 T. The proposed technique provides a method for measurements in the setting of severe B1 field inhomogeneities, adding to approaches such as parallel transmission (20).
An interesting finding in both our phantom and in vivo studies is that, unlike conventional methods, which typically show a dependence of T1 on the B1, the proposed FISP MR fingerprinting technique consistently exhibits a dependence of T2 on B1. This difference is likely due to the distinct T1 encoding algorithms used in the FISP MR fingerprinting technique. Most conventional T1 mapping methods, such as the variable flip angle method and the Look-Locker method (16,17), typically use either an inversion pulse or varying flip angles or repetition times as the only mechanism to encode T1 weighting. With FISP MR fingerprinting, the inversion pulse applied before the FISP readout train, as well as variable flip angles and repetition times, all contribute to impart T1 weighting, which results in a robust T1 quantification that is independent of B1.
The initial demonstration of the technique in six patients with focal liver lesions demonstrated that the method can provide localized quantitative information in settings of disease. The longer T1 and T2 relaxation times in metastatic lesions are consistent with previous clinical and preclinical findings (5,21,22). Recent studies have also investigated the possibility of using relaxation times to predict tumor response to treatment. Although T2 does not appear to be an early indicator of response (22), T1 does appear to be a promising indicator for predicting response to chemotherapy (6,7). Simultaneous mapping of properties also allows the creation of a multiproperty space to characterize pathologic conditions. The proposed FISP MR fingerprinting technique provides an ideal option for this type of analysis. The present patient examples offer a proof of concept, and studies with larger numbers of patients with different lesion types will be needed for more detailed comparisons with results in published literature and for application in open clinical questions, such as more definitive lesion characterization and monitoring response to therapy.
One limitation of the proposed method is two-dimensional acquisition, as extension to three-dimensional acquisition is still restricted by imaging speed. Further work combining this technology with acceleration techniques such as parallel imaging, iterative reconstruction, and multiband excitation is needed to facilitate volumetric coverage within a breath hold (23–25). Finally, validation experiments were conducted in phantoms and not in patients. Reference-standard long-spin-echo experiments would require breath holds that could not be provided by patients.
Further work also continues to expand the MR fingerprinting framework for obtaining measurements of other tissue properties, in addition to relaxation times. MR fingerprinting has been successfully used to obtain dynamic susceptibility contrast-enhanced perfusion images in the brain (26). Preliminary studies for obtaining diffusion and perfusion measurements simultaneously with relaxation property measurements have been reported (27,28).
In conclusion, a rapid technique for quantitative abdominal imaging was developed by using an FISP MR fingerprinting acquisition in combination with the Bloch-Siegert B1 mapping method, allowing simultaneous quantification of T1 and T2 in the abdomen within a 19-second breath hold.
Advances in Knowledge
■ A quantitative abdominal imaging technique based on the MR fingerprinting framework is introduced.
■ Despite the presence of B1 inhomogeneities, simultaneous quantification of T1 and T2 in the abdomen can be achieved within one breath hold of approximately 19 seconds (key mean tissue T1 and T2 measurements, respectively, were as follows: liver, 745 msec ± 65 [standard deviation] and 31 msec ± 6; renal medulla, 1702 msec ± 205 and 60 msec ± 21; renal cortex, 1314 msec ± 77 and 47 msec ± 10; spleen, 1232 msec ± 92 and 60 msec ± 19; skeletal muscle, 1100 msec ± 59 and 44 msec ± 9; and fat, 253 msec ± 42 and 77 msec ± 16).
■ T1 and T2 in metastatic adenocarcinoma were found to be 1673 msec ± 331 and 43 msec ± 13, respectively—significantly higher than those in surrounding liver parenchyma (T1, 840 msec ± 113; T2, 28 msec ± 3; P < .0001 and P < .01, respectively).
Implications for Patient Care
■ The technology of MR fingerprinting can be extended to abdominal imaging.
■ Relaxation times can be simultaneously mapped and applied for characterization of focal abdominal lesions or diffuse parenchymal diseases.
Received September 15, 2015; revision requested October 29; revision received November 6; accepted December 7; final version accepted December 11.
Supported by Siemens Healthcare.
Funding: This research was supported by the National Institutes of Health (grants 1R01DK098503, 1R01EB017219, 5R01EB016728, R00EB011527, and 2KL2TR000440).
Disclosures of Conflicts of Interest: Y.C. Activities related to the present article: received a grant from Siemens Healthcare. Activities not related to the present article: none to disclose. Other relationships: receives royalties from a patent for MR fingerprinting licensed to Siemens Healthcare. Y.J. Activities related to the present article: received a grant from Siemens Healthcare. Activities not related to the present article: none to disclose. Other relationships: receives royalties from a patent for MR fingerprinting licensed to Siemens Healthcare. S.P. Activities related to the present article: received a grant from Siemens Healthcare. Activities not related to the present article: none to disclose. D.M. Activities related to the present article: received a grant from Siemens Healthcare. Activities not related to the present article: none to disclose. Other relationships: receives royalties from a patent for MR fingerprinting licensed to Siemens Healthcare. L.L. Activities related to the present article: received a grant from Siemens Healthcare. Activities not related to the present article: none to disclose. Other relationships: none to disclose. M.D.T. Activities related to the present article: received a grant from Siemens Healthcare. Activities not related to the present article: none to disclose. Other relationships: none to disclose. K.L.W. Activities related to the present article: received a grant from Siemens Healthcare. Activities not related to the present article: none to disclose. Other relationships: receives royalties from a patent for MR fingerprinting licensed to Siemens Healthcare. N.S. Activities related to the present article: received a grant from Siemens Healthcare. Activities not related to the present article: none to disclose. Other relationships: receives royalties from a patent for MR fingerprinting licensed to Siemens Healthcare. M.A.G. Activities related to the present article: received a grant from Siemens Healthcare. Activities not related to the present article: none to disclose. Other relationships: receives royalties from a patent for MR fingerprinting licensed to Siemens Healthcare. V.G. Activities related to the present article: received a grant from Siemens Healthcare. Activities not related to the present article: none to disclose. Other relationships: receives royalties from a patent for MR fingerprinting licensed to Siemens Healthcare.
Abbreviations:
- FISP
- fast imaging with steady-state free precession
- FOV
- field of view
References
- 1.Kim KA, Park MS, Kim IS, et al. Quantitative evaluation of liver cirrhosis using T1 relaxation time with 3 tesla MRI before and after oxygen inhalation. J Magn Reson Imaging 2012;36(2):405–410. [DOI] [PubMed] [Google Scholar]
- 2.Huang Y, Sadowski EA, Artz NS, et al. Measurement and comparison of T1 relaxation times in native and transplanted kidney cortex and medulla. J Magn Reson Imaging 2011;33(5):1241–1247. [DOI] [PMC free article] [PubMed] [Google Scholar]
- 3.Fenlon HM, Tello R, deCarvalho VL, Yucel EK. Signal characteristics of focal liver lesions on double echo T2-weighted conventional spin echo MRI: observer performance versus quantitative measurements of T2 relaxation times. J Comput Assist Tomogr 2000;24(2):204–211. [DOI] [PubMed] [Google Scholar]
- 4.Tello R, Fenlon HM, Gagliano T, deCarvalho VL, Yucel EK. Prediction rule for characterization of hepatic lesions revealed on MR imaging: estimation of malignancy. AJR Am J Roentgenol 2001;176(4):879–884. [DOI] [PubMed] [Google Scholar]
- 5.Goldberg MA, Hahn PF, Saini S, et al. Value of T1 and T2 relaxation times from echoplanar MR imaging in the characterization of focal hepatic lesions. AJR Am J Roentgenol 1993;160(5):1011–1017. [DOI] [PubMed] [Google Scholar]
- 6.Jamin Y, Tucker ER, Poon E, et al. Evaluation of clinically translatable MR imaging biomarkers of therapeutic response in the TH-MYCN transgenic mouse model of neuroblastoma. Radiology 2013;266(1):130–140. [DOI] [PMC free article] [PubMed] [Google Scholar]
- 7.Weidensteiner C, Allegrini PR, Sticker-Jantscheff M, Romanet V, Ferretti S, McSheehy PM. Tumour T1 changes in vivo are highly predictive of response to chemotherapy and reflect the number of viable tumour cells: a preclinical MR study in mice. BMC Cancer 2014;14(1):88. [DOI] [PMC free article] [PubMed] [Google Scholar]
- 8.Ma D, Gulani V, Seiberlich N, et al. Magnetic resonance fingerprinting. Nature 2013;495(7440):187–192. [DOI] [PMC free article] [PubMed] [Google Scholar]
- 9.European Society of Radiology (ESR) . Magnetic resonance fingerprinting: a promising new approach to obtain standardized imaging biomarkers from MRI. Insights Imaging 2015;6(2):163–165. [DOI] [PMC free article] [PubMed] [Google Scholar]
- 10.Jiang Y, Ma D, Seiberlich N, Gulani V, Griswold MA. MR fingerprinting using fast imaging with steady state precession (FISP) with spiral readout. Magn Reson Med 2014 Dec 9. [Epub ahead of print] [DOI] [PMC free article] [PubMed]
- 11.de Bazelaire CMJ, Duhamel GD, Rofsky NM, Alsop DC. MR imaging relaxation times of abdominal and pelvic tissues measured in vivo at 3.0 T: preliminary results. Radiology 2004;230(3):652–659. [DOI] [PubMed] [Google Scholar]
- 12.Duyn JH, Yang Y, Frank JA, van der Veen JW. Simple correction method for k-space trajectory deviations in MRI. J Magn Reson 1998;132(1):150–153. [DOI] [PubMed] [Google Scholar]
- 13.Sacolick LI, Wiesinger F, Hancu I, Vogel MW. B1 mapping by Bloch-Siegert shift. Magn Reson Med 2010;63(5):1315–1322. [DOI] [PMC free article] [PubMed] [Google Scholar]
- 14.Gao Y, Chen Y, Ma D, et al. Preclinical MR fingerprinting (MRF) at 7 T: effective quantitative imaging for rodent disease models. NMR Biomed 2015;28(3):384–394. [DOI] [PMC free article] [PubMed] [Google Scholar]
- 15.Sung K, Daniel BL, Hargreaves BA. Transmit B1+ field inhomogeneity and T1 estimation errors in breast DCE-MRI at 3 tesla. J Magn Reson Imaging 2013;38(2):454–459. [DOI] [PMC free article] [PubMed] [Google Scholar]
- 16.Treier R, Steingoetter A, Fried M, Schwizer W, Boesiger P. Optimized and combined T1 and B1 mapping technique for fast and accurate T1 quantification in contrast-enhanced abdominal MRI. Magn Reson Med 2007;57(3):568–576. [DOI] [PubMed] [Google Scholar]
- 17.Chen Y, Lee GR, Aandal G, et al. Rapid volumetric T1 mapping of the abdomen using three-dimensional through-time spiral GRAPPA. Magn Reson Med 2015 May 18. [Epub ahead of print] [DOI] [PMC free article] [PubMed]
- 18.Stanisz GJ, Odrobina EE, Pun J, et al. T1, T2 relaxation and magnetization transfer in tissue at 3T. Magn Reson Med 2005;54(3):507–512. [DOI] [PubMed] [Google Scholar]
- 19.Brink WM, Gulani V, Webb AG. Clinical applications of dual-channel transmit MRI: A review. J Magn Reson Imaging 2015;42(4):855–869. [DOI] [PubMed] [Google Scholar]
- 20.Lattanzi R, Sodickson DK, Grant AK, Zhu Y. Electrodynamic constraints on homogeneity and radiofrequency power deposition in multiple coil excitations. Magn Reson Med 2009;61(2):315–334. [DOI] [PMC free article] [PubMed] [Google Scholar]
- 21.Gambarota G, Veltien A, van Laarhoven H, et al. Measurements of T1 and T2 relaxation times of colon cancer metastases in rat liver at 7 T. MAGMA 2004;17(3-6):281–287. [DOI] [PubMed] [Google Scholar]
- 22.Raza SA, Funicelli L, Sohaib SA, et al. Assessment of colorectal hepatic metastases by quantitative T2 relaxation time. Eur J Radiol 2012;81(4):e536–e540. [DOI] [PubMed] [Google Scholar]
- 23.Seiberlich N, Lee G, Ehses P, Duerk JL, Gilkeson R, Griswold M. Improved temporal resolution in cardiac imaging using through-time spiral GRAPPA. Magn Reson Med 2011;66(6):1682–1688. [DOI] [PMC free article] [PubMed] [Google Scholar]
- 24.Ye H, Ma D, Jiang Y, et al. Accelerating magnetic resonance fingerprinting (MRF) using t-blipped simultaneous multislice (SMS) acquisition. Magn Reson Med 2015 Jun 8. [Epub ahead of print] [DOI] [PMC free article] [PubMed]
- 25.Pierre EY, Ma D, Chen Y, Badve C, Griswold MA. Multiscale reconstruction for MR fingerprinting. Magn Reson Med 2015 Jun 30. [Epub ahead of print] [DOI] [PMC free article] [PubMed]
- 26.Christen T, Pannetier NA, Ni WW, et al. MR vascular fingerprinting: A new approach to compute cerebral blood volume, mean vessel radius, and oxygenation maps in the human brain. Neuroimage 2014;89:262–270. [DOI] [PMC free article] [PubMed] [Google Scholar]
- 27.Jiang Y, Ma D, Wright KL, Seiberlich N, Gulani V, Griswold MA. Simultaneous T1, T2, diffusion and proton density quantification with MR fingerprinting [abstr]. In: Proceedings of the Twenty-Second Meeting of the International Society for Magnetic Resonance in Medicine. Berkeley, Calif: International Society for Magnetic Resonance in Medicine, 2014; 28. [Google Scholar]
- 28.Wright KL, Ma D, Jiang Y, Gulani V, Griswold MA, Hernandez-Garcia L. Theoretical framework for MR fingerprinting with ASL: simultaneous quantification of CBF, transit time, and T1 [abstr]. In: Proceedings of the Twenty-Second Meeting of the International Society for Magnetic Resonance in Medicine. Berkeley, Calif: International Society for Magnetic Resonance in Medicine, 2014; 417. [Google Scholar]