

Summary
Thymic epithelial cells (TECs) are critically required for T cell development, but the cellular mechanisms that maintain adult TECs are poorly understood. Here, we show that a previously unidentified subpopulation, EpCam+UEA1−Ly-51+PLET1+MHC class IIhi, which comprises <0.5% of adult TECs, contains bipotent TEC progenitors that can efficiently generate both cortical (c) TECs and medullary (m) TECs. No other adult TEC population tested in this study contains this activity. We demonstrate persistence of PLET1+Ly-51+ TEC-derived cells for 9 months in vivo, suggesting the presence of thymic epithelial stem cells. Additionally, we identify cTEC-restricted short-term progenitor activity but fail to detect high efficiency mTEC-restricted progenitors in the adult thymus. Our data provide a phenotypically defined adult thymic epithelial progenitor/stem cell that is able to generate both cTECs and mTECs, opening avenues for improving thymus function in patients.
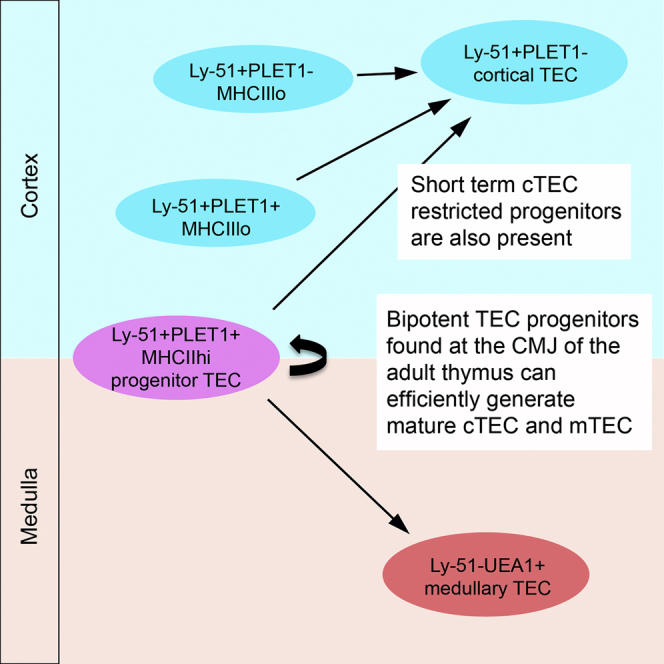
Graphical Abstract
Highlights
-
•
Adult PLET1+ TECs encompass PLET1+UEA1+Ly-51− mTECs and PLET1+Ly-51+UEA1− CMJ TECs
-
•
MHCIIhiPLET1+Ly-51+ TECs include bipotent progenitors that can generate mTECs and cTECs
-
•
Ly-51+ TECs also contain cTEC-restricted short-term progenitors
-
•
Progeny of PLET1+Ly-51+ TECs persist for 9 months in vivo, hinting at TEC stem cells
Thymic epithelial cells (TECs) are critically required for T cell development. Ulyanchenko et al. use clonal-level analysis to identify a phenotypically defined thymic epithelial progenitor cell type. This population comprises <0.5% of adult TECs and is able to generate both cortical and medullary TECs for ≥9 months in vivo.
Introduction
The differentiation and maturation of T cells is mediated largely by a diverse array of phenotypically and functionally distinct epithelial cell types (Ritter and Boyd, 1993, Nitta et al., 2008), which comprises a key component of the thymic stroma. Thymic epithelial cells (TECs) can be broadly categorized into two major sub-types—cortical (c) and medullary (m) TEC (Ritter and Boyd, 1993)—both of which are required for the development of a self-tolerant, self-restricted T cell repertoire. However, the cellular mechanisms that maintain the different TEC sub-lineages of the mature thymus and how these are affected by age to cause thymic involution remains poorly understood.
The thymus originates from the third pharyngeal pouches (3PP) of the pharyngeal endoderm (Gordon et al., 2004, Le Douarin and Jotereau, 1975), which give rise to the epithelial component of the thymic stroma; transplantation studies in avians and mice have shown that 3PP endoderm is sufficient to initiate formation of a fully functional and properly patterned thymus in an ectopic site (Gordon et al., 2004, Le Douarin and Jotereau, 1975). Strong evidence suggests that, during fetal development and in the perinatal thymus, a bipotent progenitor exists that can generate both cTEC and mTEC (Bennett et al., 2002, Gill et al., 2002, Bleul et al., 2006, Rossi et al., 2006). The existence of mTEC sub-lineage-restricted progenitors, that can generate AIRE+ mTEC (required for central tolerance) (Kyewski and Klein, 2006), has been demonstrated in the fetal thymus (Hamazaki et al., 2007, Sekai et al., 2014, Lopes et al., 2015) and a putative fetal cTEC-restricted progenitor has also been identified (Shakib et al., 2009). Regeneration of cTEC following early postnatal cTEC ablation has also been demonstrated (Rode and Boehm, 2012).
In the adult thymus, transplantation data indicate that MHC class IIlo (MHCIIlo) (Gray et al., 2007) and CD80− (Rossi et al., 2007c) mTEC can give rise to MHCIIhi and CD80hi mTEC, respectively, including AIRE+ cells. As MHCII and CD80 expression levels correlate directly in mTEC, this suggests that the MHCIIloCD80− population contains mTEC progenitors (Gray et al., 2007, Rossi et al., 2007c). Additionally, transplantation assay of bulk populations has shown that MHCIIlo cTECs contain the potential to generate both cTEC and mTEC (Wong et al., 2014). The existence of a common thymic epithelial progenitor cell (TEPC), as well as both cortical and medullary epithelial sub-lineage-restricted progenitors, has also been suggested by a limited retrospective clonal analysis of postnatal day 14 TEC (Bleul et al., 2006). The identity of these cell types was not determined. However, recent reports demonstrate that podoplanin+ TECs, which are located predominantly in the cortex and at the cortico-medullary junction (CMJ), contribute to postnatal mTEC maintenance (Onder et al., 2015), and although the thymoproteosome subunit β5t marks both cTEC and mTEC progenitors in the fetal and at least some cTEC progenitors in the early postnatal thymus, early postnatal mTEC progenitors are β5t-negative (Ohigashi et al., 2015, Mayer et al., 2015). Consistent with these data, an epithelial stem cell can be derived and clonally propagated from adult rat thymic epithelium and retains the capacity to contribute to the medullary thymic epithelial network, including generation of TECs expressing the autoimmune regulator AIRE (Bonfanti et al., 2010). The identity of the cells from which this in vitro stem cell population is established is unclear. Similarly, two recent papers have reported that thymic epithelial cultures can be established from individual initiator adult TECs and can make a limited contribution to medullary and cortical TEC networks upon transplantation (Wong et al., 2014, Ucar et al., 2014). However, although in one case it was demonstrated that the initiating cell was both EpCAM- and Foxn1-negative and had never expressed levels of Foxn1 high enough to drive physiologically relevant Cre activity (Ucar et al., 2014), the details of the identity of the initiating cell remained unclear. Of note is that the EpCam+UEA1−MHCIIlo population identified in the second report comprises almost 20% of all TECs (Wong et al., 2014). Indeed, difficulties associated with isolating and assaying defined, viable subpopulations of adult TECs have been a major factor hampering progress in this area, while lineage tracing in vivo has been precluded by the absence of TEC subset-specific markers.
The cell surface marker PLET1 has been shown via prospective isolation and functional testing by us and others to mark a population of TEPCs during early thymus development that is sufficient to generate an organized and functional thymus upon transplantation (Bennett et al., 2002, Gill et al., 2002, Rossi et al., 2007b). PLET1 is also expressed by defined epithelial cell populations in other organs and tissues including the skin, where it has been demonstrated to mark a subset of epithelial stem cells (Depreter et al., 2008, Nijhof et al., 2006, Frances and Niemann, 2012, Raymond et al., 2010). From day 9.0 of mouse embryonic development (E9.0)—the stage at which the 3PP are formed—to E11.5, PLET1 is uniformly expressed by 3PP cells and can therefore be regarded as a marker of the founder cells of the thymic epithelial lineage (Gordon et al., 2004, Depreter et al., 2008, Nowell et al., 2011). From E12.5 to at least E15.5, purified PLET1+ TECs are sufficient to generate a properly organized, fully functional thymus upon transplantation (Bennett et al., 2002, Gill et al., 2002, Rossi et al., 2007a), and the PLET1+ TEC population of the early fetal thymus is believed to contain a fetal common thymic epithelial progenitor cell (Rossi et al., 2006). However, PLET1+ TECs present at later stages of thymus organogenesis do not retain the capacity to initiate de novo organogenesis (Rossi et al., 2007a). In the adult thymus, PLET1+ TECs have been regarded as a minor subpopulation of mTECs based on immunohistochemical analysis.
We have identified a subpopulation of adult PLET1+ TECs, distinct from the major adult medullary PLET1+ population, that is defined by co-expression of the cTEC-restricted marker Ly-51 and located at the cortico-medullary junction. Here, we show that this Ly-51+PLET1+ population can proliferate and differentiate into both cTECs and mTECs in an established assay of TEC potency. In contrast, other adult TEC populations could generate only cortical sub-lineage TECs, or could not generate any progeny, in the same assay. The cTEC- and mTEC-generating activity extinguished at the same frequency in limiting dilution analysis, suggesting the presence of a bipotent TEPC within PLET1+Ly-51+ TECs, while further phenotypic analysis established that this bipotent progenitor also expressed high levels of MHC class II. Progeny of the PLET1+Ly-51+ TECs were present for at least 9 months in in vivo grafts, suggesting this population may contain a bipotent adult thymic epithelial stem cell (TESC). Collectively, our data provide clonal resolution analysis of a phenotypically defined adult common thymic epithelial progenitor cell population and thus important mechanistic insight for strategies aimed at improving thymus function in patients.
Results
Subdivision of Adult TECs by Immunophenotyping
We set out to investigate the cellular mechanism through which the adult thymic epithelium is maintained during homeostasis. To identify subpopulations of adult TECs that contained stem or progenitor cells capable of replenishing cTECs and mTECs, we used flow cytometry to identify discrete TEC subpopulations; in these analyses, TECs were positively identified using EpCAM staining. We first split adult TECs using Ly-51 and UEA1, markers believed to define cTECs and mTECs, respectively. Each of these subpopulations was further subdivided using cell surface MHC class II (MHCII), which is thought to correlate positively with TEC maturation status (Gray et al., 2006) and also positively correlates with CD80 in mTECs and CD40 expression in mTECs and cTECs (Reiser and Schneeberger, 1994, Galy and Spits, 1992). We also included PLET1 in our analyses, since this protein identifies TEPCs in the early fetal thymus (Bennett et al., 2002, Gill et al., 2002, Rossi et al., 2006). In keeping with the PLET1 expression pattern previously observed by immunostaining, we identified a PLET1+UEA1+ mTEC population. This population comprised ∼30% of all UEA1+ mTECs (33.3% ± 8.8%) and was predominantly MHCIIlo (Figures 1A–1C). In addition, we identified a minor, previously undescribed, population of PLET1+ TECs that co-expressed Ly-51 (Figures 1A and 1B). In 8-week-old mice, ∼50% of this Ly-51+PLET1+ population was MHCIIhi (Figure 1C; mean ± SD, 8 weeks, 46.3% ± 8.0% MHCIIhi), and Ly-51+PLET1+ TECs comprised <1% of total TECs (Figures 1A–1C; Ly-51+PLET1+ 0.92% ± 0.37% of all TECs at 8 weeks old).
Figure 1.

Subdivision of Adult TECs by Flow Cytometry
(A–C) flow cytometric analysis of TECs from 4- to 8-week-old mice for the markers shown. Plots are representative of at least three independent analyses. Plots show data after gating on (A) total EpCAM+ TECs, (B) the UEA1+ (left panel) and Ly-51+ (right panel) populations shown in (A), and (C) the PLET1+ and PLET1− subpopulations within the UEA1+ (top panels) and Ly-51+ (bottom panels) shown in (C). Gates were set on FMOs.
(D) Ly-51− medullary PLET1+ co-stained with markers of mTECs as shown (scale bars, upper panels: 100 μm; lower panels: K14, K5, CLDN4, 50 μm; RAC1, 10 μm). Images show sections of thymus from 4- to 6-week-old mice after staining for the markers shown. Images are representative of at least three independent analyses.
(E) Ly-51+ PLET1+ TECs present at the CMJ (scale bars, 100 μm except right hand upper panel, 15 μm). Images show sections of thymus from 4- to 6-week-old mice after staining for the markers shown. Images are representative of at least three independent analyses.
See also Table S2.
We further analyzed the characteristics of adult PLET1+ TECs by immunohistochemistry. Most PLET1+ TECs were found within the medulla, as previously described (Godfrey et al., 1990, Depreter et al., 2008) (Figure 1D). These medullary PLET1+ TECs co-expressed cytokeratin 14 (K14), K5, and Claudin 4 (CLDN4; with PLET1+ mTECs being a subset of CLDN4+ mTECs) and also expressed high levels of RAC1, a skin stem cell-associated marker that has also been implicated in TEC maintenance (Benitah et al., 2005, Hunziker et al., 2011) (Figure 1D). Separate from this PLET1+ mTECs population and consistent with our flow cytometric data, we identified a population of Ly-51+PLET1+ TECs by immunohistochemistry. This population was localized to the CMJ (Figure 1E). Most Ly-51+PLET1+ TECs were K14-negative by immunostaining, but occasional Ly-51+PLET1+K14+ cells were observed (Figure 1E).
To gain insight into the potential function of the TEC subpopulations defined above by UEA1, Ly-51, MHCII, and PLET1 expression, we sorted them by flow cytometry and interrogated their gene expression profiles by qRT-PCR analysis of 50 cells from each population (Figure 2). The expression profiles of Plet1 and Bp-1 (Enpep, the Ly-51 antigen) were as expected, with Bp-1 restricted to Ly-51+ cTEC populations and high Plet1 to PLET1+ populations (Figure 2A). These data validated the sorting strategy. The expression profile of Foxn1 was also consistent with previous reports of higher expression in cTECs than mTECs and in MHCIIhi than MHCIIlo TECs (Figure 2B) (Bredenkamp et al., 2014a, Nowell et al., 2011, Ki et al., 2014). Furthermore, expression of Aire and Cd80 (that are known to be mTEC-restricted), Krt5 (that is highly upregulated in mTECs and expressed in scattered cells in the thymic cortex), and Pax1 (that is reported to be cTEC-restricted) also exhibited the expected expression profiles (Figures 2C and 2D). Dll4, the obligate Notch ligand required for T cell commitment, is also known to be cTEC-restricted (Koch et al., 2008, Hozumi et al., 2008, Billiard et al., 2011); Figure 2D indicates that, among cTEC subsets in 5- to 8-week-old mice, Dll4 mRNA expression is limited to PLET1+ and PLET1− MHCIIhi cTECs. Comparison of the expression profiles of Dll4 and Foxn1 among adult TEC subsets was consistent with the identification of Dll4 as a presumptive direct FOXN1 target (Nowell et al., 2011, Bredenkamp et al., 2014a, Bajoghli et al., 2009). Kitl was expressed exclusively in Ly-51+ TECs, consistent with the requirement for signaling through c-KIT in immature thymocytes (Figure 2D). P63, a stem/progenitor cell marker in other epithelial lineages that is required to maintain thymus homeostasis (Pellegrini et al., 2001, Senoo et al., 2007), was expressed in all of the TEC subsets and enriched in MHCIIlo versus MHCIIhi TECs in both cortex and medulla (Figure 2E). Il7 was also broadly expressed; within mTECs, Il7 was enriched in MHCIIlo cells, while the highest expression level was in PLET1−MHCIIhi cTECs (Figure 2E). Furthermore, while Ltbr was expressed in all TEC subsets, it was substantially enriched in Ly-51+ cTECs (Figure 2E). Among the genes analyzed, Sca-1 and K14 showed substantial upregulation in MHCIIloLy-51+ compared to MHCIIhiLy-51+ populations and in PLET1+MHCIIloLy-51+ versus PLET1−MHCIIloLy-51+ TECs (Figure 2F). Of note is that Krt14 was also upregulated in MHCIIlo versus MHCIIhi mTEC. Collectively, these data indicated that the eight populations identified on the basis of UEA, Ly-51, PLET1, and MHCII expression represented distinct cell states, exhibiting different transcriptional profiles.
Figure 2.

Expression Profiling of Defined Adult Thymic Epithelial Cells
Plots show qRT-PCR analysis of 50 sorted cells per sample for the TEC populations and genes shown. Data are normalized to the geometric mean of three housekeepers. Plet1, Aire, Cd80, Bp-1, Krt5, Ltbr, Kitl n = 4 independent experiments, all other genes, n = 3 independent cell preparations for each population. Error bars show SD.
See also Table S2.
An Assay of Epithelial Progenitor/Stem Cell Potential in the Adult Thymus
To determine the potency of adult TEC populations, we used an assay originally developed to test the differentiation potential of fetal TEC subpopulations (Rodewald et al., 2001, Bennett et al., 2002, Gill et al., 2002). Thus, TECs were isolated from adult mice that constitutively express membrane-bound GFP (Figure 3A), aggregated with unfractionated dissociated E12.5 or E13.5 fetal thymus cells and mouse embryonic fibroblasts (MEFs) at defined ratios for 12–16 hr in vitro, then transplanted under the kidney capsule of syngeneic recipient mice (Figure 3A). Analysis of the cellular aggregates after 12–16 hr (i.e., prior to grafting) demonstrated an even distribution of GFP+ TECs that were present mostly as single cells (Figure S1A). Analysis of GFP+ TEC-derived cells within grafts recovered after 4 weeks revealed a strong contribution of GFP+ cells in both cortical and medullary epithelial compartments of all grafts analyzed (Figures S1B and S1C; n = 7). The GFP+ cells within the grafts had proliferated, as demonstrated by Ki-67 staining (Figure S1C). Collectively, these data validated this assay for detection of thymic epithelial progenitor/stem cell (TEP/SC) activity.
Figure 3.

Differentiative Potential of Defined Adult Thymic Epithelial Cell Populations
(A) Schematic diagram of grafting assay. Briefly, GFP+TECs were sorted and re-aggregated with mouse embryonic fibroblasts and dissociated embryonic thymic lobes. Re-aggregates were grafted under the kidney capsule for 4 weeks.
(B) Sorting strategy for purification of GFP+ test populations. Plots shown are representative of more than 20 independent experiments.
(C–E) Images show immunohistochemical analysis of grafts derived from the input populations shown, after staining with markers indicative of defined cTEC and mTEC populations, as shown. (C) Test GFP+ population, PLET1− mTEChi. Images show the single GFP+ area observed in two grafts analyzed. (D) Test GFP+ population, UEA1−Ly-51+PLET1− cTECs. Images show representative data from greater than three independent grafts. (E) Test GFP+ population, UEA1−Ly-51+PLET1+ TECs. Images show representative data from three independent grafts. Dotted lines in (E) show boundaries between cortex and medulla. Scale bars, 100 μm.
Phenotypic Identification of Adult TEPCs
We then set out to determine the differentiative potential of the adult TEC populations defined above. We initially analyzed five TEC populations, which encompassed all of the populations identified in Figure 1: (1) UEA1+MHCIIhiPLET1− (PLET1− mTEChi), (2) UEA1+MHCIIloPLET1− (PLET1− mTEClo), (3) UEA1+MHCIIloPLET1+ (PLET1+ mTEClo), (4) Ly-51+PLET1− (cTEC), and (5) Ly-51+PLET1+ (see Figure 3B for details of sorting strategy). These populations were sorted to purities of >95% from the thymi of 4- to 8-week-old mice. In our initial analyses, 10,000 test cells from each population were reaggregated, with the exception of the Ly-51+PLET1+ population for which only 1,500 input cells were tested due to the scarcity of these cells within the adult mouse thymus. The grafts were left for 4 weeks before analysis unless otherwise stated. During this time, they increased substantially in size and developed properly structured cortical and medullary areas, as expected. Any grafts that displayed large cystic areas or failed to grow were discarded; only fully formed organoids were taken forward for analyses of the presence and location of GFP+ TECs. Localization of GFP+ TECs within cortical and/or medullary regions was determined by counterstaining with cTEC- or mTEC-restricted markers. The different test populations exhibited distinct activities in this assay, as described below.
UEA1+ mTECs Are Sublineage-Restricted and Have Only Poor Capacity to Contribute to mTEC Networks
We tested three UEA1+ TEC populations, as described above. For grafts seeded with PLET1− mTEChi, a single, small, GFP+ area was detected in one out of five grafts; these GFP+ cells co-stained with K14 and were negative for Ly-51 (Figure 3C; Table 1). For grafts seeded with PLET1− mTEClo, one small GFP+ medullary area was present in one out of two grafts analyzed (not shown). No GFP+PLET1+ cells were detected in any of these grafts. In grafts seeded with the third UEA1+ population, PLET1+ mTEClo, no GFP+ cells were detected in any of five grafts analyzed. Collectively, of the three mTEC populations analyzed, two were able to make a very limited contribution to the grafts while the third made no contribution. These input cells only contributed to mTEC networks, indicating that they were mTEC lineage-restricted (Figure 3C; Table 1). It was not possible to determine in these analyses whether the input cells had differentiated but, consistent with a previous report (Wong et al., 2014), the small size of the GFP+ foci suggested strongly that they did not contain progenitor TECs.
Table 1.
Differentiative Potential of Adult Thymic Epithelial Cells
| Input GFP+ Test Cell Phenotype | No. of Input Cells | Outcome |
|---|---|---|
| Medulla | ||
| UEA1+PLET1+Ly-51−MHCIIlo | 10,000 | no green cells detected, n = 5 |
| UEA1+PLET1−Ly-51−MHCIIlo | 10,000 | 1 small GFP+ medullary area detected in 1 of 2 grafts analyzed |
| UEA1+MHCIIhi | 10,000 | 1 small GFP+ medullary area detected in 1 of 5 grafts |
| Cortex | ||
| Ly-51+UEA1−PLET1− (MHCIIhi and MHCIIlo) | 10,000 | 3/3 grafts, extensive cortical contribution. |
| of 389 GFP+ areas analyzed, 1 was a small mTEC cluster, 1–2 comprised ≤3 atypical K14+ TECs, and the remainder were robust cTEC clusters | ||
| Ly-51+UEA1−PLET1− (MHCIIhi and MHCIIlo) | 400 | contribution to cTECs only (2 clusters), n = 1 |
| Ly-51+UEA1−PLET1−MHCIIhi | 407 | contribution to cTECs only, n = 1 |
| Ly-51+UEA1−PLET1−MHCIIlo | 1,289 | extensive contribution to cTECs, 2 areas containing a few scattered GFP+ cells within a medullary region, n = 1 |
| Unassigned | ||
| Ly-51+UEA1−PLET1+ (MHCIIhi and MHCIIlo/neg) | 1,500 | 3/3 grafts, extensive contribution to both cortex and medulla |
| ∼30% of GFP+ areas were medullary | ||
| 500 | 3/3 grafts, contribution to both cortex and medulla | |
| more than 20 GFP+ areas detected per graft | ||
| mTECs, 37% ± 23.6%, cTECs, 62.6% ± 24.0% of GFP+ clusters | ||
| 250 | 3/3 grafts, contribution to both cortex and medulla | |
| up to 12 GFP+ areas detected per graph | ||
| mTECs, 24% ± 1.4%, cTECs, 76% ± 1.4% of GFP+ clusters | ||
| 125 | 3/3 grafts, contribution to both cortex and medulla | |
| 3–8 GFP+ areas detected per graph | ||
| mTECs, 58% ± 11.3% cTECs, 41.5% ± 12% of GFP+ clusters | ||
| 90 | 1/6 grafts, contribution to both cortex and medulla | |
| 3 GFP+ areas detected | ||
| mTECs, 33% cTECs, 66% of GFP+ clusters | ||
| 60 | 3/3 grafts, no contribution detected | |
| Ly-51+UEA1−PLET1+MHCIIlo/neg | 188–260 | 3/3 grafts, cortical GFP+ areas detected; 1 small atypical K14+ area detected in 1/3 grafts |
| Ly-51+UEA1−PLET1+ MHCIIhi | 129–415 | 3/3 grafts, contribution to both cortex and medulla |
Summary of distribution of GFP+ cells in grafts seeded with the input test cell populations and test cell numbers noted. Grafts were sectioned at 8 μm and every section was collected. Each section was then screened for the presence of GFP+ cells. When foci of GFP+ cells were observed, the sections were stained for mTEC and cTEC markers to determine the identity of the GFP+ cells. GFP+ foci were tracked through sections, with notes taken on the number of sections spanned and the position of foci in the graft relative to other GFP+ foci. n is shown for each population tested and represents the number of independent grafts analyzed. Statistical data show mean ± SD for proportion of GFP+ clusters in cortical and medullary regions across all grafts analyzed for a given condition. One-way ANOVA showed no significant difference in distribution of GFP+ clusters among grafts seeded with 500, 250, or 125 cells (medullary contribution, p = 0.076, cortical contribution, p = 0.087).
See also Table S2.
Ly-51+PLET1− cTECs Are cTEC Sublineage-Restricted and Contribute to cTEC Networks
In grafts seeded with 10,000 Ly-51+PLET1− cTEC, extensive areas of GFP+ TECs were detected in all grafts analyzed (n = 3, Figure 3D; Table 1). These GFP+ cells displayed characteristic markers of cTECs, including CD205, Ly-51, and β5t (shown for CD205 in Figure 3D) and were found in cortical areas. All cells were negative for PLET1. In all grafts, multiple foci of GFP+ cTECs were observed, many situated in the periphery of the thymic lobe. Of 389 GFP+ clusters analyzed, a few that comprised single cells or clusters of less than or equal to three cells co-expressed K14, and one small K14+ medullary area was detected (Table 1). In a graft seeded with 400 Ly-51+PLET1− cTECs, only two cortical areas were detected (Table 1).
We subsequently analyzed two grafts in which the Ly-51+PLET1− population was split on the basis of MHC class II expression. The graft seeded with ∼400 Ly-51+UEA1−PLET1−MHCIIhi cells showed a contribution only to cTECs. The graft seeded with ∼1,300 Ly-51+UEA1−PLET1−MHCIIlo/neg cells showed an extensive contribution to cTECs and also contained a small number of GFP+K14+ TECs within one medullary area (Table 1).
Taken together, these data indicate that the Ly-51+PLET1− cTEC population contains cells that can contribute efficiently to cTEC networks for at least 4 weeks after grafting, consistent with the existence within this population of cTEC-restricted progenitors. These cTEC progenitors were present within both the MHCIIhi and MHCIIlo/neg fractions of Ly-51+PLET1− cTECs. However, our data do not provide evidence for a frequent or efficient mTEC progenitor in the Ly-51+PLET1− population.
Adult Ly-51+PLET1+ TECs Generate Both cTECs and mTECs
All grafts seeded with 1,500 Ly-51+PLET1+ TEC subpopulation contained very extensive clusters of GFP+ TECs at 4 weeks post-grafting (n = 3; Figures 3E and 4; Table 1). A strong contribution of GFP+ TECs was observed in both medullary and cortical areas, with similar numbers of GFP+ foci in each compartment (see Table 1 for quantification). The GFP+ TECs in the cortical areas co-expressed Ly-51 and CD205, while those in medullary areas were negative for Ly-51. GFP+ medullary TECs were detected that expressed K14, UEA1, and AIRE (Figures 3E and 4; Table 1), clearly indicating that the input population had differentiated. Furthermore, GFP+PLET1+ TECs were also present in some GFP+Ly-51+PLET1+ TEC-seeded grafts. The GFP+PLET1+ cells included cells located in the medulla that lacked co-expression of cortical markers and CD205+ cells close to the cortico-medullary junction (CMJ) (Figure 4A, s183 arrowhead), similar to the Ly-51+PLET1+ TECs detected by immunohistochemistry in the native thymus. No differences in outcome were observed from Ly-51+PLET1+ TECs isolated from 4- or 8-week-old mice. Collectively, of all five populations tested in this assay, only Ly-51+PLET1+ TECs could efficiently generate both cTECs and mTECs.
Figure 4.

Ly-51+PLET1+ TECs Contribute to Both mTEC and cTEC Lineages at Limiting Dilution
(A) Images show immunohistochemical analysis of a single graft seeded with 90 UEA1−Ly-51+PLET1+ GFP+ input TECs, stained with the markers shown. DAPI staining (blue) indicates nuclei. Images shown are from sections taken throughout the graft, sections are numbered consecutively from top to bottom. Note that GFP+ cells contributing to all major TEC sub-lineages, including PLET1+ TECs located in the medulla and at the CMJ, were present in this graft. s, section number; M, medullary focus; C, cortical focus. Scale bars, 100 μm. Arrowheads indicate non-medullary PLET1+GFP+ TECs.
(B and B′) Schematic showing distribution of GFP+ areas within graft shown in (A), along x-y axis; all sections from the graft were analyzed for the presence of GFP+ cells and the size and location of GFP foci were scored. Vertical distribution in schematic is to scale, horizontal is not.
(C) Low magnification image showing relative positions of M1 and C2 in x-z plane. Scale bar, 100 μm. Maximum diameters of M1, C1, and C2 in z plane are annotated in text; maximum diameter in x and y planes are shown in (B).
Limiting Dilution Analysis of Ly-51+PLET1+ TECs Suggests an Adult Common TEPC
To determine whether the Ly-51+PLET1+ TEC population contained a common TEPC, able to generate both cortical and medullary TEC subtypes, or comprised separate cTEC and mTEC progenitors with some shared phenotypic characteristics, we next used a limiting dilution approach to establish the frequency within this population of cells able to generate cortical and medullary TECs. For this, we generated grafts containing defined numbers of test cells, such that the grafted reaggregate fetal thymic organ culture (RFTOC) were initially seeded with 500, 250, 125, 90, or 60 Ly-51+PLET1+GFP+ TECs. As above, grafts were left for 4 weeks before analysis for the presence of GFP+ cells.
Grafts seeded with 500 GFP+Ly-51+PLET1+ TECs all contained extensive contribution of GFP+ cells in both medullary and cortical areas (n = 4). In these grafts, the GFP+ clusters contained 100–200 TECs and more than 20 GFP+ areas were identified in each graft. The GFP+ cTECs expressed Ly-51 and CD205, while the GFP+ mTECs expressed K14 and UEA1, and GFP+ cells expressing PLET1 were also detected (Table 1). All three grafts seeded with 250 Ly-51+PLET1+TECs also contained GFP+ TECs in both cortex and medulla, and these cTECs and mTECs stained with appropriate sub-lineage-restricted markers. There were fewer GFP+ areas in these grafts than in grafts seeded with 500 Ly-51+PLET1+ cells. However, the relative contribution to cTECs and mTECs was consistent with that observed in the grafts seeded with 500 Ly-51+PLET1+ test cells (Table 1). Analysis of grafts seeded with 125 Ly-51+PLET1+GFP+ TECs also revealed the presence of GFP+ TECs in both the cortex and medulla of all grafts analyzed. Foci containing PLET1+GFP+ TECs were detected in addition to foci containing either Ly-51+PLET1− TECs or K14+PLET1−UEA1+ TECs (n = 3) (Table 1). In these grafts, only three to eight GFP+ areas were detected per graft.
In grafts seeded with 90 GFP+Ly-51+PLET1+ TECs, one out of six grafts analyzed contained GFP+ TECs. Again, GFP+ cells were found in both cortical and medullary regions and expressed region-appropriate markers. In this graft, one GFP+ mTEC cluster was present and spanned 22 contiguous 8-μm sections (Figure 4; Table S1). Two GFP+ cTEC clusters were present, one adjacent to the mTEC cluster and one separated spatially but in the same region of the graft (Figure 4). GFP+PLET1+ TECs were detected within the medullary cluster and cortical cluster C2 (Figure 4; Table S1). The spatial relationship of the three clusters detected in this graft strongly suggested they had arisen from a single cell, as a result of proliferation and cell mixing in the early stages of graft development, prior to sub-lineage commitment. Similarly dispersed foci were previously shown to arise from a single fetal TEPC (Rossi et al., 2006) (A.F. and C.C.B., unpublished data), and this distribution pattern of cells originating from a single lineage-committed cell is commonly described in other tissues (Mathis and Nicolas, 2002). No GFP+ TECs were detected in the cortical or medullary compartments of any of the three grafts generated with an input of 60 Ly-51+PLET1+ test cells (Table 1).
Collectively, these data establish that Ly-51+PLET1+ TECs can give rise to both cTECs and mTECs in grafts seeded with as few as 90 input test cells. Since the cTEC- and mTEC-generating activities extinguished at the same input cell number, and the distribution of GFP+ cells within the 90-cell graft is consistent with a clonal origin of all three GFP+ foci, they further suggest the presence of a common TEPC within this population. Using limiting dilution analysis (Hu and Smyth, 2009), we calculated the frequency of this putative common TEPC within the Ly-51+PLET1+ population as 1/53.4–1/233, with an average of 1/111, at the 95% confidence limit (Figure 4; Table 1).
A Common Thymic Epithelial Progenitor Activity Is Located within the MHC Class IIhi Fraction of Ly-51+PLET1+ TECs
The Ly-51+PLET1+ TEC population contained both MHCIIhi and MHCIIlo/neg cells (Figure 1B). The relative proportions of these fractions changed with age, such that at 4 weeks old, Ly-51+PLET1+ TECs were predominantly MHCIIhi, with MHCIIlo/negLy-51+PLET1+ TECs increasing in proportion and number between 4 and 8 weeks of age (MHCIIhi: 4 weeks, 77.3 ± 7.0; 8 weeks, 46.3 ± 8.0; p = 0.001). We therefore tested these subpopulations individually, to determine whether the common progenitor activity was restricted to one or other subset. This revealed that the MHCIIhiLy-51+PLET1+ TECs could generate both cTECs and mTECs (Figure 5; Table 1; 4/4 grafts, input cell numbers 129, 178, 284, 415), including AIRE+ mTEC and PLET1+ CMJ TEC areas (Figure 5C′). Large clones containing both cTECs and mTECs and spanning the CMJ were observed in three out of four grafts seeded with Ly-51+PLET1+MHC IIhi TECs (Figures 5A–5C′), consistent with the presence of a common progenitor cell within this population. In contrast, the MHC IIlo/neg fraction contained cTEC-restricted progenitors but did not contribute to the CMJ or medulla (Figures 5A, 5B, and 5D; Table 1; 3/3 grafts, input cell numbers, 188, 226, 260).
Figure 5.

The Common Progenitor Activity Is Located within the MHCIIhi Fraction of Ly-51+PLET1+ TECs
(A) Graph shows contribution of test cells of the phenotypes shown to cortical and medullary TEC sublineages. x axis indicates individual grafts. y axis indicates total length of all cortical (red) and medullary (yellow) GFP+ foci in a particular graft, in micrometers. MHC class IIhiLy-51+PLET+ TECs can contribute to both cTEC and mTEC sub-lineages while MHC class IIlo/negLy-51+PLET1+ TECs can contribute only to cTECs.
(B) Schematic representation showing distribution of GFP+ cells in grafts seeded with cells of the phenotypes shown. The dotted line represents the total length of the graft (1 cm represents 200 μm), for each graft, the whole graft was sectioned and each section was analyzed for the presence of GFP+ regions and the localization of the GFP+ areas to cortex and/or medulla. For the purpose of representation, information from the y and z planes are collapsed onto the x axis. Where contribution of GFP+ cells to cortical and medullary regions overlaps in this schematic, these regions were contiguous in most but not all cases.
(C, C’, and D) Images show immunohistochemical analysis of grafts derived from the MHCIIhiLy-51+PLET1+ input TEC (C and C’) and MHCIIlo/negLy-51+PLET1+ (D) populations after staining with markers indicative of defined cortical and medullary TEC populations, as shown. MHCIIhiLy-51+PLET1+ input TECs, n = 4; MHCIIlo/negLy-51+PLET1+, n = 3. Images show representative data from three of four independent grafts for MHCIIhiLy-51+PLET1+ and two of three independent grafts for MHCIIlo/negLy-51+PLET1+input TECs. Arrowhead in (C′) indicates GFP+PLET1+ cell.
See also Table S2.
Long-Term Contribution of Ly-51+PLET1+ TECs to TEC Lineages
It is not yet clear whether the adult thymus is maintained by thymic epithelial stem cells (TESCs), or by a population of TEPCs with limited self-renewal potential. To test whether the Ly-51+PLET1+ TEC population identified above as containing a common TEPC might contain bona fide TESCs, we investigated their capacity to contribute to TEC networks over a sustained period. Thus, two grafts seeded with GFP+Ly-51+PLET1+ TECs were established as above and left for 9 months before analysis. One graft was seeded with 1,000 GFP+ cells and one with 200 GFP+ cells. We detected GFP+ TECs in the cortex and medulla of the 1,000 cell-seeded graft recovered at this time point, but no GFP+ cells in the 200 cell-seeded graft (Figure 6). We also seeded two grafts with Ly-51+PLET1− cells (input numbers: 5,984 and 2,141 GFP+ cells, respectively); no GFP+ cells were present in these grafts after 9 months. Since the turnover time of adult TECs is established as 2–3 weeks (Gray et al., 2006), and furthermore, we analyzed the grafts well after the onset of age-related thymic involution, these data indicate that at least some TECs in the Ly-51+PLET1+ population are capable of generating long-term surviving progeny. Therefore, it may possibly contain thymic epithelial stem cells. In contrast, the Ly-51+PLET1− population appears to contain short-term cTEC progenitors, rather than a cTEC-restricted stem cell activity.
Figure 6.

Evidence for Stem Cell Activity among Adult Ly-51+PLET1+ TEPC
Ly-51+PLET1+ TECs generate progeny present 9 months after grafting. Images show immunohistochemical analyses of a graft seeded with 1,000 UEA1−Ly-51+PLET1+GFP+ input TECs analyzed 9 months after grafting. Images show representative data from one of two independent grafts.
See also Table S2.
Discussion
The cellular mechanism that maintains homeostasis of the adult thymic epithelium has been of long-standing interest, but phenotypic identification of an adult thymic epithelial stem or progenitor cell (TES/PC) has remained elusive. Evidence of a common TEPC and of unipotent cTEC- and mTEC-restricted progenitors was found in a retrospective lineage tracing analysis performed in neonatal mice (Bleul et al., 2006), and each of these activities has been demonstrated in the fetal thymus (Rossi et al., 2006, Shakib et al., 2009, Hamazaki et al., 2007, Sekai et al., 2014). Forward lineage tracing data from young (up to 3 weeks old) mice are also consistent with the existence of both a common TEPC and unipotent cTEC- and mTEC-restricted progenitors (Ohigashi et al., 2015, Onder et al., 2015, Mayer et al., 2015). However, to date, prospective isolation and functional testing has narrowed down the adult TEC progenitor compartment only to a broad population comprising MHCIIlo cTECs, that comprises ∼20% of the total adult TEC population and contains both cTEC- and mTEC-generating activities (Wong et al., 2014). We have investigated the differentiation potential of six defined subpopulations of adult TECs using a validated transplantation-based assay of TEC potency. Our data show that a previously unidentified EpCAM+UEA1−Ly-51+PLET1+ population, that comprises <1% of total TECs, can efficiently generate both cTECs and mTECs at limiting dilution, suggesting that this population contains a common TEPC. No other TEC subpopulation tested contained this activity. Within EpCAM+UEA1−Ly-51+PLET1+ TECs, the MHCIIhi fraction could efficiently generate cTECs and mTECs, including clones spanning cortex, medulla, and CMJ, again consistent with the presence of a common TEPC, while EpCAM+MHCIIlo/negUEA1−Ly-51+PLET1+ TECs generated only cTECs. We further demonstrated that EpCAM+UEA1−Ly-51+PLET1+ TECs could generate non-medullary PLET1+ TECs, and input-derived cells could contribute to TEC networks for at least 9 months in vivo, suggesting that this population may contain self-renewing thymic epithelial stem cells. Our data also revealed the presence of short-term cortical sub-lineage-restricted progenitors within the Ly-51+PLET1− cTEC population. Consistent with a previous report (Wong et al., 2014), we did not identify an efficient or frequent TEPC activity within any UEA1+ TEC population tested.
Two recent studies have also identified adult TEPC activities. EpCAM− TECs derived from a FOXN1 low/negative lineage were shown to initiate clonal spheroid cultures, under conditions similar to those used to generate mammary epithelial spheres (Ucar et al., 2014). The thymospheres could be passaged several times, although not indefinitely, and could contribute to some extent to cTEC and mTEC lineages in an RFTOC assay similar to that employed herein. The Ly-51+PLET1+ population that we identify here as TEPCs are clearly distinct from this population, as Ly-51+PLET1+ TECs are EpCAM+ and express Foxn1. Further analysis is required to determine the relationship, if any, between these populations. However, we note that the relatively extended culture period employed during derivation and passage of the thymospheres may have affected cellular potency (Ucar et al., 2014).
In the second report, TEPC activity was detected in the EpCAM+UEA1−MHCIIlo population, which comprised ∼20% of all TECs (Wong et al., 2014). Although that report hinted at a common TEPC, such an activity was not demonstrated due to the high numbers of input cells used (7.5 × 10⁴ to 1 × 10⁵ test cells per graft) (Wong et al., 2014). Our studies indicate that a high efficiency, short-term, cTEC-restricted progenitor activity exists within the EpCAM+Ly-51+UEA1−PLET1−MHCIIlo TEC population, which overlaps with the EpCAM+UEA1−MHCIIlo population identified by Wong et al. (2014). We additionally detected a low frequency and low efficiency capacity to generate mTECs within the EpCAM+Ly-51+UEA1− PLET1−MHCIIlo/neg subset of EpCAM+UEA1−MHCIIlo TECs. While this activity does not appear to represent a high efficiency mTEC progenitor, it may reconcile our findings with those of Wong et al. (2014), especially once the different input cell numbers tested in the two studies is considered. Furthermore, although a CLDN3/4+SSEA1+ mTEC-restricted progenitor was recently identified in the fetal thymus and was shown to both sustain the mTEC lineage in long-term assays in grafted reaggregates and initiate clonogenic in vitro cultures, cells of this phenotype in the adult thymus had markedly diminished progenitor capacity compared to their fetal counterparts and could not be cultured in vitro (Sekai et al., 2014). The absence of a robust mTEC-restricted progenitor cell in our analyses is therefore consistent with both this study (Sekai et al., 2014) and that of Wong et al. (2014).
In addition to the high frequency cTEC progenitor activities detected in EpCAM+Ly-51+UEA1− TECs, we identified a high efficiency common TEPC within EpCAM+PLET1+Ly-51+UEA1−MHCIIhi TECs and provided evidence that cells within this population could contribute to generation of cTECs and mTECs for at least 9 months, suggesting the population may contain a bipotent TEC stem cell. Considering all of the above data, we suggest that this common progenitor/stem TEC is likely to be upstream of the EpCAM+UEA1−MHCIIlo TECs progenitor populations discussed above in the TEC cellular hierarchy. The presence of a very low frequency, low efficiency mTEC-generating activity within EpCAM+Ly-51+UEA1−MHCIIlo/neg TECs may reflect plasticity of cell potencies, as shown for stem/progenitor cells in many other lineages (Snippert et al., 2010, Buczacki et al., 2013). Overall, in identifying an adult TEP/SC comprising <0.5% of total TECs, our data represent an enrichment for progenitor/stem cell activity of >30-fold over the previous report (Wong et al., 2014). Furthermore, our immunohistochemical analyses indicate that this population is located at the CMJ and consistent with this, CMJ-located PLET1+ TECs were present in grafts derived from EpCAM+PLET1+Ly-51+UEA1− TECs. Our data thus provide the physical location of a phenotypically defined bipotent adult TEC progenitor cell population.
It is well established that PLET1 marks the founder cells of the thymic epithelial lineage (Gordon et al., 2004, Depreter et al., 2008, Moore-Scott et al., 2007, Manley et al., 2011), that is, the earliest cell, which in vivo will generate thymic epithelial but not other lineage fates during organogenesis (Smith, 2006). The status of PLET1 as a TEPC marker has, however, been disputed (Rossi et al., 2007a). In each of two clonal analyses demonstrating a fetal common TEPC (Bleul et al., 2006, Rossi et al., 2006), this activity occurred within a PLET1+ TEC population. However, while at developmental stages up to and including E16.5 fetal PLET1+ TECs can initiate de novo thymus organogenesis (Bennett et al., 2002, Gill et al., 2002, Rossi et al., 2007a), this capacity is lost by E18.5 (Rossi et al., 2007a). This finding was taken to indicate that PLET1+ cells do not maintain the thymus beyond the later stages of fetal development (i.e., E16.5) (Swann and Boehm, 2007), but the alternative explanation, that fetal and adult progenitors might exhibit differential capacities with respect to initiation of de novo organogenesis, was not explored. In the present study, the assay of TEC potency used did not require the test population to initiate organogenesis, since this property is not required in adult stem/progenitor cells. Consistent with the work of Rossi et al. (2007a) and Wong et al. (2014), we found that the majority of PLET1+ TECs were unable to contribute to TEC networks. However, this assay identified a rare subpopulation of Ly-51+PLET1+MHCIIhi TECs as the only adult TEC population to contain a bipotent TEPC, based on clonal resolution analysis demonstrating active differentiation of Ly-51+PLET1+IIhi input TECs. Taken together with previous findings, our data therefore suggest that fetal and adult TEPCs have overlapping but not identical properties; specifically, that the adult TEP/SC share very similar or identical differentiation potential to the equivalent fetal population but have lost the capacity to initiate organogenesis de novo. Detailed exploration of the relationship between fetal and adult TEPCs, and in particular of the transition from fetal to adult functionality, will thus be of interest.
In sum, our data provide a phenotypically defined adult TEP/SC that represents ≤0.5% of total TECs. They thus overcome the major hurdle to precise cellular and molecular understanding of the mechanisms regulating thymus homeostasis and age-related thymic involution and the remarkable regenerative capacity of the adult thymus (Dudakov et al., 2012, Chinn et al., 2012, Bredenkamp et al., 2014a) and pave the way for new regenerative and cell replacement approaches to improving thymus function in patients.
Experimental Procedures
Mice
CBAxC57BL/6 F1 mice were used for isolation of embryonic TECs and mouse embryonic fibroblasts. For timed matings, C57BL/6 females were housed with CBA males and noon of the day of the vaginal plug was taken as E0.5. Adult TECs were sorted from male and female C57BL/6 or C57BL/6;aGFP animals. CBAxC57BL/6 F1 and nude mice were used at 6–10 weeks of age as graft recipients. All animals were housed and bred at the Institute for Stem Cell Research/Centre for Regenerative Medicine (ISCR/CRM) animal facilities and all experimental procedures were conducted in compliance with the Home Office Animals (Scientific Procedures) Act 1986 under license number PPL60/4435. We term 8-week-old mice as “adult” throughout the manuscript in line with information on the Jackson Laboratories website; this nomenclature is consistent with current understanding of thymus development, where the thymus attains its adult architecture by 4 weeks of age.
Antibodies
The antibodies used for immunohistochemistry and flow cytometry were as listed in Table S2. See also the Supplemental Experimental Procedures.
Murine Embryonic Fibroblasts
Murine embryonic fibroblasts (MEFs) were prepared as previously described (Bennett et al., 2002). See the Supplemental Experimental Procedures for details.
Flow Cytometry
Adult thymi and grafted RFTOC were processed for flow cytometric sorting and analysis as previously described (Nowell et al., 2011, Bredenkamp et al., 2014b), See the Supplemental Experimental Procedures for detailed protocols. All flow cytometry data were analyzed using FlowJo Version 9.7.6 (Tree Star).
Assay of the Potency of Adult PLET1+ Cells
The potency of purified adult TEC subpopulations was tested by their ability to differentiate within a functional thymus after grafting under the kidney capsule, as previously described (Bennett et al., 2002). Briefly, defined numbers of GFP+ adult TECs were mixed with 200,000 wild-type E12.5 or E13.5 fetal thymus cells and 200,000 MEFs and reaggregated for 12–16 hr in DMEM F12 (Invitrogen) supplemented with 10% FCS, 1% HEPES, 2% amino acids, 50 U/ml penicillin, and 50 μg/ml streptomycin. Reaggregates were then grafted under the kidney capsule of 5- to 10-week-old male F1 or nude mice. Grafts were removed after 4 weeks and processed for immunohistochemical analysis as below. Grafting into syngeneic and nude mice yielded identical results (tested using GFP+PLET1+ TECs; not shown). For the data shown in Table 1, for most GFP+ areas compartmental localization was unambiguous and comprised clusters of GFP+ cells with a burst size of ≥20 cells that were clearly integrated into the TEC network. In some instances, only a small number of individual GFP+ TECs of the appropriate phenotype were present in a particular area. We also found one or two instances of an atypical GFP+ cluster, where GFP+K14+ cells possibly associated with a cyst were located in a clearly cortical area. These staining patterns are indicated in the text and in Table 1. Throughout the text, “efficient contribution” refers to the first type of cluster. Where we refer to “high” or “low” frequency, this describes the number of clusters of a particular type observed under the particular test condition. For analysis, grafts were sectioned at 8 μm unless otherwise stated. Every section was scored for the presence of GFP+ cells, which were identified as cortical or medullary clusters based on the morphology and position of the cells in the graft. Every section (Figure 4) or every tenth section (Figures 3, 5, and 6) was then analyzed by immunohistochemistry in order to confirm the cortical or medullary TEC sub-lineage identity of the GFP+ cells. For Figures 4 and 5, all GFP+ areas were tracked through the sections in order to map their contributions in the graft.
Immunohistochemistry
Immunohistochemistry was performed as described (Gordon et al., 2004). See the Supplemental Experimental Procedures for details. Appropriate isotype and negative controls were included in all experiments. For detection of immunofluorescence, slides were examined with a Leica AOBS (Leica Microsystem, GmbH) or SPE confocal microscope. Images presented are of single optical sections.
qRT-PCR
qRT-PCR was performed as previously described (Bredenkamp et al., 2014b), on 50 cells per sample. See the Supplemental Experimental Procedures for details. Data are shown after normalization to the geometric mean of three control genes (Hprt, Ywhaz, Hmbs). Data analysis was carried out using LightCycler 1.5 software and the ΔCt method (Livak and Schmittgen, 2001). Primers used for qRT-PCR are as shown in Table S3.
Sample Size and Statistics
Statistical analysis for Table 1 was performed using the one-way ANOVA test (two-tailed), as appropriate for normally distributed data (normal distribution was tested using χ2 goodness of fit). The alpha level is taken as 0.05. Errors shown are SD throughout. Sample sizes of at least n = 3 were used for all analyses except where indicated. Limiting dilution analysis was applied as described (Hu and Smyth, 2009). No statistical method was used to predetermine sample size, the experiments were not randomized, and the investigators were not blinded to allocation during experiments and outcome assessment. There were no limitations to repeatability of the experiments. No samples were excluded from the analysis except in the transplantation assay, where grafts that displayed large cystic areas or failed to grow were discarded such that only fully formed organoids were taken forward for analyses of the presence and location of GFP+ TECs.
Author Contributions
S.U., K.E.O’N., and T.M. conceived and designed experiments, performed experiments, analyzed the data and contributed to writing the manuscript. A.M.F. and H.J.V. conceived and designed experiments, performed experiments, and analyzed data. N.F.B. performed experiments and analyzed data. A.M.C. contributed to analysis of the data. C.C.B. conceived the original idea, designed experiments, contributed to analysis of the data, and wrote the manuscript.
Acknowledgments
We thank C. Cryer, O. Rodriguez, S. Monard, M. Waterfall, and J. Vrana for cell sorting, the Biomed Unit staff for animal care, and V. Wilson, E. Richie, and N.R. Manley for discussion and comments. The research leading to these results received funding Leukaemia and Lymphoma Research (06008 and 02327 to C.C.B.), the Darwin Trust of Edinburgh (to S.U.), the School of Biological Sciences, University of Edinburgh (to H.J.V.), the Medical Research Council (to A.M.C.), the Biotechnology and Biological Sciences Research Council (BB/H021183/1BBSRC to C.C.B.), the NIH (1P01AI076514-01A1 to C.C.B.) the European Union Sixth Framework Programme integrated project EuroStemCell (to C.C.B.) under grant agreement 503005, the European Union Seventh Framework Programme (FP7/2007-2013) collaborative projects EuroSyStem (to C.C.B.), OptiStem (to C.C.B.), ThymiStem (to C.C.B.) under grant agreement numbers 200720, 223098, and 602587, respectively, and a CJ Martin Fellowship from the Australian National Health and Medical Research Council (NHMRC) (to T.M.).
Published: March 17, 2016
Footnotes
This is an open access article under the CC BY-NC-ND license (http://creativecommons.org/licenses/by-nc-nd/4.0/).
Supplemental Information includes Supplemental Experimental Procedures, one figure, and three tables and can be found with this article online at http://dx.doi.org/10.1016/j.celrep.2016.02.080.
Supplemental Information
References
- Bajoghli B., Aghaallaei N., Hess I., Rode I., Netuschil N., Tay B.H., Venkatesh B., Yu J.K., Kaltenbach S.L., Holland N.D. Evolution of genetic networks underlying the emergence of thymopoiesis in vertebrates. Cell. 2009;138:186–197. doi: 10.1016/j.cell.2009.04.017. [DOI] [PubMed] [Google Scholar]
- Benitah S.A., Frye M., Glogauer M., Watt F.M. Stem cell depletion through epidermal deletion of Rac1. Science. 2005;309:933–935. doi: 10.1126/science.1113579. [DOI] [PubMed] [Google Scholar]
- Bennett A.R., Farley A., Blair N.F., Gordon J., Sharp L., Blackburn C.C. Identification and characterization of thymic epithelial progenitor cells. Immunity. 2002;16:803–814. doi: 10.1016/s1074-7613(02)00321-7. [DOI] [PubMed] [Google Scholar]
- Billiard F., Kirshner J.R., Tait M., Danave A., Taheri S., Zhang W., Waite J.C., Olson K., Chen G., Coetzee S. Ongoing Dll4-Notch signaling is required for T-cell homeostasis in the adult thymus. Eur. J. Immunol. 2011;41:2207–2216. doi: 10.1002/eji.201041343. [DOI] [PubMed] [Google Scholar]
- Bleul C.C., Corbeaux T., Reuter A., Fisch P., Mönting J.S., Boehm T. Formation of a functional thymus initiated by a postnatal epithelial progenitor cell. Nature. 2006;441:992–996. doi: 10.1038/nature04850. [DOI] [PubMed] [Google Scholar]
- Bonfanti P., Claudinot S., Amici A.W., Farley A., Blackburn C.C., Barrandon Y. Microenvironmental reprogramming of thymic epithelial cells to skin multipotent stem cells. Nature. 2010;466:978–982. doi: 10.1038/nature09269. [DOI] [PubMed] [Google Scholar]
- Bredenkamp N., Nowell C.S., Blackburn C.C. Regeneration of the aged thymus by a single transcription factor. Development. 2014;141:1627–1637. doi: 10.1242/dev.103614. [DOI] [PMC free article] [PubMed] [Google Scholar]
- Bredenkamp N., Ulyanchenko S., O’Neill K.E., Manley N.R., Vaidya H.J., Blackburn C.C. An organized and functional thymus generated from FOXN1-reprogrammed fibroblasts. Nat. Cell Biol. 2014;16:902–908. doi: 10.1038/ncb3023. [DOI] [PMC free article] [PubMed] [Google Scholar]
- Buczacki S.J., Zecchini H.I., Nicholson A.M., Russell R., Vermeulen L., Kemp R., Winton D.J. Intestinal label-retaining cells are secretory precursors expressing Lgr5. Nature. 2013;495:65–69. doi: 10.1038/nature11965. [DOI] [PubMed] [Google Scholar]
- Chinn I.K., Blackburn C.C., Manley N.R., Sempowski G.D. Changes in primary lymphoid organs with aging. Semin. Immunol. 2012;24:309–320. doi: 10.1016/j.smim.2012.04.005. [DOI] [PMC free article] [PubMed] [Google Scholar]
- Depreter M.G., Blair N.F., Gaskell T.L., Nowell C.S., Davern K., Pagliocca A., Stenhouse F.H., Farley A.M., Fraser A., Vrana J. Identification of Plet-1 as a specific marker of early thymic epithelial progenitor cells. Proc. Natl. Acad. Sci. USA. 2008;105:961–966. doi: 10.1073/pnas.0711170105. [DOI] [PMC free article] [PubMed] [Google Scholar]
- Dudakov J.A., Hanash A.M., Jenq R.R., Young L.F., Ghosh A., Singer N.V., West M.L., Smith O.M., Holland A.M., Tsai J.J. Interleukin-22 drives endogenous thymic regeneration in mice. Science. 2012;336:91–95. doi: 10.1126/science.1218004. [DOI] [PMC free article] [PubMed] [Google Scholar]
- Frances D., Niemann C. Stem cell dynamics in sebaceous gland morphogenesis in mouse skin. Dev. Biol. 2012;363:138–146. doi: 10.1016/j.ydbio.2011.12.028. [DOI] [PubMed] [Google Scholar]
- Galy A.H., Spits H. CD40 is functionally expressed on human thymic epithelial cells. J. Immunol. 1992;149:775–782. [PubMed] [Google Scholar]
- Gill J., Malin M., Holländer G.A., Boyd R. Generation of a complete thymic microenvironment by MTS24(+) thymic epithelial cells. Nat. Immunol. 2002;3:635–642. doi: 10.1038/ni812. [DOI] [PubMed] [Google Scholar]
- Godfrey D.I., Izon D.J., Tucek C.L., Wilson T.J., Boyd R.L. The phenotypic heterogeneity of mouse thymic stromal cells. Immunology. 1990;70:66–74. [PMC free article] [PubMed] [Google Scholar]
- Gordon J., Wilson V.A., Blair N.F., Sheridan J., Farley A., Wilson L., Manley N.R., Blackburn C.C. Functional evidence for a single endodermal origin for the thymic epithelium. Nat. Immunol. 2004;5:546–553. doi: 10.1038/ni1064. [DOI] [PubMed] [Google Scholar]
- Gray D.H., Seach N., Ueno T., Milton M.K., Liston A., Lew A.M., Goodnow C.C., Boyd R.L. Developmental kinetics, turnover, and stimulatory capacity of thymic epithelial cells. Blood. 2006;108:3777–3785. doi: 10.1182/blood-2006-02-004531. [DOI] [PubMed] [Google Scholar]
- Gray D., Abramson J., Benoist C., Mathis D. Proliferative arrest and rapid turnover of thymic epithelial cells expressing Aire. J. Exp. Med. 2007;204:2521–2528. doi: 10.1084/jem.20070795. [DOI] [PMC free article] [PubMed] [Google Scholar]
- Hamazaki Y., Fujita H., Kobayashi T., Choi Y., Scott H.S., Matsumoto M., Minato N. Medullary thymic epithelial cells expressing Aire represent a unique lineage derived from cells expressing claudin. Nat. Immunol. 2007;8:304–311. doi: 10.1038/ni1438. [DOI] [PubMed] [Google Scholar]
- Hozumi K., Mailhos C., Negishi N., Hirano K., Yahata T., Ando K., Zuklys S., Holländer G.A., Shima D.T., Habu S. Delta-like 4 is indispensable in thymic environment specific for T cell development. J. Exp. Med. 2008;205:2507–2513. doi: 10.1084/jem.20080134. [DOI] [PMC free article] [PubMed] [Google Scholar]
- Hu Y., Smyth G.K. ELDA: extreme limiting dilution analysis for comparing depleted and enriched populations in stem cell and other assays. J Immunol Methods. 2009;347:70–78. doi: 10.1016/j.jim.2009.06.008. [DOI] [PubMed] [Google Scholar]
- Hunziker L., Benitah S.A., Braun K.M., Jensen K., McNulty K., Butler C., Potton E., Nye E., Boyd R., Laurent G. Rac1 deletion causes thymic atrophy. PLoS ONE. 2011;6:e19292. doi: 10.1371/journal.pone.0019292. [DOI] [PMC free article] [PubMed] [Google Scholar]
- Ki S., Park D., Selden H.J., Seita J., Chung H., Kim J., Iyer V.R., Ehrlich L.I. Global transcriptional profiling reveals distinct functions of thymic stromal subsets and age-related changes during thymic involution. Cell Rep. 2014;9:402–415. doi: 10.1016/j.celrep.2014.08.070. [DOI] [PMC free article] [PubMed] [Google Scholar]
- Koch U., Fiorini E., Benedito R., Besseyrias V., Schuster-Gossler K., Pierres M., Manley N.R., Duarte A., Macdonald H.R., Radtke F. Delta-like 4 is the essential, nonredundant ligand for Notch1 during thymic T cell lineage commitment. J. Exp. Med. 2008;205:2515–2523. doi: 10.1084/jem.20080829. [DOI] [PMC free article] [PubMed] [Google Scholar]
- Kyewski B., Klein L. A central role for central tolerance. Annu. Rev. Immunol. 2006;24:571–606. doi: 10.1146/annurev.immunol.23.021704.115601. [DOI] [PubMed] [Google Scholar]
- Le Douarin N.M., Jotereau F.V. Tracing of cells of the avian thymus through embryonic life in interspecific chimeras. J. Exp. Med. 1975;142:17–40. doi: 10.1084/jem.142.1.17. [DOI] [PMC free article] [PubMed] [Google Scholar]
- Livak K.J., Schmittgen T.D. Analysis of relative gene expression data using real-time quantitative PCR and the 2(-Delta Delta C(T)) method. Methods. 2001;25:402–408. doi: 10.1006/meth.2001.1262. [DOI] [PubMed] [Google Scholar]
- Lopes N., Sergé A., Ferrier P., Irla M. Thymic crosstalk coordinates medulla organization and T-cell tolerance induction. Front. Immunol. 2015;6:365. doi: 10.3389/fimmu.2015.00365. [DOI] [PMC free article] [PubMed] [Google Scholar]
- Manley N.R., Richie E.R., Blackburn C.C., Condie B.G., Sage J. Structure and function of the thymic microenvironment. Front. Biosci. (Landmark Ed.) 2011;16:2461–2477. doi: 10.2741/3866. [DOI] [PubMed] [Google Scholar]
- Mathis L., Nicolas J.F. Cellular patterning of the vertebrate embryo. Trends Genet. 2002;18:627–635. doi: 10.1016/s0168-9525(02)02806-8. [DOI] [PubMed] [Google Scholar]
- Mayer C.E., Zuklys S., Zhanybekova S., Ohigashi I., Teh H.Y., Sansom S.N., Shikama-Dorn N., Hafen K., Macaulay I.C., Deadman M.E. Dynamic spatio-temporal contribution of single beta5t+ cortical epithelial precursors to the thymus medulla. Eur. J. Immunol. 2015 doi: 10.1002/eji.201545995. Published online December 23, 2015. [DOI] [PMC free article] [PubMed] [Google Scholar]
- Moore-Scott B.A., Opoka R., Lin S.C., Kordich J.J., Wells J.M. Identification of molecular markers that are expressed in discrete anterior-posterior domains of the endoderm from the gastrula stage to mid-gestation. Dev. Dyn. 2007;236:1997–2003. doi: 10.1002/dvdy.21204. [DOI] [PubMed] [Google Scholar]
- Nijhof J.G., Braun K.M., Giangreco A., van Pelt C., Kawamoto H., Boyd R.L., Willemze R., Mullenders L.H., Watt F.M., de Gruijl F.R., van Ewijk W. The cell-surface marker MTS24 identifies a novel population of follicular keratinocytes with characteristics of progenitor cells. Development. 2006;133:3027–3037. doi: 10.1242/dev.02443. [DOI] [PubMed] [Google Scholar]
- Nitta T., Murata S., Ueno T., Tanaka K., Takahama Y. Thymic microenvironments for T-cell repertoire formation. Adv. Immunol. 2008;99:59–94. doi: 10.1016/S0065-2776(08)00603-2. [DOI] [PubMed] [Google Scholar]
- Nowell C.S., Bredenkamp N., Tetélin S., Jin X., Tischner C., Vaidya H., Sheridan J.M., Stenhouse F.H., Heussen R., Smith A.J., Blackburn C.C. Foxn1 regulates lineage progression in cortical and medullary thymic epithelial cells but is dispensable for medullary sublineage divergence. PLoS Genet. 2011;7:e1002348. doi: 10.1371/journal.pgen.1002348. [DOI] [PMC free article] [PubMed] [Google Scholar]
- Ohigashi I., Zuklys S., Sakata M., Mayer C.E., Hamazaki Y., Minato N., Hollander G.A., Takahama Y. Adult thymic medullary epithelium is maintained and regenerated by lineage-restricted cells rather than bipotent progenitors. Cell Rep. 2015;13:1432–1443. doi: 10.1016/j.celrep.2015.10.012. [DOI] [PubMed] [Google Scholar]
- Onder L., Nindl V., Scandella E., Chai Q., Cheng H.W., Caviezel-Firner S., Novkovic M., Bomze D., Maier R., Mair F. Alternative NF-κB signaling regulates mTEC differentiation from podoplanin-expressing presursors in the cortico-medullary junction. Eur. J. Immunol. 2015;45:2218–2231. doi: 10.1002/eji.201545677. [DOI] [PubMed] [Google Scholar]
- Pellegrini G., Dellambra E., Golisano O., Martinelli E., Fantozzi I., Bondanza S., Ponzin D., McKeon F., De Luca M. p63 identifies keratinocyte stem cells. Proc. Natl. Acad. Sci. USA. 2001;98:3156–3161. doi: 10.1073/pnas.061032098. [DOI] [PMC free article] [PubMed] [Google Scholar]
- Raymond K., Richter A., Kreft M., Frijns E., Janssen H., Slijper M., Praetzel-Wunder S., Langbein L., Sonnenberg A. Expression of the orphan protein Plet-1 during trichilemmal differentiation of anagen hair follicles. J. Invest. Dermatol. 2010;130:1500–1513. doi: 10.1038/jid.2010.4. [DOI] [PubMed] [Google Scholar]
- Reiser H., Schneeberger E.E. The costimulatory molecule B7 is expressed in the medullary region of the murine thymus. Immunology. 1994;81:532–537. [PMC free article] [PubMed] [Google Scholar]
- Ritter M.A., Boyd R.L. Development in the thymus: it takes two to tango. Immunol. Today. 1993;14:462–469. doi: 10.1016/0167-5699(93)90250-O. [DOI] [PubMed] [Google Scholar]
- Rode I., Boehm T. Regenerative capacity of adult cortical thymic epithelial cells. Proc. Natl. Acad. Sci. USA. 2012;109:3463–3468. doi: 10.1073/pnas.1118823109. [DOI] [PMC free article] [PubMed] [Google Scholar]
- Rodewald H.R., Paul S., Haller C., Bluethmann H., Blum C. Thymus medulla consisting of epithelial islets each derived from a single progenitor. Nature. 2001;414:763–768. doi: 10.1038/414763a. [DOI] [PubMed] [Google Scholar]
- Rossi S.W., Jenkinson W.E., Anderson G., Jenkinson E.J. Clonal analysis reveals a common progenitor for thymic cortical and medullary epithelium. Nature. 2006;441:988–991. doi: 10.1038/nature04813. [DOI] [PubMed] [Google Scholar]
- Rossi S.W., Chidgey A.P., Parnell S.M., Jenkinson W.E., Scott H.S., Boyd R.L., Jenkinson E.J., Anderson G. Redefining epithelial progenitor potential in the developing thymus. Eur. J. Immunol. 2007;37:2411–2418. doi: 10.1002/eji.200737275. [DOI] [PubMed] [Google Scholar]
- Rossi S.W., Jeker L.T., Ueno T., Kuse S., Keller M.P., Zuklys S., Gudkov A.V., Takahama Y., Krenger W., Blazar B.R., Holländer G.A. Keratinocyte growth factor (KGF) enhances postnatal T-cell development via enhancements in proliferation and function of thymic epithelial cells. Blood. 2007;109:3803–3811. doi: 10.1182/blood-2006-10-049767. [DOI] [PMC free article] [PubMed] [Google Scholar]
- Rossi S.W., Kim M.Y., Leibbrandt A., Parnell S.M., Jenkinson W.E., Glanville S.H., McConnell F.M., Scott H.S., Penninger J.M., Jenkinson E.J. RANK signals from CD4(+)3(-) inducer cells regulate development of Aire-expressing epithelial cells in the thymic medulla. J. Exp. Med. 2007;204:1267–1272. doi: 10.1084/jem.20062497. [DOI] [PMC free article] [PubMed] [Google Scholar]
- Sekai M., Hamazaki Y., Minato N. Medullary thymic epithelial stem cells maintain a functional thymus to ensure lifelong central T cell tolerance. Immunity. 2014;41:753–761. doi: 10.1016/j.immuni.2014.10.011. [DOI] [PubMed] [Google Scholar]
- Senoo M., Pinto F., Crum C.P., McKeon F. p63 Is essential for the proliferative potential of stem cells in stratified epithelia. Cell. 2007;129:523–536. doi: 10.1016/j.cell.2007.02.045. [DOI] [PubMed] [Google Scholar]
- Shakib S., Desanti G.E., Jenkinson W.E., Parnell S.M., Jenkinson E.J., Anderson G. Checkpoints in the development of thymic cortical epithelial cells. J. Immunol. 2009;182:130–137. doi: 10.4049/jimmunol.182.1.130. [DOI] [PubMed] [Google Scholar]
- Smith A. A glossary for stem-cell biology. Nature. 2006;441:1060. [Google Scholar]
- Snippert H.J., van der Flier L.G., Sato T., van Es J.H., van den Born M., Kroon-Veenboer C., Barker N., Klein A.M., van Rheenen J., Simons B.D., Clevers H. Intestinal crypt homeostasis results from neutral competition between symmetrically dividing Lgr5 stem cells. Cell. 2010;143:134–144. doi: 10.1016/j.cell.2010.09.016. [DOI] [PubMed] [Google Scholar]
- Swann J.B., Boehm T. Back to the beginning--the quest for thymic epithelial stem cells. Eur. J. Immunol. 2007;37:2364–2366. doi: 10.1002/eji.200737709. [DOI] [PubMed] [Google Scholar]
- Ucar A., Ucar O., Klug P., Matt S., Brunk F., Hofmann T.G., Kyewski B. Adult thymus contains FoxN1(-) epithelial stem cells that are bipotent for medullary and cortical thymic epithelial lineages. Immunity. 2014;41:257–269. doi: 10.1016/j.immuni.2014.07.005. [DOI] [PMC free article] [PubMed] [Google Scholar]
- Wong K., Lister N.L., Barsanti M., Lim J.M., Hammett M.V., Khong D.M., Siatskas C., Gray D.H., Boyd R.L., Chidgey A.P. Multilineage potential and self-renewal define an epithelial progenitor cell population in the adult thymus. Cell Rep. 2014;8:1198–1209. doi: 10.1016/j.celrep.2014.07.029. [DOI] [PubMed] [Google Scholar]
Associated Data
This section collects any data citations, data availability statements, or supplementary materials included in this article.