

Abstract
Purpose
To investigate in adults the associations between histologic features of nonalcoholic fatty liver disease (NAFLD) and quantitative measures derived from diffusion-weighted imaging (DWI).
Materials and Methods
Eighty-nine adults undergoing standard-of-care liver biopsy for NAFLD were recruited for DWI. Biopsies were scored for histologic features of NAFLD. DWI was performed using b-values of 0, 100, and 500 s/mm2. Images were reconstructed using either conventional magnitude averaging (CMA) or a method to address bulk motion artifacts (Beta*LogNormal, BLN). The apparent diffusion coefficient (ADC) and the diffusivity (D) and perfusion fraction (F) of the intravoxel incoherent motion (IVIM) model were measured in the right hepatic lobe using both reconstructions. Associations between histologic features and DWI-derived measures were tested statistically with several methods including multiple linear regression.
Results
Using CMA and BLN reconstructions, respectively, the means (and ranges) were 1.7 (1.1–3.5) and 1.4 (1.0–3.2) 10‐3mm2/s for ADC, 1.1 (0.84–1.4) and 0.84 (0.53–1.1) 10−3mm2/s for D, and 17 (5–33) and 18 (2.3–35)% for F. For both reconstruction methods, D decreased with steatosis and F decreased with fibrosis (P < 0.05). ADC was not independently associated with any histologic feature.
Conclusion
Steatosis and fibrosis have significant independent effects on D and F in adults undergoing biopsy for NAFLD.
Keywords: liver, diffusion, NAFLD, NASH, DWI, IVIM
Nonalcoholic fatty liver disease (NAFLD) is an increasingly common metabolic disorder in adults and children in developed countries (1–3). It is defined by the deposition of lipids within hepatocytes in the absence of substantial alcohol intake. Approximately 20% of patients with NAFLD have a progressive form of the condition known as nonalcoholic steatohepatitis (NASH), which is characterized by the presence of inflammation and hepatocellular injury in addition to steatosis. Patients with NASH may develop fibrosis and can progress to cirrhosis (1). NAFLD is now among the most common causes of cirrhosis in the United States and Europe (3). Clinical management and future therapeutic investigations may benefit from a wider array of tools for quantitative evaluation of the fatty liver disease spectrum.
Currently, histology and imaging are both used for evaluating NAFLD (4). In the NASH Clinical Research Network (CRN) Scoring System, liver biopsy specimens are scored for multiple histologic features including steatosis, inflammation, hepatocellular ballooning, and fibrosis (5). The diagnosis of NASH requires a specific pattern of histologic abnormalities that includes, in addition to steatosis, inflammatory cellular infiltrates and hepatocellular ballooning centered around the lobular central vein, with or without fibrosis (6,7). Since liver biopsy is an invasive procedure that samples only a small part of the liver, noninvasive imaging methods are under investigation to fill roles that are complementary or surrogate to histology (4,7).
Diffusion-weighted imaging (DWI) is an magnetic resonance imaging (MRI) method under investigation in liver disease. It is sensitive to the microscopic motion of spins as they diffuse and perfuse through tissue (8). Diffusion and perfusion are affected by several tissue characteristics, including the presence of restrictive barriers within tissue, the viscosity of the fluid in which the spins are diffusing, and the velocity and fractional volume of perfusing spins. These tissue characteristics may be altered in chronic liver diseases such as NAFLD, and several recent animal and human studies have reported that steatosis (9–15), inflammation (9,10,16), and fibrosis (16–19) may affect DWI measurements. However, these prior studies appear not to have examined the independent effects of the various histologic features of NAFLD on DWI measurements (ie, with multiple linear regression) in human subjects to determine whether the observed effects are confounded by or attributable to other histologic features. Also, we sought to investigate the effects of inflammation in NAFLD in human subjects. Furthermore, knowledge of the physics and artifacts of liver DWI has progressed since these prior studies. More detailed models of intravoxel incoherent motion (IVIM) have superseded the apparent diffusion coefficient (ADC) for DWI quantification (20,21), and methods to mitigate the bulk motion artifacts that are prominent in liver have been developed (22,23). The purpose of this study was to evaluate the associations between histologic features of NAFLD and quantitative DWI parameters in a cross-sectional clinical study in adults, incorporating recent advances in DWI methodology.
MATERIALS AND METHODS
Design and Research Patients
In a prospective cross-sectional single-center observational study, a hepatologist (RL) recruited 89 consecutive adult patients in whom clinical standard-of-care liver biopsy was planned for evaluation of suspected NAFLD or reassessment of previously diagnosed NAFLD. Eligibility criteria are summarized in Table 1. Within a 180-day window, study patients underwent a research clinic visit at our institution’s NAFLD Translational Research Unit, as well as liver biopsy and MRI, without therapeutic intervention during that window. The study was Health Insurance Portability and Accountability Act (HIPAA)-compliant and Institutional Review Board (IRB)-approved. All patients signed written informed consent.
Table 1.
Eligibility Criteria
Inclusion:
|
Exclusion:
|
Liver Biopsies and Histologic Grading
Percutaneous right-lobe liver biopsies were obtained with a 16G needle following NASH CRN Standard of Care guidelines. Two slides (hematoxylin and eosin; trichrome) were prepared and were centrally scored by one of two hepatopathologists (MP, CB). Biopsies were scored according to the NASH CRN Scoring System for histologic features of NAFLD, as described in (5), each on a separate ordinal scale: steatosis (0–3), lobular inflammation (0–3), hepatocellular ballooning (0–2), and fibrosis (0–4). NASH was scored as absent (0) or present (1), with borderline cases dichotomized into the positive category (6).
Image Acquisition
To minimize possible postprandial effects, patients were instructed to fast for 4 hours prior to imaging. MRI was performed at 3T (GE Signa Excite scanner, GE Healthcare, Milwaukee, WI). Diffusion-weighted spin-echo echo-planar imaging (DW-SE-EPI) was performed with the following pulse sequence parameters: echo time 45 msec, repetition time 3000 msec, spectral inversion at lipid (SPECIAL) fat suppression, water selective excitation, matrix size 112×112, partial Fourier acquisition 75%, parallel imaging factor 2, field of view (FOV) 40×40 cm, slice thickness 10 mm and spacing 2 mm, voxel dimensions 3.6 mm×3.6 mm×10 mm, voxel volume 128 mm3, with 14 axial slices centered over the liver. Diffusion-weighting gradient direction was constant, with all three gradients applied simultaneously. Multiple separate single-excitation (NEX = 1) magnitude-only images were acquired at each of three b-values, with 8, 16, and 32 repetitions at b = 0, 100, and 500 s/mm2, respectively. Total imaging time for the DW-SE-EPI sequence was 2.8 minutes. Patients were instructed to breathe freely during the acquisition. To shorten acquisition time, cardiac and respiratory gating was not performed.
Recent reports suggest that DWI-derived parameters may be confounded by the presence of hepatic fat (11). Therefore, to assess this possible confounding effect a 2D spoiled gradient-recalled echo sequence was performed to estimate the MRI proton density fat fraction (PDFF), a standardized biomarker of hepatic fat content, as previously described (24,25). Briefly, imaging was performed using a 10° flip angle, six serial in- and out-of-phase echo times (TE=1.15, 2.3, 3.45, 4.6, 5.75, and 6.9 msec), repetition times (TR) ranging from 120–270 msec and matrix size ranging from 160×256 to 192×256 to accommodate patient breath-hold capacity and size, with 8 mm slice thickness, 1480 Hz/pixel receiver bandwidth, and one signal average.
Multiexcitation Image Reconstruction
Two methods were used to reconstruct single images at each slice location from the multiple separate single-excitation images that were acquired. In the first method, conventional magnitude averaging (CMA) of single excitation images was performed. This method addresses bulk motion-induced phase shifts that occur between excitations, but does not address bulk motion-induced signal dropout caused by dephasing during individual excitations (26). In the second method, a statistical technique based on the Beta*LogNormal distribution (BLN) was used to address both sources of error. Specifically, the maximum likelihood estimate of eμ was calculated for each voxel assuming a Beta(α,1)* LogNormal(μ,σ2) distribution of signal intensity over all repetitions (23).
The statistical rationale for this approach is as follows. Conventional magnitude averaging is equivalent to assuming that measured values are normally distributed around the true value with a variance σ2 that represents all types of error. In contrast, the BLN model treats different types of error separately. In the BLN model, measured values are assumed to reach a maximum value distributed around the true value with a variance σ2 that represents noise. The actual measured value is scaled from this maximum value by a random number between zero and one governed by a parameter α that represents signal dropout. This reflects the fact that the signal dropout and noise are distinct phenomena, with different effects on measured values. Specifically, signal dropout never causes measured values to rise above the true value, while noise may do so. The precise functional form of the BLN model was chosen to allow maximum likelihood estimation of the true value, as described previously (23).
Parametic Maps
For both image reconstruction methods, DWI parameter maps were calculated voxel by voxel under monoexponential and biexponential (IVIM) models of signal intensity versus b-value. For the monoexponential model, ADC was calculated as a least-squares fit over all three b-values. The biexponential model is given by the following equation:
| [1] |
which describes signal intensity at a given b-value (Sb) as a function of perfusion fraction (F), pseudodiffusivity (D*), and diffusivity (D). D* has been reported to be less reproducible than D (27). There fore, rather than attempting to measure D* with multiple low b-value images, a three b-value pulse sequence was used to facilitate statistical bulk motion artifact mitigation. Under the assumption that signal from the pseudo-diffusion compartment is negligible at b = 100 s/mm2 (which holds if D*≥70×10−3 mm2/s as shown in prior studies (28)), diffusivity (D) and perfusion fraction (F) were calculated directly according to the following equations:
| [2] |
| [3] |
Thus, three DWI parameters (ADC, D, and F) were calculated using two different image reconstruction methods (CMA and BLN). DWI parameter maps were generated for each slice for every patient and were subjectively assessed for consistency with prior studies (23).
In addition, MRI-PDFF maps were calculated as previously described (25). Briefly, simultaneous estimation of T2* and PDFF was performed voxel-by-voxel by nonlinear least-squares fitting over six echoes using a multipeak lipid spectrum (4.7% [5.3 ppm], 3.9% [4.2 ppm], 0.6% [2.75 ppm], 12.0% [2.1 ppm], 70.0% [1.3 ppm], and 8.8% [0.9 ppm]) derived from in vivo human liver spectroscopy (29).
Image Analysis
Regions of interest (ROIs) were drawn to include the entirety of the right lobe of each patient’s liver in every slice of the DWI images in which it was visible, by a radiology resident (PM) with 2 years of experience and an image analyst (JH) with 1 year of experience. ROIs were drawn on the CMA-reconstructed image for b=100 s/mm2, and were copied without adjustment onto the ADC, D, and F parameter maps from both the CMA and BLN image reconstruction methods. ROIs were drawn to exclude obvious focal lesions. The average value over the ROI was calculated for each DWI parameter from each method for all patients. Mean and range of ROI volumes, calculated by multiplying summed ROI area by slice thickness, is reported in Table 2.
Table 2.
Summary of All Demographic, Histologic, and Quantitative DWI Data
| Subjects | Number: 89 | ||||
|---|---|---|---|---|---|
| Age [yrs] | Mean: 50, Range: 19–75 | ||||
| Gender | Female: 55, Male: 34 | ||||
| BMI [kg/m2] | Mean: 32, Range: 24–46 | ||||
| ROI Volume [cm3] | Mean: 634, Range: 167–1183 | ||||
|
| |||||
| Number of subjects with each score
|
|||||
| Histologic feature | 0 | 1 | 2 | 3 | 4 |
|
| |||||
| Steatosis | 2 | 28 | 31 | 28 | — |
| Lob. Inflam. | 0 | 40 | 46 | 3 | — |
| Hep. Ballooning | 14 | 54 | 21 | — | — |
| NASH | 10 | 79 | — | — | — |
| Fibrosis | 36 | 28 | 11 | 9 | 5 |
|
| |||||
| DWI Parameter | CMA | BLN | P | ||
|
| |||||
| ADC [10−3 mm2/s] | 1.7 (1.1–3.5) | 1.4 (1.0–3.2) | <0.001 | ||
| D [10−3mm2/s] | 1.1 (8.4–1.4) | 0.84 (0.53–1.1) | <0.001 | ||
| F [%] | 17 (5 – 33) | 18 (2.3 – 35) | <0.001 | ||
Patient demographic and histologic data is reported. Mean and range of each DWI parameter is given for each reconstruction method. P–value corresponds to significance of paired Student’s t-test between parameters from CMA versus BLN reconstructions.
CMA = conventional magnitude averaging reconstruction. BLN=beta*log normal reconstruction.
In addition, circular ROIs of diameter 2 cm and area 3.14 cm2 were placed in each of the nine Couinaud liver segments on the PDFF maps, and the average PDFF over all nine segments was recorded for each patient.
Fat Fraction Adjustment
Approximately 10% of the signal from lipid falls under the water peak and is unsuppressed by the chemical shift-dependent suppression techniques used here (11). Therefore, signal from lipid may be present on DWI images in the presence of significant steatosis. Since lipid diffuses two orders of magnitude more slowly than water, unsuppressed lipid may affect diffusion measurements. An approximate correction for these effects can be performed by subtracting 10% of the T2-weighted fat fraction (T2WFF) from the measured signal intensity at each b-value prior to derivation of diffusion parameters. The T2-weighted fat fraction can be calculated from the proton-density fat fraction as follows:
| [4] |
The T2s of water and unsuppressed fat were assumed to be T2w = 23 msec and T2f = 62 msec, as in prior studies (11,29). Assuming that~10% of the fat spectrum is unsuppressed, the adjusted signal intensity is:
| [5] |
After adjustment of signal intensities at each b-value, D and F were recalculated for each patient.
Statistical Analysis
Demographic characteristics were summarized descriptively. The paired Student’s t-test was used to test whether parameters from different reconstruction methods differed. The Jonckheere-Terpstra test was performed to test for trends between the score of each histologic feature and each DWI parameter. The Wilcoxon signed rank test was used to test for differences in each DWI parameter between patients with and without NASH. Multiple linear regression was performed to assess the effect of each histologic feature on each DWI parameter. The regression models used were:
where P = DWI parameter (ADC, D or F), STE= steatosis score, INF lobular inflammation score, BAL = hepatocellular ballooning score, NASH = NASH score, FIB = fibrosis score. Inflammation and ballooning were not included in the same regression models as NASH, since they comprise its definition and are not expected to have independent effects. Histologic scores were modeled as ordinal variables and linear regression coefficients were determined for each. The paired Student’s t-test was used to test whether parameters differed with versus without adjustment. Statistical analysis of the relation of D and F to histologic features was repeated after fat fraction adjustment. The R software package was used for all statistical analysis (R Foundation for Statistical Computing, 2012, http://www.R-project.org).
RESULTS
Population Characteristics
Demographic information and the distribution of histologic features and DWI parameters are given in Table 2. As shown in Fig. 1, a broad range of histologic features and DWI parameters were represented. All but two patients had histology-confirmed NAFLD with steatosis score greater than or equal to 1.
Figure 1.
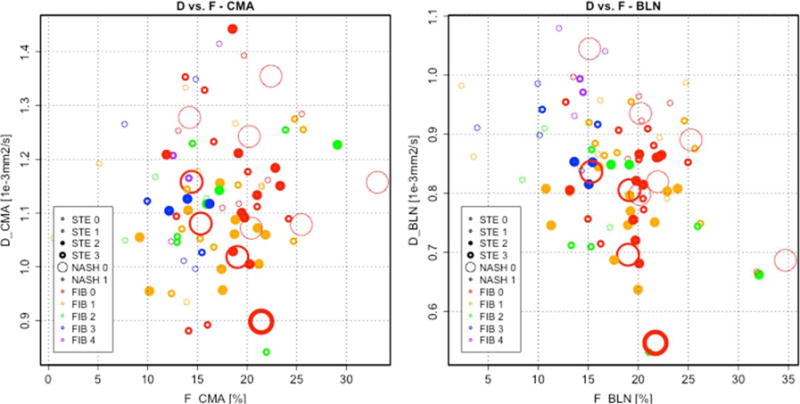
Scatterplots of D and F. D and F are shown for CMA (left) and BLN (right) reconstructions, respectively. Histologic scores for features of NAFLD are indicated by the thickness, size, and color of the circle for steatosis, NASH, and fibrosis, respectively. A wide range of histologic features and DWI parameters are represented.
DWI Parameter Maps
Illustrative DWI images and parameter maps from one patient are shown in Fig. 2. As shown in this case, the left lobe of the liver, as well as some areas of the right lobe, exhibit sporadic signal dropout due to cardiac motion in DWI source images. This causes overall decreased signal intensity in the affected areas in CMA-reconstructed images, which is partially mitigated in the BLN-reconstructed images. Blood vessels such as the portal vein result in elevated values in the ADC and F maps, but not in D maps, in which liver parenchyma appears relatively homogeneous by subjective assessment.
Figure 2.
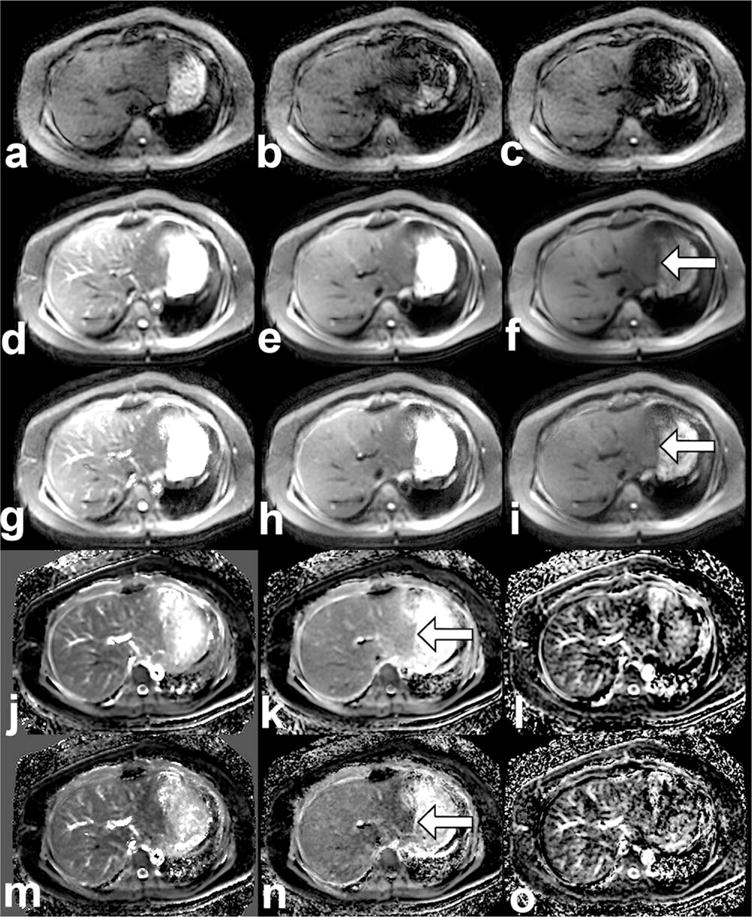
DWI source images, reconstructions, and parameter maps. Single-excitation b = 500 source images are shown (a–c) prior to reconstruction, with varying signal intensity due to bulk motion. Multiexcitation images are shown at b-values (0, 100, 500) for the CMA reconstruction method (d–f) and for the BLN reconstruction method (g–i). Parametric maps are shown for ADC, D, and F from the CMA method (j–l) and from the BLN method (m–o). All images are from a patient with NASH (histologic scores: steatosis 2, inflammation 2, ballooning 2, definite NASH, fibrosis 1a). The scale of each image is as follows: source images and reconstructions (0–300 arbitrary units), ADC (0–5 10−3 mm2/s), D (0–3 10−3 mm2/s) and F (0–50%). Arrows indicate regions in which differences between CMA and BLN reconstructions (f,I) and D maps from each reconstruction (k,n) are the most conspicuous.
Statistical Analysis
ADC, D, and F all differed significantly when calculated with the CMA versus the BLN reconstruction methods (P < 0.001) (Table 2).
Using the CMA and BLN reconstruction methods, several relationships were significant at the P < 0.05 level by the bivariate tests: 1) ADC decreased with inflammation, ballooning, and fibrosis; 2) D decreased with steatosis; and 3) F decreased with inflammation, ballooning, NASH, and fibrosis (Fig. 3).
Figure 3.
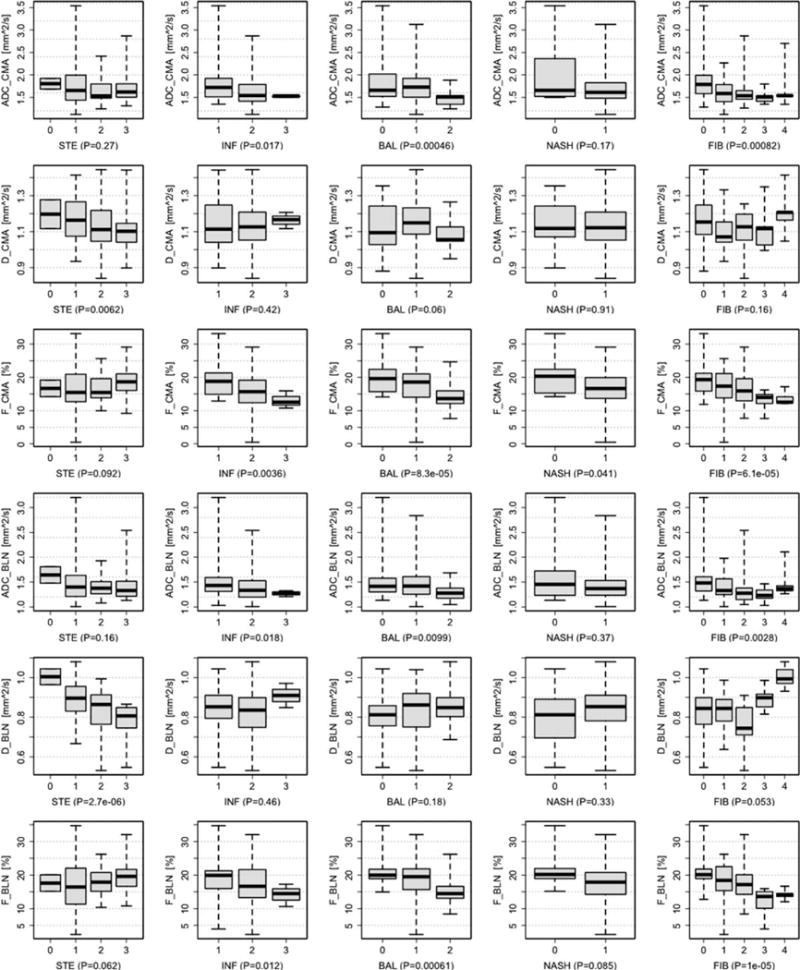
Trend tests. Trends in DWI parameters (ADC top, D middle, F bottom) for each histologic feature (STE: steatosis, INF: inflammation, BAL: ballooning, NASH, and FIB: fibrosis) are shown above. The barplot indicates the minimum, 1st, 2nd, 3rd quartiles, and maximum value of each DWI parameter for each observed score of histologic feature. Plots for ordinal variables are annotated with the P-value of the Jonckheere-Terpstra test for trends. Plot for the categorical variable NASH is annotated with the P-value from the Wilcoxon signed rank test. Parameters derived from the CMA (top) and BLN (bottom) reconstruction methods are shown.
When multiple variable effects were accounted for, only the decrease in D with steatosis and the decrease in F with fibrosis remained significant at the P < 0.05 level (Table 3). The decrease in F with fibrosis under regression model 1 was significant for the BLN but not the CMA reconstruction method. Significance of the effects was generally higher for the BLN reconstruction method.
Table 3.
Multiple Linear Regression Tables
| Regression
|
CMA Reconstruction DWI-Derived Parameter
|
|||
|---|---|---|---|---|
| Model | Coefficient | ADC | D | F |
| 1 | Intercept | 2.262 ± 0.190 | 1.271 ± 0.061 | 21.132 ± 2.316 |
| STE | −0.037 ± 0.052, P = 0.479 | −0.037 ± 0.017, P = 0.032* | 1.262 ± 0.636, P = 0.051. | |
| INF | −0.024 ± 0.090, P = 0.792 | 0.010 ± 0.029, P = 0.718 | −1.319 ± 1.099, P = 0.234 | |
| BAL | −0.179 ± 0.091, P = 0.052 | −0.021 ± 0.029, P = 0.465 | −2.182 ± 1.107, P = 0.052. | |
| FIB | −0.008 ± 0.047, P = 0.866 | 0.000 ± 0.015, P = 0.993 | −0.529 ± 0.570, P = 0.356 | |
| 2 | Intercept | 2.345 ± 0.267 | 1.207 ± 0.084 | 22.570 ± 3.277 |
| STE | −0.057 ± 0.051, P = 0.271 | −0.043 ± 0.016, P = 0.0099** | 0.935 ± 0.628, P = 0.140 | |
| NASH | −0.178 ± 0.145, P = 0.223 | 0.037 ± 0.046, P = 0.415 | −2.925 ± 1.774, P = 0.103 | |
| FIB | −0.056 ± 0.037, P = 0.136 | −0.008 ± 0.012, P = 0.504 | −1.284 ± 0.457, = 0.006** | |
|
| ||||
| Regression
|
BLN Reconstruction DWI-Derived Parameter
|
|||
| Model | Coefficient | ADC | D | F |
|
| ||||
| 1 | Intercept | 1.890 ± 0.170 | 0.944 ± 0.045 | 20.971 ± 2.521 |
| STE | −0.057 ± 0.047, P = 0.226 | −0.059 ± 0.012, P = 7.6e-06*** | 1.160 ± 0.693, P = 0.098. | |
| INF | −0.025 ± 0.081, P = 0.761 | −0.008 ± 0.021, P = 0.718 | −0.678 ± 1.197, P = 0.573 | |
| BAL | −0.088 ± 0.081, P= 0.282 | 0.026 ± 0.021, P = 0.221 | −1.208 ± 1.204, P = 0.319 | |
| FIB | −0.024 ± 0.042, P= 0.561 | 0.013 ± 0.011, P = 0.256 | −1.342 ± 0.621, P = 0.033* | |
| 2 | Intercept | 1.966 ± 0.236 | 0.879 ± 0.061 | 22.659 ± 3.488 |
| STE | −0.066 ± 0.045, P = 0.149 | −0.061 ± 0.012, P = 1.48e-06*** | 1.047 ± 0.669, P = 0.121 | |
| NASH | −0.117 ± 0.128, P = 0.360 | 0.059 ± 0.033, P = 0.080. | −2.229 ± 1.888, P = 0.241 | |
| FIB | −0.048 ± 0.033, P = 0.146 | 0.014 ± 0.008, P = 0.103 | −1.692 ± 0.487, P = 0.0008*** | |
The coefficient ± standard error and significance of the effects of each histologic feature of NAFLD are reported above for both reconstruction methods and both models. The P-value range is specified by the number of adjacent asterisks, as follows:
0–0.001,
0.001–0.01,
0.01–0.05.
Fat Fraction Adjustment
Statistical analysis of the relationships between histologic features of NAFLD and IVIM parameters after fat fraction adjustment is reported in Supplemental Information Fig. S1 and Table S1. Fat fraction adjustment caused small but statistically significant changes in D and F values using both reconstruction methods (P < 0.001). However, the statistically significant relationships with histologic features of NAFLD were largely the same as prior to adjustment, with the exception that, with CMA reconstruction, the decrease in D with steatosis did not remain significant by either the Jonckheere-Terpstra trend test or multiple linear regression.
DISCUSSION
Principle Findings
The principle finding of this study is that steatosis was associated with reduced D and fibrosis with reduced F when adjusted for multiple variable effects. Other relationships—including relationships of D and F with lobular inflammation, hepatocellular ballooning, and NASH—did not remain significant with multiple variable analysis. ADC was not independently associated with any histologic feature.
Additionally, DWI parameters differed depending on the reconstruction method used. The P-values for relationships with histologic features of NAFLD was generally lower with the BLN reconstruction method.
Lastly, fat fraction adjustment did not alter these relationships, except for the relationship between steatosis and D from the CMA reconstruction method, which was no longer significant after adjustment. However, the relationship between steatosis and D from the BLN reconstruction method did remain significant even after fat fraction adjustment.
Interpretation
Possible Mechanisms
The decrease in diffusivity associated with steatosis can be interpreted in two ways. The first possibility is that intracellular lipid restricts diffusion of water within hepatocytes. The second possibility is that lipid peaks near water are incompletely suppressed by the chemical shift-dependent suppression techniques used by the DWI sequence (water selective excitation and spectral inversion at lipid). If so, the measured diffusivity may incorporate the diffusion constant of lipid, which is two orders of magnitude slower than water (11).
Fat fraction adjustment did reduce the significance of the relationships between steatosis and D from CMA reconstruction, suggesting that unsuppressed lipid does affect diffusion measurements to some degree. However, the relationships between steatosis and D from the BLN reconstruction remained significant even after fat fraction adjustment. For this reason, the reduction in D with steatosis is likely not entirely explained by unsuppressed lipid signal. Therefore, restriction of water diffusion by lipid droplets also likely contributes to the reduction of D in steatosis. Further studies examining how DWI parameters change in response to compartmentspecific weighting based on water-fat relaxivity differences may help further address this question, similar to the methodology of prior studies (30).
The decrease in perfusion fraction seen with fibrosis likely represents reduced hepatic blood flow, in agreement with several other prior studies (19), as described below.
The absence of other significant effects may be due either to insufficient sample size in this study or to the insensitivity of the current implementation of DWI to those histologic features. The lack of associations between DWI parameters and inflammatory features may limit the utility of the current implementation of DWI in assessment of NAFLD, since multiecho imaging and elastography are already available for assessment of steatosis (4,25,31–33) and fibrosis (34), respectively.
Comparison With Prior Studies
Our results build on those of prior studies by including multiple linear regression to separate the effects of histologic features of NAFLD on DWI parameters in a prospective clinical study in humans. Our study is a large prospective study that examines DWI parameters in adults with NAFLD in which liver biopsy was performed in all patients as reference standard. Our findings recapitulate some but not all of the results of prior studies. The observed discrepancies may arise from a variety of factors such as the population that was included and compared in each study, and the choice of technical parameters such as b-value in each study (Table 4).
Table 4.
Prior Studies of DWI in Chronic Liver Disease
| Study | Population | b-values | ADC | D | F | D* | Inflammation Assessed? | Other Pertinent Features |
|---|---|---|---|---|---|---|---|---|
| Animal models of NAFLD: | ||||||||
| Anderson et al (10) | - 3 mice with normal diet - 14 mice with MCD diet |
21, 301, 601 | ↓ with histologic steatosis and inflammation. | – | – | – | Yes, but multiple linear regression not performed. | Imaging performed after animal sacrifice, therefore no perfusion effects. |
| Joo et al (9) | - 27 rabbits fed fatty diet, with range of NAFLD activity scores (NAS): - 6 with NAS 0; 4 with NAS 1–2; 6 with NAS 3–4; 11 with NAS ≥ 5. |
0, 50, 100, 150, 200, 400, 800 | NS | NS | ↓ with NAS and steatosis. No effect of lobular inf. or hep. ballooning in multiple linear regression. | NS | Yes, and multiple linear regression was performed. | maging performed prior to animal sacrifice. |
| Human studies of NAFLD: | ||||||||
| Poyraz et al (12) | - 78 DEI-FF < 5% (average 1%) - 42 DEI-FF > 5% (average 13%) |
0, 1000 | ↓ in steatosis | – | – | – | No | – |
| Hansman et al (11) | - 27 MRS-FF < 5.56% (average 2%) - 16 MRS-FF > 5.56% (average 13%) |
0, 500 | ↓ correlation with MRS-FF, but not different between two groups. | – | – | – | No | – |
| Eatesem et al (13) | - 12 normals - 9 biopsy-proven NAFLD - 7 HCV + HIV |
0, 600 |
↓ in NAFLD ↓ in HCV/HIV |
– | – | – | No | – |
| Guiu et al (14) | - 68 diabetics, MRS-FF < 5.56% - 40 diabetics, MRS-FF > 5.56% |
0, 5, 15, 25, 35, 50, 100, 200, 400, 600, 800 | ↓. with steatosis | ↑ with steatosis | ↓ with steatosis | No | Excluded patients with fibrosis ≥ F2 by FibroTest. | |
| Leitao et al (15) | - 14 normals - 5 histologically-proven steatosis |
0, 10, 20, 30, 40, 50, 75, 100, 150, 300, 500 | NS | ↓. with steatosis | NS | NS | No | Excluded patients with histologic fibrosis or inflammation |
| Human studies of Fibrosis/Cirrhosis: | ||||||||
| Taouli et al (16) | - 13 normals - 31 chronic liver disease from viral hepatitis or alcohol, 1 with NAFLD |
0, 500 |
↓ with fibrosis ↓ with inflammation |
– | – | – | Yes, but multiple linear regression not performed | Fibrosis and inflammation graded histologically in patients. |
| Luciani et al (18) | - 25 healthy - 12 cirrhosis from alcohol or viral hepatitis, diagnosed by biopsy |
0, 10, 20, 30, 50, 80, 100, 200, 400, 800 | ↓. with cirrhosis | NS | NS | ↓ with cirrhosis | No | Excluded fatty liver patients |
| Patel et al (19) | - 16 normals - 14 with cirrhosis primarily from viral hepatitis or alcohol diagnosed in a variety of ways |
0, 50, 100, 150, 200, 300, 500, 700, 1000 | ↓. with cirrhosis | ↓. with cirrhosis | ↓. with cirrhosis | ↓ with cirrhosis | No | – |
Abbreviations: “-” = not assessed or reported; NS = no statistically significant difference between groups; MCD = methionine and choline deficient; HCV = hepatitis C virus; HIV = human immunodeficiency virus; NAS = NAFLD activity score (sum of steatosis, inflammation, and ballooning scores); DEI-FF = dual echo imaging fat fraction; PDFF = proton density fat fraction; MRS-FF = magnetic resonance spectroscopy fat fraction.
Steatosis
Recent studies in patients with NAFLD have shown a reduction in ADC with steatosis as assessed by spectroscopy (11), by dual-echo imaging (12), or by histology (13,15) when compared to individuals without steatosis. Two recent studies using the IVIM model report that D is reduced with steatosis as assessed by dual-echo imaging (14) or by histology (15). One of these studies also suggested that F is increased with steatosis (14). Our results recapitulate only the reduction in D with steatosis. It is possible that changes in D with steatosis could underlie the previously reported changes in ADC, although it is not clear why our results did not recapitulate the changes in ADC with steatosis.
Inflammation
The association of inflammation with DWI measurements has been less commonly reported, likely due to the paucity of clinical or imaging markers that can be used as surrogates for histologic inflammation. Three studies of liver DWI in which histologic measures of inflammation were available have been published.
First, in a rabbit model of NAFLD, F decreased with steatosis, but not with lobular inflammation or hepatocellular ballooning, when examined with multiple linear regression (9). ADC and D were also measured in that study, but were not associated with any histologic feature of NAFLD. Our findings are consistent with the results suggesting that inflammation does not have strong independent effects on DWI measurements, although neither of the primary positive results we report were recapitulated in that study.
Second, in a murine model of NAFLD, ADC decreased with both steatosis and inflammation as assessed by histology (10). Finally, in a clinical study of patients with cirrhosis (mostly due to viral or alcoholic liver disease), ADC decreased with both fibrosis and inflammation as assessed by histology (16). Multiple linear regression was not performed in these two studies to assess the effects of inflammation independent of steatosis or fibrosis. Our results suggest that potential confounding effects of steatosis and fibrosis should be considered when imaging associations of inflammation are studied in NAFLD in the future.
Fibrosis
Prior studies have shown reductions in ADC (16,18,34) as well as reductions in D and F (19) in patients with presumed or histologically proven fibrosis or cirrhosis when compared to normal individuals. The predominant etiology of chronic liver disease in these studies was viral hepatitis and alcoholic liver disease. Our multiple linear regression results recapitulate only the reduction in F with fibrosis, although a reduction in ADC with fibrosis was also seen before adjusting for multiple variable effects. Our study had relatively few individuals with advanced fibrosis, which may limit our power to detect some of the previously reported effects. However, as our study was a prospective study including consecutively recruited adults with clinical indication for liver biopsy, our study cohort may better reflect the target population of interest.
Limitations
There are several limitations to our study. First, the pulse sequence used here was optimized for calculating D and F, but did not allow for calculation of the pseudo-diffusivity (D*). Thus, the associations of D* with histologic features of NAFLD could not be reported here; however, the low reproducibility of this parameter (27) limits its potential applicability.
Second, differences were present in results from CMA and BLN reconstruction methods, and associations with histology were more significant for the BLN reconstruction method. One possible explanation is that BLN reconstruction helped mitigate bulk motion effects that were not eliminated by drawing ROIs in only the right lobe. This suggests that BLN reconstruction is a promising approach for correcting signal dropout from bulk motion, but further investigation is required to identify the optimal method for this purpose.
Third, the reproducibility of these results across field and gradient strengths has not been examined. If there are relaxivity differences between IVIM compartments, then DWI measurements may vary depending on these factors. Finally, since DWI was performed only during free breathing, our study did not evaluate breath-hold or respiratory-triggered DWI acquisitions.
Clinical Implication and Conclusion
In conclusion, this study demonstrates significant independent effects of steatosis and fibrosis on IVIM measurements, in agreement with the results of prior studies. Although lobular inflammation, hepatocellular ballooning, and NASH were examined, no significant associations with IVIM measurements were found when multiple variable effects were taken into account. These results demonstrate that histologic features of NAFLD significantly affect IVIM-derived parameters, and that confounding effects of steatosis and fibrosis should be considered when imaging associations of NAFLD and NASH are studied in the future. By comparison, ADC was not independently associated with any histologic feature. Finally, although significant effects between DWI-derived parameters and inflammation were not observed using the current implementation of DWI, it is possible that refinement of DWI acquisition, reconstruction, and analysis methods may uncover such associations in the future.
Supplementary Material
Acknowledgments
The authors thank An Tang and Gavin Hamilton for many helpful discussions. The study was conducted at the Clinical and Translational Research Institute, University of California at San Diego. R.L. is supported in part by the American Gastroenterological Association (AGA) Foundation – Sucampo – ASP Designated Research Award in Geriatric Gastroenterology and by a T. Franklin Williams Scholarship Award; Funding provided by: Atlantic Philanthropies, Inc, the John A. Hartford Foundation, the Association of Specialty Professors, and the American Gastroenterological Association and grant K23-DK090303. Additional funding was provided by RSNA Research Resident Grant Award RR1225, NIH T32 T32EB005970, and GE Healthcare.
Footnotes
Additional Supporting Information may be found in the online version of this article at the publishers website.
References
- 1.Chalasani N, Younossi Z, Lavine JE, et al. The diagnosis and management of non-alcoholic fatty liver disease: practice Guideline by the American Association for the Study of Liver Diseases, American College of Gastroenterology, and the American Gastroenterological Association. Hepatology. 2012;55:2005–2023. doi: 10.1002/hep.25762. [DOI] [PubMed] [Google Scholar]
- 2.Loomba R, Abraham M, Unalp A, et al. Association between diabetes, family history of diabetes and risk of nonalcoholic steatohepatitis and fibrosis. Hepatology. 2012;56:943–951. doi: 10.1002/hep.25772. [DOI] [PMC free article] [PubMed] [Google Scholar]
- 3.Loomba R, Sanjal A. The global NAFLD epidemic. Nat Rev Hepatol. 2013;10:686–690. doi: 10.1038/nrgastro.2013.171. [DOI] [PubMed] [Google Scholar]
- 4.Noureddin M, Lam J, Peterson MR, et al. Utility of magnetic resonance imaging versus histology for quantifying changes in liver fat in nonalcoholic fatty liver disease trials. Hepatology. 2013;58:1930–1940. doi: 10.1002/hep.26455. [DOI] [PMC free article] [PubMed] [Google Scholar]
- 5.Kleiner DE, Brunt EM, Van Natta M, et al. Design and validation of a histological scoring system for nonalcoholic fatty liver disease. Hepatology. 2005;41:1313–1321. doi: 10.1002/hep.20701. [DOI] [PubMed] [Google Scholar]
- 6.Brunt EM, Kleiner DE, Wilson LA, Belt P, Neuschwander-Tetri BA. Nonalcoholic fatty liver disease (NAFLD) activity score and the histopathologic diagnosis in NAFLD: distinct clinicopathologic meanings. Hepatology. 2011;53:810–820. doi: 10.1002/hep.24127. [DOI] [PMC free article] [PubMed] [Google Scholar]
- 7.Stinton L, Loomba R. Recommendations for liver biopsy evaluation in non-alcoholic fatty liver disease. Minerva Gastroentol Dietol. 2014;60:5–13. [PubMed] [Google Scholar]
- 8.Taouli B, Koh D-M. Diffusion-weighted MR imaging of the liver. Radiology. 2010;254:47–66. doi: 10.1148/radiol.09090021. [DOI] [PubMed] [Google Scholar]
- 9.Joo I, Lee JM, Yoon JH, Jang JJ, Han JK, Choi BI. Nonalcoholic fatty liver disease: intravoxel incoherent motion diffusion-weighted MR imaging — an experimental study in a rabbit model. Radiology. 2014;270:131–140. doi: 10.1148/radiol.13122506. [DOI] [PubMed] [Google Scholar]
- 10.Anderson SW, Soto JA, Milch HN, et al. Effect of disease progression on liver apparent diffusion coefficient values in a murine model of NASH at 11.7 Tesla MRI. J Magn Reson Imaging. 2011;33:882–888. doi: 10.1002/jmri.22481. [DOI] [PubMed] [Google Scholar]
- 11.Hansmann J, Hernando D, Reeder SB. Fat confounds the observed apparent diffusion coefficient in patients with hepatic steatosis. Magn Reson Med. 2013;69:545–552. doi: 10.1002/mrm.24535. [DOI] [PMC free article] [PubMed] [Google Scholar]
- 12.Poyraz AK, Onur MR, Kocakoç E, Oğur E. Diffusion-weighted MRI of fatty liver. J Magn Reson Imaging. 2012;35:1108–1111. doi: 10.1002/jmri.23519. [DOI] [PubMed] [Google Scholar]
- 13.Eatesam M, Noworolski SM, Tien PC, et al. Liver diffusivity in healthy volunteers and patients with chronic liver disease: comparison of breathhold and free-breathing techniques. J Magn Reson Imaging. 2011;35:103–109. doi: 10.1002/jmri.22748. [DOI] [PMC free article] [PubMed] [Google Scholar]
- 14.Guiu B, Petit J-M, Capitan V, et al. Intravoxel incoherent motion diffusion-weighted imaging in nonalcoholic fatty liver: a 3.0-T MR study. Radiology. 2012;265:96–103. doi: 10.1148/radiol.12112478. [DOI] [PubMed] [Google Scholar]
- 15.Leitão HS, Doblas S, d’Assignies G, et al. Fat deposition decreases diffusion parameters at MRI: a study in phantoms and patients with liver steatosis. Eur Radiol. 2013;23:461–467. doi: 10.1007/s00330-012-2626-8. [DOI] [PubMed] [Google Scholar]
- 16.Taouli B, Chouli M, Martin AJ, Qayyum A, Coakley FV, Vilgrain V. Chronic hepatitis: role of diffusion-weighted imaging and diffusion tensor imaging for the diagnosis of liver fibrosis and inflammation. J Magn Reson Imaging. 2008;28:89–95. doi: 10.1002/jmri.21227. [DOI] [PubMed] [Google Scholar]
- 17.Wang Y, Ganger DR, Levitsky J, et al. Assessment of chronic hepatitis and fibrosis: comparison of MR elastography and diffusion-weighted imaging. AJR Am J Roentgenol. 2011;196:553–561. doi: 10.2214/AJR.10.4580. [DOI] [PMC free article] [PubMed] [Google Scholar]
- 18.Luciani A, Vignaud A, Cavet M, et al. Liver cirrhosis: intravoxel incoherent motion MR imaging — pilot study. Radiology. 2008;249:891–899. doi: 10.1148/radiol.2493080080. [DOI] [PubMed] [Google Scholar]
- 19.Patel J, Sigmund EE, Rusinek H, Oei M, Babb JS, Taouli B. Diagnosis of cirrhosis with intravoxel incoherent motion diffusion MRI and dynamic contrast-enhanced MRI alone and in combination: preliminary experience. J Magn Reson Imaging. 2010;31:589–600. doi: 10.1002/jmri.22081. [DOI] [PMC free article] [PubMed] [Google Scholar]
- 20.LeBihan D, Breton E, Lallemand D, Aubin M-L, Vignaud J, Laval-Jeantet M. Separation of diffusion and perfusion in intravoxel incoherent motion MR imaging. Radiology. 1988;168:497–505. doi: 10.1148/radiology.168.2.3393671. [DOI] [PubMed] [Google Scholar]
- 21.LeBihan D. Intravoxel incoherent motion perfusion MR imaging: a wake-up call. Radiology. 2008;249:748–752. doi: 10.1148/radiol.2493081301. [DOI] [PubMed] [Google Scholar]
- 22.Liau J, Lee J, Schroeder ME, Sirlin CB, Bydder M. Cardiac motion in diffusion-weighted MRI of the liver: artifact and a method of correction. J Magn Reson Imaging. 2012;35:318–327. doi: 10.1002/jmri.22816. [DOI] [PMC free article] [PubMed] [Google Scholar]
- 23.Murphy P, Wolfson T, Gamst A, Sirlin C, Bydder M. Error model for reduction of cardiac and respiratory motion effects in quantitative liver DW-MRI. Magn Reson Med. 2013;70:1460–1469. doi: 10.1002/mrm.24563. [DOI] [PMC free article] [PubMed] [Google Scholar]
- 24.Reeder SB, Hu HH, Sirlin CB. Proton density fat-fraction: a standardized MR-based biomarker of tissue fat concentration. J Magn Reson Imaging. 2012;36:1011–1014. doi: 10.1002/jmri.23741. [DOI] [PMC free article] [PubMed] [Google Scholar]
- 25.Tang A, Tan J, Sun M, et al. Nonalcoholic fatty liver disease: MR imaging of liver proton density fat fraction to assess hepatic steatosis. Radiology. 2013;267:422–431. doi: 10.1148/radiol.12120896. [DOI] [PMC free article] [PubMed] [Google Scholar]
- 26.Bernstein M, King K, Zhou X. Handbook of MRI pulse sequences. Burlington, MA: Elsevier Academic Press; 2004. [Google Scholar]
- 27.Kakite S, Dyvorne H, Besa C, et al. Hepatocellular carcinoma: short-term reproducibility of apparent diffusion coefficient and intravoxel incoherent motion parameters at 3.0T. J Magn Reson Imaging. 2014;39:1–8. doi: 10.1002/jmri.24538. [DOI] [PubMed] [Google Scholar]
- 28.Lee JT, Liau J, Murphy P, Schroeder ME, Sirlin CB, Bydder M. Cross-sectional investigation of correlation between hepatic steatosis and IVIM perfusion on MR imaging. J Magn Reson Imaging. 2012;30:572–578. doi: 10.1016/j.mri.2011.12.013. [DOI] [PMC free article] [PubMed] [Google Scholar]
- 29.Hamilton G, Yokoo T, Bydder M, et al. In vivo characterization of the liver fat 1H MR spectrum. NMR Biomed. 2011;24:784–790. doi: 10.1002/nbm.1622. [DOI] [PMC free article] [PubMed] [Google Scholar]
- 30.Lemke A, Laun FB, Simon D, Stieltjes B, Schad LR. An in vivo verification of the intravoxel incoherent motion effect in diffusion-weighted imaging of the abdomen. Magn Reson Med. 2010;64:1580–1585. doi: 10.1002/mrm.22565. [DOI] [PubMed] [Google Scholar]
- 31.Le T-A, Chen J, Changchien C, et al. Effect of colesevelam on liver fat quantified by magnetic resonance in nonalcoholic steatohepatitis: a randomized controlled trial. Hepatology. 2012;56:922–932. doi: 10.1002/hep.25731. [DOI] [PMC free article] [PubMed] [Google Scholar]
- 32.Hoofnagle JH, Van Natta ML, Kleiner DE, et al. Vitamin E and changes in serum alanine aminotransferase levels in patients with non-alcoholic steatohepatitis. Aliment Pharmacol Ther. 2013;38:134–143. doi: 10.1111/apt.12352. [DOI] [PMC free article] [PubMed] [Google Scholar]
- 33.Permutt Z, Le T, Peterson MR, et al. Correlation between liver histology and novel magnetic resonance imaging in adult patients with non-alcoholic fatty liver disease — MRI accurately quantifies hepatic steatosis in NAFLD. Aliment Pharmacol Ther. 2012;36:22–29. doi: 10.1111/j.1365-2036.2012.05121.x. [DOI] [PMC free article] [PubMed] [Google Scholar]
- 34.Wang Y, Ganger DR, Levitsky J, et al. Assessment of chronic hepatitis and fibrosis: comparison of MR elastography and diffusion-weighted imaging. AJR Am J Roentgenol. 2011;196:553–561. doi: 10.2214/AJR.10.4580. [DOI] [PMC free article] [PubMed] [Google Scholar]
Associated Data
This section collects any data citations, data availability statements, or supplementary materials included in this article.