

Abstract
Purpose
To determine the accuracy and the effect of possible subject-based confounders of magnitude-based magnetic resonance imaging (MRI) for estimating hepatic proton density fat fraction (PDFF) for different numbers of echoes in adults with known or suspected nonalcoholic fatty liver disease, using MR spectroscopy (MRS) as a reference.
Materials and Methods
In this retrospective analysis of 506 adults, hepatic PDFF was estimated by unenhanced 3.0T MRI, using right-lobe MRS as reference. Regions of interest placed on source images and on six-echo parametric PDFF maps were colocalized to MRS voxel location. Accuracy using different numbers of echoes was assessed by regression and Bland–Altman analysis; slope, intercept, average bias, and R2 were calculated. The effect of age, sex, and body mass index (BMI) on hepatic PDFF accuracy was investigated using multivariate linear regression analyses.
Results
MRI closely agreed with MRS for all tested methods. For three- to six-echo methods, slope, regression intercept, average bias, and R2 were 1.01–0.99, 0.11–0.62%, 0.24–0.56%, and 0.981–0.982, respectively. Slope was closest to unity for the five-echo method. The two-echo method was least accurate, underestimating PDFF by an average of 2.93%, compared to an average of 0.23–0.69% for the other methods. Statistically significant but clinically nonmeaningful effects on PDFF error were found for subject BMI (P range: 0.0016 to 0.0783), male sex (P range: 0.015 to 0.037), and no statistically significant effect was found for subject age (P range: 0.18–0.24).
Conclusion
Hepatic magnitude-based MRI PDFF estimates using three, four, five, and six echoes, and six-echo parametric maps are accurate compared to reference MRS values, and that accuracy is not meaningfully confounded by age, sex, or BMI.
Hepatic steatosis is the histologic hallmark of nonalcoholic fatty liver disease (NAFLD).1–3 Proton density fat fraction (PDFF), a noninvasive biomarker of hepatic steatosis,4 is accurately and precisely estimated in subjects with known or suspected NAFLD by magnetic resonance imaging (MRI), using MR spectroscopy (MRS) as reference5–7. MRI and MRS hepatic PDFF have been used as clinical trial endpoints,8,9 and MRI has been used to diagnose and follow NAFLD.10
Two advanced MRI methods have been developed to estimate hepatic PDFF: complex-based MRI; using the real and imaginary components of image data,11 and magnitude-based MRI; using only the magnitude of image data.12 Agreement between these methods for PDFF estimation is strong, with complex-based MRI perhaps being slightly more accurate than magnitude-based MRI.13 However, C-MRI is not yet widely available and usually requires specialized acquisition software, whereas magnitude-based MRI can be implemented on most MR scanners using routinely available sequences.
Several studies have used six echoes to assess MRI hepatic PDFF accuracy.5–7 Two recent studies suggested that using fewer echoes may be more accurate.7,14 Prior studies have been modest in size and so were not adequately powered to investigate subject-based confounders such as age, sex, and body mass index (BMI).5–7 At least six studies listed on www.clinicaltrials.gov use magnitude-based MRI as a biomarker for hepatic steatosis. It is thus important to confirm the accuracy of magnitude-based MRI PDFF in a larger cohort of subjects using different numbers of echoes, and to determine whether common subject-based factors confound those results.
Hence, the purpose of this analysis was to determine the accuracy and effect of possible subject-based confounders of magnitude-based MRI for estimating hepatic PDFF for different numbers of echoes in adults with known or suspected NAFLD, using MRS as reference.
Materials and Methods
This cross-sectional, retrospective analysis was approved by our Institutional Review Board and is compliant with the Health Insurance Portability and Accountability Act.
In all, 580 MR examinations obtained at our institution between January 2009 and December 2013 as part of prior prospective clinical trials for 507 subjects with known or suspected NAFLD were considered for this analysis. Subjects with biopsy-proven or suspected NAFLD recruited at our NAFLD translational research unit were referred for MR examination. Suspicion of NAFLD was based on the presence of at least one of the following: 1) elevated liver transaminases in the presence of obesity, 2) diabetes mellitus, 3) family history of NAFLD, or 4) unexplained elevation of liver transaminases. Inclusion criteria were subjects ≥20 yrs of age, and same-day MRI and MRS scans. Exclusion criteria were: i) chronic alcohol consumption or abuse, ii) non-NAFLD hepatitis (such as viral hepatitis), iii) other non-NAFLD chronic liver disease (such as hemosiderosis), or iv) MR contraindication. For each subject only the first MRI was selected, so 73 same-subject second and third MR examinations were excluded. One subject was excluded because of severe MR image motion artifact at the MRS voxel location. Hence, a total of 506 subjects were included in this analysis.
Age, sex, and BMI were recorded from research case report forms so that their possible effect on liver PDFF estimation could be tested.
MR Examinations
MRI
Subjects were scanned in the supine position using a 3T MR scanner (SIGNA Excite HDxt; GE Medical Systems; Milwaukee, WI) using an eight-channel torso phased-array surface coil centered over the liver, with a dielectric pad placed over the abdomen. Two-dimensional noncontrast axial liver magnitude-based MRI was performed using a spoiled gradient-recalled-echo sequence. Low flip angle (108) was used with repetition times (TRs) of 100–300 msec to minimize T1 weighting.11,15–17 Six fractional-echo magnitude images were obtained at nominally in-phase (IP) and out-phase (OP) echo times (~1.15, 2.3, 3.45, 4.6, 5.75, and 6.9 msec) in a single 12–24-second breath-hold. Other imaging parameters were as follows: slice thickness 8–10 mm; 14–26 slices (default, 23) covering most, but preferably all of the liver; slice gap 0 mm; receiver bandwidth ±142 kHz; base matrix range from 160 to 288 frequency encoding steps, and from 128 to 224 phase encoding steps; and rectangular field of view adjusted to body habitus.
MRS
A 20 × 20 × 20 mm MRS voxel was placed in the right lobe of the liver avoiding large blood vessels, bile ducts, and liver edges. Following automated shimming, stimulated echo acquisition mode proton spectroscopy was performed with TR = 3500 msec to minimize T1 weighting, and mixing time of 5 msec to minimize j-coupling and T1 weighting. Five spectra were collected at echo times of 10, 15, 20, 25, and 30 msec in a single breath-hold (~20 sec) to permit T2 estimation while minimizing fat-peak j-coupling.18
Hepatic PDFF Estimation
MRI
MRI analysis was done by a research scholar (E.R.H., 2 years of experience), blinded to the MRS results. Three 1-cm radius regions of interest (ROIs), colocalized to the MRS voxel location were placed on fifth-echo source images, which consistently provide adequate anatomic delineation for colocalization. ROIs were then propagated to images for the other echoes, and mean signal intensity values were recorded.
Source-echo MRI signal intensities were analyzed with Mat-Lab (MathWorks, Natick, MA) using a custom fitting algorithm (see Appendix in the online Supplement).6,7,14,15,19,20 The algorithm also estimates and corrects for T2* (for analyses with three or more echoes) assuming exponential decay. PDFF (spectrally, and T2*-corrected) and T2* were estimated using the first three, four, five, and (all) six echoes. PDFF (spectrally, but not T2*-corrected) was estimated using the first two echoes. To explore how T2* correction affects two-echo PDFF estimation, two-echo PDFF values were corrected for exponential T2* decay using T2* values estimated from the six-echo method (henceforth called the T2*-corrected two-echo method).
Six-echo parametric PDFF (spectrally, and T2*-corrected) maps were generated offline by applying the same algorithm pixel-by-pixel using an Osirix (Osirix Foundation, Geneva, Switzerland) custom open-source software plug-in.21 The three ROIs from fifth-echo source images (as above) were propagated to parametric PDFF maps, and mean PDFF values recorded.
MRS
The spectra from the individual channels were combined using singular value decomposition.22 MRS data were analyzed offline by an MR physicist (G.H., >12 years of experience) using the advanced method for accurate, robust, and efficient spectral fitting (AMARES) algorithm in Java-based MR user-interface software.23,24 Contributions from the two fat peaks close to the water peak (4.2 and 5.3 ppm) were estimated using a previously established standard liver spectrum.19 MRS PDFF values were estimated as the ratio of the sum of areas under all fat peaks, to the sum of areas under the water and all fat peaks.
Statistical Analysis
The analysis cohort was summarized descriptively.
Bland–Altman plots were generated to show the difference between MRS and MRI PDFF across the entire averaged (MRS plus MRI) PDFF range. Ninety-five percent limits of agreement and Bland–Altman bias (the average difference between MRS and MRI PDFF) were computed for each method.
Accuracy of each MRI PDFF estimation method (two-, three-, four-, five-, and (all) six-echo ROI-based; and six-echo parametric map-based) was assessed using MRS PDFF as reference. For each method, univariate linear regression analyses were used to model MRS PDFF as a function of MRI PDFF. The resulting regression equations describe how to transform MRI PDFF from each method to predict (reference) MRS PDFF.
The following metrics were obtained for each regression: slope, intercept, average bias of regression (defined as the square root of the averaged squared difference between the regression line and the “identity” MRS = MRI line), and R2 (proportion of variance explained by the regression). Bootstrap-based, bias-corrected accelerated confidence intervals were computed around each parameter. Since the data were dependent (MRS and MRI estimation methods were applied to the same subjects), bootstrap-based tests were used to compare regression parameters of different models. PDFF estimated by the T2*-corrected two-echo method was compared to that estimated by the six-echo ROI-based method using a paired t-test.
T2* values estimated using the three-, four-, five-, and six-echo ROI-based methods were compared pairwise using paired t-tests.
Subanalyses were performed to test age, sex, and BMI as possible confounders of agreement between MRS and MRI. We used multivariate linear regression analyses to model the absolute difference between MRS and MRI PDFF of each ROI-based method and of the parametric map-based method as a function of these factors (ie, we examined whether any of these factors were associated with error size).
Results
In all, 506 adults with known or suspected NAFLD were included in this retrospective analysis (267 male, 239 female). Cohort characteristics are summarized in Table 1. Sample MR images showing MRS voxel placement, fifth echo MR images showing ROI placement, and parametric PDFF maps are illustrated in Fig. 1. Sample MR spectra are illustrated in Fig. 2.
TABLE 1.
Ranges, Means, and Standard Deviations of Subject Age, MRS PDFF, and BMI
| Group | Subjects number (%) | Age (yrs) range (mean ± SD) |
MRS PDFF (%) range (mean ± SD) |
Subjects with recorded BMI number (%) | BMI (kg/m2) range (mean ± SD) |
|---|---|---|---|---|---|
| Total | 506 (100) | 20–92 | 0.1–38.3 | 489 (97) | 15.6–51.6 |
| (49.2 ± 14.0) | (10.1 ± 8.6) | (30.0 ± 6.2) | |||
| Male | 267 (53) | 20–92 | 0.1–34.2 | 254 (95) | 15.6–42.5 |
| (49.0 ± 13.8) | (9.5 ± 8.5) | (29.1 ± 5.0) | |||
| Female | 239 (47) | 21–82 | 0.3–38.3 | 235 (98) | 16.7–51.6 |
| (49.4 ± 14.1) | (10.7 ± 8.7) | (31.0 ± 7.1) |
PDFF = proton density fat fraction, BMI = body mass index, SD = standard deviation, MRS = magnetic resonance spectroscopy.
FIGURE 1.
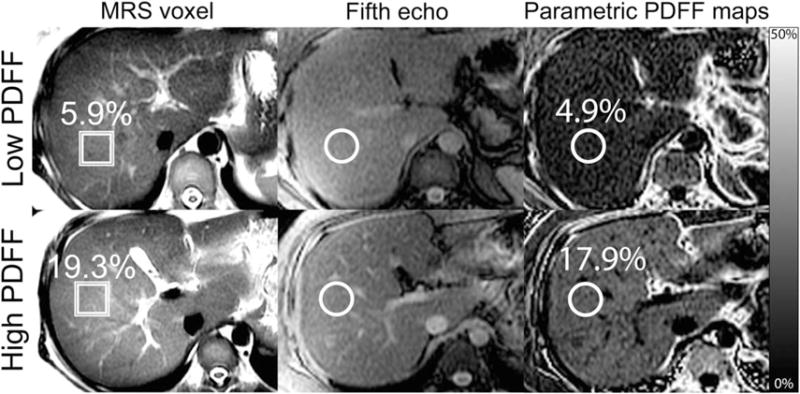
ROI colocalization. This set of images shows, for representative cases of both low (first row) and high (second row) hepatic PDFF, how colocalization ROIs are placed on fifth-echo source images (second column) and parametric PDFF maps (third column) at the MRS voxel location (first column).
FIGURE 2.
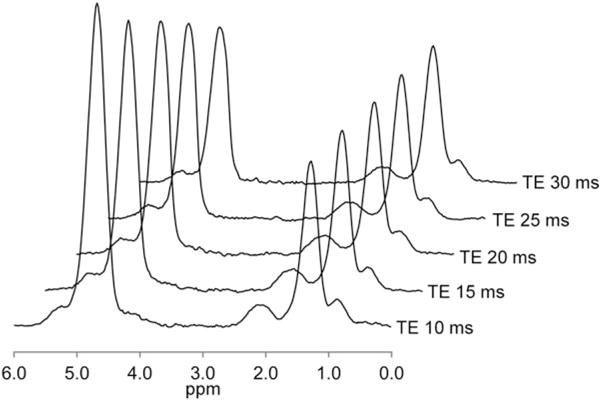
Representative MR spectra for a subject with a hepatic PDFF value of 32.4% showing the water peak at 4.7 ppm and fat peaks at 5.3, 4.2, 2.75, 2.1, 1.3, and 0.9 ppm, for TE values of 10, 15, 20, 25, and 30 msec.
Scatterplots of ROIs placed on six-echo parametric PDFF maps, and on two-, three-, four-, five-, and six-echo MR images showed strong agreement with MRS PDFF (Fig. 3). All regression slopes were near unity, and all intercepts and average biases were near zero (Table 2); nevertheless, all pairwise differences in slope, intercept, and average bias between the various tested methods were significant (see Appendix, Table A1). The three- and four-echo methods had intercept, bias, and Bland–Altman 95% limits of agreement of PDFF difference closest to zero; slope was closest to unity for the five-echo method.
FIGURE 3.
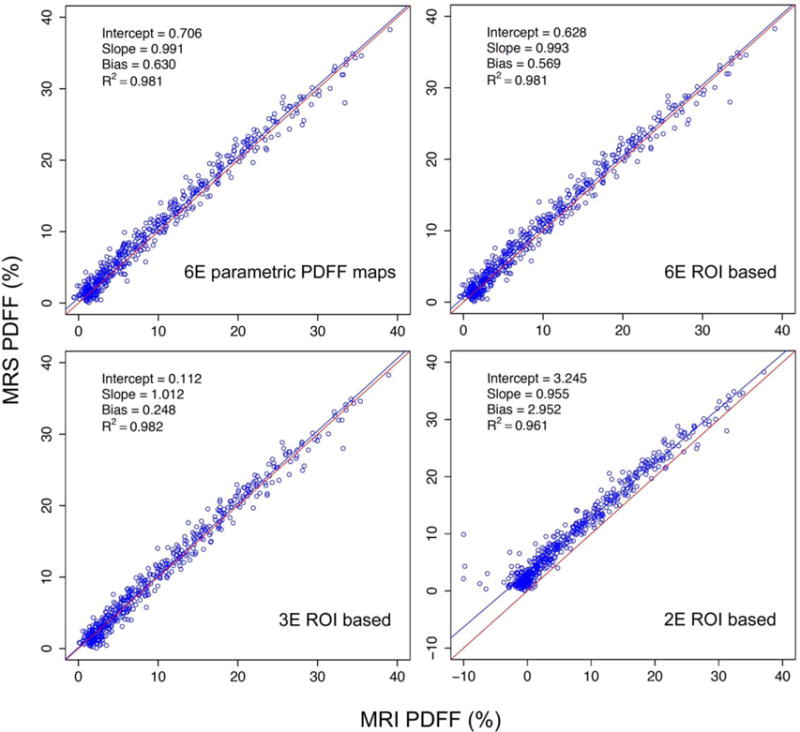
Linear regression plots for MRS as a function of M-MRI PDFF for the six-echo parametric PDFF map, and the six-, three-, and two-echo ROI-based methods.
TABLE 2.
Summary of M-MRI vs. MRS PDFF-Estimation Regression and Bland-Altman Model Parameters for the Parametric PDFF Map-Based Method, and for PDFF Estimated From ROI Signal Intensity Measurements on Original MR Images Using the Two-, Three-, Four-, Five-, and Six-Echo Methods
| 2E ROI-based method vs. MRS | 3E ROI-based method vs. MRS | 4E ROI-based method vs. MRS | 5E ROI-based method vs. MRS | 6E ROI-based method vs. MRS | 6E parametric PDFF map-based method vs. MRS | |
|---|---|---|---|---|---|---|
| Slope | 0.955 | 1.012 | 1.005 | 0.998 | 0.993 | 0.991 |
| 95% CI | 0.927, −0.975 | 0.996, −1.025 | 0.989, −1.018 | 0.984, −1.012 | 0.978, −1.007 | 0.975, −1.004 |
| Intercept (%) | 3.245 | 0.112 | 0.318 | 0.438 | 0.628 | 0.706 |
| 95% CI | 3.011, −3.558 | −0.030, −0.256 | 0.179, −0.479 | 0.279, −0.588 | 0.483, −0.780 | 0.574, −0.879 |
| Average bias (%) | 2.952 | 0.248 | 0.364 | 0.423 | 0.569 | 0.630 |
| 95% CI | 2.801, −3.139 | 0.126, −0.344 | 0.256, −0.466 | 0.311, −0.523 | 0.460, −0.672 | 0.527, −0.724 |
| R2 | 0.961 | 0.982 | 0.982 | 0.981 | 0.981 | 0.981 |
| 95% CI | 0.934, −0.972 | 0.978, −0.985 | 0.978, −0.985 | 0.977, −0.984 | 0.977, −0.984 | 0.977, −0.984 |
| Bland-Altman 95% limits of agreement (%) | ± 3.425 | ± 2.293 | ± 2.287 | ± 2.342 | ± 2.330 | ± 2.344 |
MRS = magnetic resonance spectroscopy; ROI = region of interest; CI = confidence interval; 2E, 3E, 4E, 5E, 6E = two, three, four, five, and six echoes.
The two-echo method (spectrally corrected, but not T2*-corrected) was least accurate and underestimated PDFF by an average of 2.93%, as opposed to the other methods, which underestimated PDFF by an average of 0.23% (three-echo) to 0.63% (six-echo parametric PDFF maps). Using T2* values derived from all six echoes to correct two-echo ROI values resulted in closer agreement between these methods. For example, mean PDFF values for T2*-uncorrected two-echo, T2*-corrected two-echo, and six-echo methods were 7.18%, 10.40%, and 9.56%, respectively.
Estimated T2* values derived from three, four, five, and six echoes are presented in Fig. 4. Those derived from the three-echo method were slightly higher than, and differed most from, those derived from the other methods. All pairwise comparisons were significant (P < 0.0001, paired t-tests).
FIGURE 4.
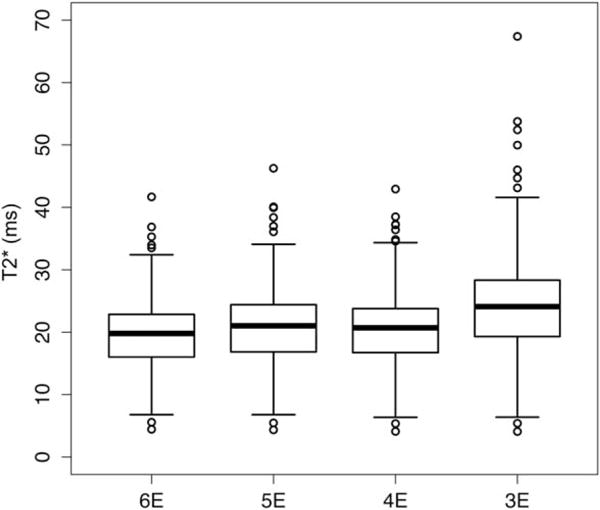
Boxplot showing T2* values for six-, five-, four-, and three-echo ROI-based methods.
Bland–Altman plots for the six-echo parametric PDFF map-based method, and for the two-, three-, and six-echo ROI-based methods are shown in Fig. 5. Bias decreased with the number of echoes used to calculate PDFF from six to three echoes.
FIGURE 5.
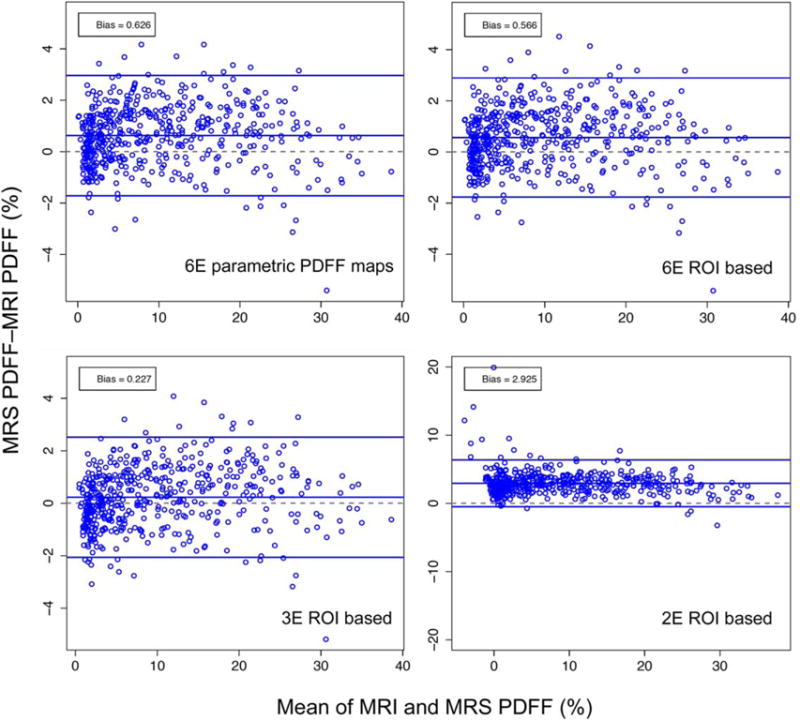
Bland–Altman plots showing the difference between MRS and M-MRI PDFF across the entire range of PDFF for parametric PDFF maps, and for six-, three-, and two-echo ROI-based methods. Note that the scale for lower right plot is different from the other three plots.
Higher BMI was associated with higher absolute error in estimated MRI-PDFF for the three-, four-, five-, and six-echo ROI-based methods, as well as for the parametric PDFF map-based method (P range: 0.0016 to 0.0783); however, the effect was small (absolute error was 0.045 to 0.09% higher for a BMI increase of 5 kg/m2). Male gender was also associated with higher absolute error for three-, four-, five-, and six-echo ROI-based methods, as well as for the parametric PDFF map-based method (P range: 0.015 to 0.037; absolute error 0.15 to 0.16% higher in males than females). Age was not associated with absolute error size for any method (P range: 0.18 to 0.24). Analysis of potential confounders was not performed for the two-echo method due to model instability.
Discussion
In this retrospective, single-center analysis of 506 adults with known or suspected NAFLD we determined the accuracy of, and the effect of common possible subject-based confounders on, magnitude-based MRI for estimating hepatic PDFF for different numbers of echoes, using MRS as reference.
High MRI PDFF estimation accuracy compared to MRS as reference was confirmed for the three-, four-, five-, and six-echo ROI-based methods, and for a six-echo parametric map-based method, with intercept and average bias close to 0, and slope and R2 close to 1. Accuracy indices showed small but statistically significant differences for the tested cross-method comparisons. The three-echo method showed the most narrow Bland–Altman 95% limits of agreement with intercept and average bias closest to 0, and as expected the spectrally corrected two-echo method showed the least agreement with MRS with intercept and average bias farthest from zero, slope and R2 farthest from unity, and the most wide Bland–Altman 95% limits of agreement.
A strength of this analysis is the large number of included subjects that allowed us to determine whether our results were confounded by age, sex, or BMI. We know that pediatric nonalcoholic steatohepatitis (NASH) is different in some ways from adult NASH,25 and so it is possible that there are also differences in NAFLD between young and old adults. We also know that there are differences in NAFLD between males and females.26 It is also possible that BMI could affect PDFF accuracy for large patients with a thick layer of adipose tissue, leading to decreased signal-to-noise. We found that higher BMI and male sex were associated with statistically significant, although small and probably clinically nonmeaningfully, increased MRI PDFF estimation error, and that age did not confound MRI PDFF estimation accuracy. The observation that these potentially confounding factors had negligible impact on hepatic PDFF estimation is an important evidentiary step in the continued qualification and validation of MRI PDFF as a biomarker of hepatic steatosis.
The small observed differences in accuracy indices for the different MRI PDFF estimation methods are likely not clinically meaningful, especially for larger PDFF values. However, reducing the number of echoes may improve scanning flexibility by permitting better liver coverage (ie, more slices) or higher spatial resolution. Using fewer echoes will not reduce total examination time for the (2D) magnitude-based MRI methods tested in this analysis because TR cannot be reduced without introducing T1 weighting; reducing flip angle would compensate for that, but only at the expense of often-necessary signal-to-noise, especially for low PDFF values. However, for 3D methods such as complex-based MRI, using fewer or more closely spaced echoes could reduce examination time, since TR (and flip angle) can be reduced.
Two prior studies tested magnitude-based MRI PDFF estimation accuracy using different numbers of echoes, using MRS PDFF as reference. Yokoo et al7 compared the accuracy of two-, three-, and six-echo MRI PDFF estimation methods in 167 subjects, and reported that the three- and six-echo methods were most accurate. Levin et al14 concluded in their study of 84 subjects that accuracy increases as the number of echoes used for hepatic PDFF decreases from 16 to 3. Our analysis confirms the high PDFF estimation accuracies reported in those studies and, additionally, extends their results in a larger population, providing more detailed investigation of differences in accuracy using different analysis methods, helps establish further the reliability of these methods, and enabled us to demonstrate that possible subject-based confounders (age, sex, BMI) do not meaningfully affect correlation of MRI with MRS.
Using six nominally in- and out-of-phase echoes may result in T2* overestimation for low values of T2*, and hence lead to PDFF overestimation because signal may approach or drop to noise levels for high TE values.13 Hence, sequences intended to estimate T2* clinically, especially in cases of iron overload, typically use shorter echo spacings than were used in this analysis.27 This is unlikely to be an important factor in this analysis because our observed T2* values were not low enough in the majority of subjects to appreciably affect signal-to-noise, for our choice of TE values. Also, as noted by Yokoo et al,7 the high accuracy reported in their and other studies using these techniques suggests that random noise is not clinically important. However, using fewer echoes (but not less than three) or more closely spaced echoes may be preferable to estimate T2* and PDFF most accurately for subjects with low T2*.
We found that slightly higher T2* (and PDFF) estimates were obtained using the three-echo method than from using the other tested methods, and that the slightly higher PDFF estimates from the three-echo method were more accurate than those estimated using the other methods, using MRS as reference. Noting that the observed T2* differences are small, we do not in fact know which analysis method is giving the most accurate T2* values since we did not have a T2* accuracy reference standard available for this analysis. Hence, it is possible that using more echoes than three may be necessary to estimate T2* most accurately.
The lower correlation of the (only spectrally corrected) two-echo method with MRS compared to the other tested methods, and the occasional negative two-echo MRI PDFF values that are calculated for low PDFF values, are probably attributable to the inability of the two-echo method to correct for T2*, which requires at least three echoes. This is supported by our finding that T2* correction of the two-echo data, using values of T2* derived from all six echoes, brings corrected two-echo PDFF values into closer agreement with those estimated for all six echoes.
A limitation of this analysis is that it was performed at a single center and on a single (3.0T GE) scanner by a team experienced in this sort of imaging. However, prior studies have shown the reproducibility of similarly obtained magnitude-based MRI results across scanners from different manufacturers and at different field strengths,28,29 and hence if similar, standardized techniques are used, this is probably not a meaningful limitation.
Another limitation is that we did not analyze possible histologic confounders such as fibrosis, inflammation, or iron. Fibrosis has been reported to confound PDFF in some 20,27 but not other 30,31 studies, and further research is needed to determine the impact of fibrosis on PDFF estimation accuracy. Iron is known to confound T2*-uncorrected PDFF estimation32,33 but in principle should not confound T2*-corrected methods unless iron overload is extreme33; the iron concentration at which MRI PDFF estimation methods fail or become inaccurate is not yet established. Inflammation probably has little or no confounding effect on MRI PDFF estimation.30
A third limitation is that complex-based MRI was not included in this analysis. Strong agreement has been shown between magnitude and complex-based MRI,13 and each method separately has been shown to be similarly accurate compared to MRS as reference11,12. However, complex-based MRI was not obtained for most of the subjects included in this retrospective analysis, and so could not be compared here to magnitude-based MRI. Given that many clinical trials have used or are using magnitude-based MRI alone to estimate PDFF, confirmation of accuracy and investigation of possible confounders for magnitude-based MRI estimated PDFF is needed, especially since hepatic PDFF data from at least some of those trials is being provided to the U.S. Food and Drug Administration (FDA) as a biomarker for hepatic steatosis. As complex-based MRI is adopted and used more in the future, it too will require further validation studies.
Finally, colocalization of manual MRI ROI placement with MRS voxel location was subject to error because the MR images on which ROIs are placed were obtained in a separate, previously obtained breath-hold from the one in which the MRS acquisition was obtained. It would be preferable if MRI colocalization was established on images obtained with MRS acquisition in the same breath-hold, but that capability currently is not available. Nonetheless, the high level of agreement of MRI estimated PDFF with MRS suggests that any colocalization error probably has only minimal impact on the assessment of PDFF estimation accuracy in the liver.
In conclusion, this analysis showed that age, sex, and BMI are not clinically meaningful confounders of PDFF estimation by magnitude-based MRI relative to MRS, and that with small but statistically significant differences, MRI analysis methods using three to six echoes spaced at nominally alternating in- and out-of-phase TEs accurately estimate hepatic PDFF. Additionally, of these methods the three-echo method shows better indices of accuracy compared to MRS than methods with greater numbers of echoes. More widespread implementation in multicenter studies and use in a wider range of clinical settings would help to further validate the technical performance and clinical utility of this type of imaging.
Supplementary Material
Acknowledgments
Contract grant sponsor: NIH; Contract grant numbers: R01 DK075128, R01 DK088925, K23 DK090303, U01 DK061730; Contract grant sponsor: BERLEX; Contract grant number: 20070598; Contract grant sponsor: Wyeth; Contract grant number: 79600A.
Footnotes
Additional Supporting Information may be found in the online version of this article.
References
- 1.Bravo AA, Sheth SG, Chopra S. Liver biopsy. N Engl J Med. 2001;344:495–500. doi: 10.1056/NEJM200102153440706. [DOI] [PubMed] [Google Scholar]
- 2.Lewis JR, Mohanty SR. Nonalcoholic fatty liver disease: a review and update. Dig Dis Sci. 2010;55:560–578. doi: 10.1007/s10620-009-1081-0. [DOI] [PubMed] [Google Scholar]
- 3.Pais R, Pascale A, Fedchuck L, Charlotte F, Poynard T, Ratziu V. Progression from isolated steatosis to steatohepatitis and fibrosis in nonalcoholic fatty liver disease. Clin Res Hepatol Gastroenterol. 2011;35:23–28. doi: 10.1016/j.gcb.2010.06.004. [DOI] [PubMed] [Google Scholar]
- 4.Reeder SB, Hu HH, Sirlin CB. Proton density fat-fraction: a standardized MR-based biomarker of tissue fat concentration. J Magn Reson Imaging. 2012;36:1011–1014. doi: 10.1002/jmri.23741. [DOI] [PMC free article] [PubMed] [Google Scholar]
- 5.Reeder SB, Cruite I, Hamilton G, Sirlin CB. Quantitative assessment of liver fat with magnetic resonance imaging and spectroscopy. J Magn Reson Imaging. 2011;34:729–749. doi: 10.1002/jmri.22580. [DOI] [PMC free article] [PubMed] [Google Scholar]
- 6.Yokoo T, Bydder M, Hamilton G, et al. Nonalcoholic fatty liver disease: diagnostic and fat-grading accuracy of low-flip-angle multiecho gradient-recalled-echo MR imaging at 1.5 T. Radiology. 2009;251:67–76. doi: 10.1148/radiol.2511080666. [DOI] [PMC free article] [PubMed] [Google Scholar]
- 7.Yokoo T, Shiehmorteza M, Hamilton G, et al. Estimation of hepatic proton-density fat fraction by using MR imaging at 3.0 T. Radiology. 2011;258:749–759. doi: 10.1148/radiol.10100659. [DOI] [PMC free article] [PubMed] [Google Scholar]
- 8.Bugianesi E, Gentilcore E, Manini R, et al. A randomized controlled trial of metformin versus vitamin E or prescriptive diet in nonalcoholic fatty liver disease. Am J Gastroenterol. 2005;100:1082–1090. doi: 10.1111/j.1572-0241.2005.41583.x. [DOI] [PubMed] [Google Scholar]
- 9.Lin HZ, Yang SQ, Chuckaree C, Kuhajda F, Ronnet G, Diehl AM. Metformin reverses fatty liver disease in obese, leptin-deficient mice. Nat Med. 2000;6:998–1003. doi: 10.1038/79697. [DOI] [PubMed] [Google Scholar]
- 10.Idilman IS, Keskin O, Elhan AH, Idilman R, Karcaaltincaba M. Impact of sequential proton density fat fraction for quantification of hepatic steatosis in nonalcoholic fatty liver disease. Scand J Gastroenterol. 2014;49:617–624. doi: 10.3109/00365521.2014.894118. [DOI] [PubMed] [Google Scholar]
- 11.Liu CY, McKenzie CA, Yu H, Brittain JH, Reeder SB. Fat quantification with IDEAL gradient echo imaging: correction of bias from T(1) and noise. Magn Reson Med. 2007;58:354–364. doi: 10.1002/mrm.21301. [DOI] [PubMed] [Google Scholar]
- 12.Yu H, Shimakawa A, McKenzie CA, Brodsky E, Brittain JH, Reeder SB. Multiecho water-fat separation and simultaneous R2* estimation with multifrequency fat spectrum modeling. Magn Reson Med. 2008;60:1122–1134. doi: 10.1002/mrm.21737. [DOI] [PMC free article] [PubMed] [Google Scholar]
- 13.Kuhn JP, Hernando D, Mensel B, et al. Quantitative chemical shift-encoded MRI is an accurate method to quantify hepatic steatosis. J Magn Reson Imaging. 2014;39:1494–1501. doi: 10.1002/jmri.24289. [DOI] [PMC free article] [PubMed] [Google Scholar]
- 14.Levin YS, Yokoo T, Wolfson T, et al. Effect of echo-sampling strategy on the accuracy of out-of-phase and in-phase multiecho gradient-echo MRI hepatic fat fraction estimation. J Magn Reson Imaging. 2014;39:567–575. doi: 10.1002/jmri.24193. [DOI] [PMC free article] [PubMed] [Google Scholar]
- 15.Bydder M, Yokoo T, Hamilton G, et al. Relaxation effects in the quantification of fat using gradient echo imaging. Magn Reson Imaging. 2008;26:347–359. doi: 10.1016/j.mri.2007.08.012. [DOI] [PMC free article] [PubMed] [Google Scholar]
- 16.Hussain HK, Chenevert TL, Londy FJ, et al. Hepatic fat fraction: MR imaging for quantitative measurement and display — early experience. Radiology. 2005;237:1048–1055. doi: 10.1148/radiol.2373041639. [DOI] [PubMed] [Google Scholar]
- 17.Yu H, McKenzie CA, Shimakawa A, et al. Multiecho reconstruction for simultaneous water-fat decomposition and T2* estimation. J Magn Reson Imaging. 2007;26:1153–1161. doi: 10.1002/jmri.21090. [DOI] [PubMed] [Google Scholar]
- 18.Hamilton G, Middleton MS, Bydder M, et al. Effect of PRESS and STEAM sequences on magnetic resonance spectroscopic liver fat quantification. J Magn Reson Imaging. 2009;30:145–152. doi: 10.1002/jmri.21809. [DOI] [PMC free article] [PubMed] [Google Scholar]
- 19.Hamilton G, Yokoo T, Bydder M, et al. In vivo characterization of the liver fat (1)H MR spectrum. NMR Biomed. 2011;24:784–790. doi: 10.1002/nbm.1622. [DOI] [PMC free article] [PubMed] [Google Scholar]
- 20.Schwimmer JB, Middleton MS, Behling C, et al. Magnetic resonance imaging and liver histology as biomarkers of hepatic steatosis in children with nonalcoholic fatty liver disease. Hepatology. 2015;61:1887–1895. doi: 10.1002/hep.27666. [DOI] [PMC free article] [PubMed] [Google Scholar]
- 21.Rosset A, Spadola L, Ratib O. OsiriX: an open-source software for navigating in multidimensional DICOM images. J Digit Imaging. 2004;17:205–216. doi: 10.1007/s10278-004-1014-6. [DOI] [PMC free article] [PubMed] [Google Scholar]
- 22.Bydder M, Hamilton G, Yokoo T, Sirlin CB. Optimal phased-array combination for spectroscopy. Magn Reson Imaging. 2008;26:847–850. doi: 10.1016/j.mri.2008.01.050. [DOI] [PMC free article] [PubMed] [Google Scholar]
- 23.Naressi A, Couturier C, Castang I, de Beer R, Graveron-Demilly D. Java-based graphical user interface for MRUI, a software package for quantitation of in vivo/medical magnetic resonance spectroscopy signals. Comput Biol Med. 2001;31:269–286. doi: 10.1016/s0010-4825(01)00006-3. [DOI] [PubMed] [Google Scholar]
- 24.Vanhamme L, van den Boogaart A, Van Huffel S. Improved method for accurate and efficient quantification of MRS data with use of prior knowledge. J Magn Reson Imaging. 1997;129:35–43. doi: 10.1006/jmre.1997.1244. [DOI] [PubMed] [Google Scholar]
- 25.Schwimmer JB, Behling C, Newbury R, et al. Histopathology of pediatric nonalcoholic fatty liver disease. Hepatology. 2005;42:641–649. doi: 10.1002/hep.20842. [DOI] [PubMed] [Google Scholar]
- 26.Pan JJ, Fallon MB. Gender and racial differences in nonalcoholic fatty liver disease. World J Hepatol. 2014;6:274–283. doi: 10.4254/wjh.v6.i5.274. [DOI] [PMC free article] [PubMed] [Google Scholar]
- 27.Idilman IS, Aniktar H, Idilman R, et al. Hepatic steatosis: quantification by proton density fat fraction with MR imaging versus liver biopsy. Radiology. 2013;267:767–775. doi: 10.1148/radiol.13121360. [DOI] [PubMed] [Google Scholar]
- 28.Kang GH, Cruite I, Shiehmorteza M, et al. Reproducibility of MRI-determined proton density fat fraction across two different MR scanner platforms. J Magn Reson Imaging. 2011;34:928–934. doi: 10.1002/jmri.22701. [DOI] [PMC free article] [PubMed] [Google Scholar]
- 29.Mashhood A, Railkar R, Yokoo T, et al. Reproducibility of hepatic fat fraction measurement by magnetic resonance imaging. J Magn Reson Imaging. 2013;37:1359–1370. doi: 10.1002/jmri.23928. [DOI] [PubMed] [Google Scholar]
- 30.Tang A, Desai A, Hamilton G, et al. Accuracy of MR-imaging-estimated proton density fat fraction for classification of dichotomized histologic steatosis grades in nonalcoholic fatty liver disease. Radiology. 2015;274:416–425. doi: 10.1148/radiol.14140754. [DOI] [PMC free article] [PubMed] [Google Scholar]
- 31.Tang A, Tan J, Sun M, et al. Nonalcoholic fatty liver disease: MR imaging of liver proton density fat fraction to assess hepatic steatosis. Radiology. 2013;267:422–431. doi: 10.1148/radiol.12120896. [DOI] [PMC free article] [PubMed] [Google Scholar]
- 32.Bydder M, Shiehmorteza M, Yokoo T, et al. Assessment of liver fat quantification in the presence of iron. Magn Reson Imaging. 2010;28:767–776. doi: 10.1016/j.mri.2010.03.017. [DOI] [PMC free article] [PubMed] [Google Scholar]
- 33.Kühn JP, Evert M, Friedrich N, et al. Noninvasive quantification of hepatic fat content using three-echo Dixon magnetic resonance imaging with correction for T2* relaxation effects. Invest Radiol. 2011;46:783–789. doi: 10.1097/RLI.0b013e31822b124c. [DOI] [PubMed] [Google Scholar]
Associated Data
This section collects any data citations, data availability statements, or supplementary materials included in this article.