

Abstract
BACKGROUND
Although recent reports suggest the incidence of parapneumonic empyema increased in several regions of the United States, national trends in disease burden are unknown. We examined national trends in the incidence of parapneumonic empyema hospitalizations and changes in empyema by associated pathogens.
METHODS
National hospitalization data(1996–2008) were analyzed and rates estimated using Census estimates as denominators. Incidence rate ratios (IRR) compared 2008 with 1996 rates. Discharge diagnosis codes were used to characterize pathogens associated with empyema hospitalizations.
RESULTS
Overall, national parapneumonic empyema-related hospitalization rates increased from 3.04 per 100,000 in 1996 to 5.98 per 100,000 in 2008, a 2.0-fold increase (95% CI: 1.8–2.1). The increases were observed among children (IRR: 1.9 [95% CI: 1.4–2.7]) and adults aged 18–39, 40–64 and ≥65 years (IRRs: 1.8 [95% CI: 1.5–2.1], 2.0 [95% CI: 1.6–3.1] and 1.7 [95% CI: 1.5–2.0], respectively). Overall pneumococcal empyema rates remained relatively stable in all age groups, whereas streptococcal (non-pneumococcal) and staphylococcal-related empyema rates increased 1.9 and 3.3-fold, respectively, with consistent increases across age groups. The overall in-hospital case fatality ratio for parapneumonic empyema-related hospitalizations was 8.0% (95% CI: 6.4–9.5) in 1996 and 7.2% (95% CI: 6.3–8.1) in 2008 (p=0.395). Of the empyemas where study pathogens were listed (37.6%), Staphylococcal-related empyema had the largest absolute increases across age groups and was associated with longer hospital stay and higher in-hospital mortality than other empyemas.
CONCLUSIONS
Although parapneumonic empyema-related hospitalizations remained relatively rare, they increased substantially during the study period. A number of pathogens, especially staphylococcus, contributed to this increase.
INTRODUCTION
Empyema is a relatively rare but serious infection of the pleural space. Despite the wide availability of novel antibiotics and improved diagnostic tools, empyema remains an important cause of morbidity and mortality.1 Delays in diagnosis, failure to institute appropriate antimicrobial therapy, and inadequate drainage contribute to increased morbidity and mortality.1–4 In addition, the in-hospital management of empyema patients is associated with substantial costs.5
The pathogens traditionally associated with empyema are Streptococcus pneumoniae, Streptococcus pyogenes and Staphylococcus aureus.1 However, anaerobes have also been identified in 25–76% of cases, as sole organisms or mixed with other bacteria.1, 6 Recently, the Streptococcus anginosus (formerly termed Streptococcus milleri)7 group, has been reported as a leading bacterial cause of empyema.1, 3, 8 Approximately 40–60% of empyemas are considered to be pneumonia-related (i.e. parapneumonic), whereas thoracic procedures and trauma account for most of the remainder.1 Most published descriptions of empyema come from reports from large healthcare referral centers.
Previous reports suggested that the incidence of parapneumonic empyema was increasing in several regions of the United States (US)6, 9–11 and in other countries.4, 12, 13 More recently, studies demonstrated national increases in childhood empyema and parapneumonic empyema in young children, with various pathogens contributing to these increases.14, 15,16 However, there have been no comprehensive studies of US trends in parapneumonic empyemas including both children and adults. We used national hospitalization data to examine the patient characteristics and trends of parapneumonic empyema-related hospitalizations in the US.
METHODS
Source of data
National hospitalization data were obtained from the Nationwide Inpatient Sample (NIS), which is the largest source of inpatient data publicly available in the US. These databases contain information on inpatient stays from States that participate in the Healthcare Cost and Utilization Project (HCUP), sponsored by the Agency for Healthcare Research and Quality. Information recorded includes clinical and resource-utilization data for 5–8 million hospitalizations per year from a sample of approximately 1000 hospitals. These hospitals constitute an estimated 20% sample of community hospitals, including nonfederal short-term, general, and specialty hospitals. Participating hospitals are sampled by stratified probability sampling in five strata (ownership/control, bed size, teaching status, urban/rural, and region), with sampling probabilities proportional to the number of community hospitals in each stratum.17
NIS collects data on all hospitalizations regardless of payment source, and weighting and sampling variables are provided to calculate national estimates. Up to 15 discharge diagnoses and procedures are recorded using ICD9-CM codes with first-listed diagnoses (principal) regarded as the primary reason for hospitalization.18 NIS data are publicly available and have no personal identifiers. This study was considered exempt from review by the Institutional Review Boards of Vanderbilt University and the CDC.
Empyema identification
We identified parapneumonic empyema hospitalizations using ICD9-CM coded discharge diagnoses.15 We first identified all-cause pneumonia hospitalizations by a principal diagnosis of pneumonia, or a principal diagnosis of septicemia, meningitis or empyema and a pneumonia code in another diagnosis field.15, 19 Discharge diagnosis and procedure codes, including thoracentesis and related procedures (including video-assisted thoracoscopic surgery, VATS)5, were then used to characterize parapneumonic empyema hospitalizations. About 9% of parapneumonic empyema hospitalizations had a primary diagnosis of sepsis/septicemia or meningitis.
Statistical analyses
Annual incidence rates of parapneumonic empyema hospitalizations were calculated by dividing the weighted number of empyemas by annual US Census population estimates. Diagnosis codes indicating specific etiologies for empyema-related pathogens (i.e. specified pneumonia, septicemia/bacteremia or specific infections) were used to classify empyemas into mutually exclusive groups based on the following hierarchy: 1) pneumococcal, 2) streptococcal (non-pneumococcal), 3) staphylococcal, and 4) other/unknown pathogens.
Poisson regression models with terms for age group, year and one age-time term interaction were fit for each empyema group to obtain annual incidence rates, incidence rate ratios (IRRs) and variance estimates while accounting for the NIS sampling design. The unit of analysis was the empyema hospitalization and the offset term for these count-events models were the census population estimates for specific years and age groups. Thus, for the calculation of incidence rates, the aggregated NIS weighted estimates were divided by their respective population estimates. All analyses accounted for the NIS weight (DISCWT), stratum (NIS_STRATUM and STRATUM) and cluster (HOSPID) design variables. Changes in annual empyema rates were examined and summarized by estimating the IRR of the last (2008) to the first (1996) annual rates available. Rates, IRRs and their respective 95% confidence intervals were calculated using linear combination of coefficients from the fitted Poisson models. In addition, rate differences were calculated and tests for linear trends were performed evaluating the effect of calendar year on the estimated rates. Mean length of stay, number of discharge diagnoses and number of procedures were compared using T tests that accounted for the NIS sampling design. In-hospital case fatality ratios were estimated dividing the number of in-hospital deaths by the number of empyema-related hospitalizations. Since previous empyema studies have focused on young children aged <5 years,14, 15 the analyses for the present study were age-stratified as 0–17, 18–39, 40–64 and ≥65 years old.
To assess the potential effect of changing coding practices on the observed trends, we assessed changes in the mean number of discharge diagnosis, procedures and length of stay (in days) for all-cause hospitalizations and for parapneumonic empyema-related hospitalizations.
Secondary analyses aimed to exclude hospital-acquired empyema and were restricted to those patients with a primary discharge diagnosis of empyema. Statistical analyses used the survey packages of SAS 9.2 and Stata 11.0.
RESULTS
Characteristics of parapneumonic empyema-related hospitalizations
From 1996 through 2008, we estimated 157094 parapneumonic empyema-related hospitalizations in the US (18200 in 2008). The mean patient age was 48.4 years (95% CI: 47.4–49.4) and 35.8% were female. Race/ethnicity was not reported in 23.7%, and was reported as White, African American, Hispanic and other in 56.1%, 8.8%, 6.9%, and 4.7%, respectively (Table 1).
Table 1.
Characteristics of parapneumonic empyema-related hospitalizations, United States 1996–2008*
| < 18 years (n=26125) | 18–39 years (n=22185) | 40–64 years (n=62358) | ≥ 65 years (n=46375) | All (n=157094) | |
|---|---|---|---|---|---|
| Age, mean | 5.1 (5–5.3) | 30.7 (30.6–30.9) | 51.9 (51.8–52) | 76.7 (76.5–76.8) | 48.4 (47.5–49.4) |
| Female, % | 44.7 (43.4–46) | 30.2 (28.8–31.6) | 30.8 (30–31.7) | 40.1 (39.1–41.2) | 35.8 (35.2–36.4) |
| Race, % | |||||
| White | 42 (38.7–45.3) | 52 (49.8–54.3) | 56.7 (54.8–58.6) | 65.3 (63.3–67.2) | 56.1 (54.4–57.8) |
| African Americans | 11.4 (9.3–13.4) | 10.9 (9.7–12.1) | 9.7 (8.8–10.6) | 5.1 (4.5–5.7) | 8.8 (8.0–9.5) |
| Hispanic | 13.1 (10.8–15.4) | 9.2 (8–10.4) | 5.9 (5.2–6.5) | 3.6 (3.1–4.1) | 6.9 (6.2–7.6) |
| Asian or Pacific Islander | 3.7 (2.8–4.5) | 1.6 (1.2–2) | 1.4 (1.1–1.7) | 1.8 (1.4–2.2) | 1.9 (1.7–2.2) |
| Native American | 0.8 (0.4–1.2) | 0.7 (0.3–1) | 0.4 (0.3–0.6) | 0.3 (0.1–0.4) | 0.5 (0.3–0.6) |
| Other | 4.5 (3.6–5.4) | 2 (1.6–2.5) | 1.8 (1.5–2.1) | 1.5 (1.2–1.8) | 2.2 (1.9–2.5) |
| Missing | 23.6 (18.5–28.6) | 24.1 (21.3–27.0) | 24.5 (22.2–26.9) | 23.0 (20.7–25.3) | 23.7 (21.7–25.7) |
| Length of stay, mean (days) | 11.8 (11.4–12.2) | 14.4 (14–14.8) | 15.6 (15.4–15.9) | 16.8 (16.4–17.1) | 15.2 (15.0–15.4) |
| Thoracentesis**, % | 84.6 (82.7–86.5) | 91.3 (90.4–92.2) | 88.4 (87.7–89) | 81.6 (80.8–82.5) | 86.2 (85.6–86.7) |
| In-hospital case fatality, % | 0.4 (0.3–0.6) | 2.2 (1.8–2.7) | 5.2 (4.8–5.6) | 16.1 (15.3–16.9) | 7.2 (6.8–7.5) |
Numbers indicate percentages and 95% confidence intervals, unless otherwise specified. Numbers may not add to totals or 100% due to rounding/missing values.
Includes thoracentesis-related procedures (ICD9-CM: 34.04, 34.06, 34.09, 34.21, 34.51, 34.52, 34.91)
Thoracentesis and related procedures were recorded in 86.2% of all parapneumonic empyema hospitalizations, and the proportion with any of these procedures was higher among children (84.6%) than among adults aged ≥65 years (81.6%). The mean length of stay was 15.2 days and was shorter among children than among adults. The overall in-hospital case-fatality ratio was 7.2% ranging from 0.4% among children to 16.1% among adults aged ≥65 years (Table 1).
Assessment of coding practices
During the study years, the mean length of all-cause hospital stay decreased from 5.0 days in 1996 to 4.6 days in 2008 (p<0.001). Similarly, the mean length of hospital stay for parapneumonic empyema-related hospitalizations declined from 16.5 (95% CI: 15.7–17.2) in 1996 to 14.9 (95% CI: 14.4–15.4) in 2008 (p<0.001).
For all-cause hospitalizations, there was an increase in the overall mean number of discharge diagnoses recorded from 4.5 in 1996 to 7.3 in 2008 (p<0.001). The mean number of discharge diagnoses recorded during parapneumonic empyema-related hospitalizations also increased from 7.2 (95% CI: 7.0–7.4) in 1996 to 11.8 (95% CI: 11.4–12.2) in 2008 (p<0.001).
The mean number of procedures recorded during all-cause hospitalizations increased from 1.4 to 1.6 (p<0.001) during the study years. Similarly, the mean number of procedures performed during parapneumonic empyema hospitalizations increased from 4.0 (95% CI: 3.8–4.3) in 1996 to 4.5 (95% CI: 4.3–4.7) in 2008 (p=0.002). The five most frequent procedures listed as first procedures among parapneumonic empyema hospitalizations during 2008 included: insertion of intercostal cathether, decortication of the lung, thoracoscopic decortication of the lung, thoracentesis and mechanical ventilation.
Trends in the incidence of parapneumonic empyema hospitalizations
The mean annual rate of parapneumonic empyema hospitalizations varied with age, with the largest burden concentrated in the elderly. Mean rates for children were 2.76 per 100,000 (95% CI: 2.49–3.07), whereas mean annual rates for adults aged 18–39, 40–64 and ≥65 years were 1.89 (95% CI: 1.82–1.97), 5.41 (95% CI: 5.28–5.56) and 9.94 (95% CI: 9.68–10.21), respectively. Overall, national rates of parapneumonic empyema hospitalizations increased from 3.04 per 100,000 in 1996 to 5.98 per 100,000 in 2008, a 2.0–fold increase (95% CI: 1.8–2.1, test for trend p<0.001). In the age-stratified analysis, the largest relative increase was observed among adults aged 40–64 years, with rates increasing from 3.96 per 100,000 in 1996 to 8.10 per 100,000 in 2008, representing a 2.0-fold increase (95% CI: 1.6–3.1, test for trend p<0.001) (Figure 1).
Figure 1. Trends in parapneumonic empyema-related hospitalizations, United States 1996–2008.
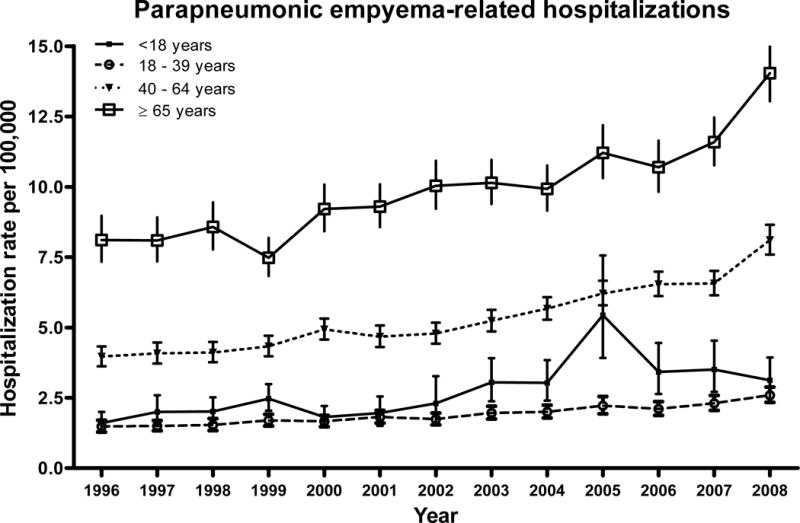
Date are from the Nationwide Inpatient Sample.
Parapneumonic empyema hospitalizations also increased among other age groups. Among children, rates increased 1.9-fold (95% CI: 1.4–2.7, test for trend p<0.001). Similarly, rates increased 1.8-fold (95% CI: 1.5–2.1, test for trend p<0.001) and 1.7-fold (95% CI: 1.5–2.0, test for trend p<0.001) among adults aged 18–39 years and ≥65 years, respectively (Figure 1).
The overall in-hospital case fatality ratio for parapneumonic empyema hospitalizations was 8.0% (95% CI: 6.4–9.5) in 1996 and 7.2% (95% CI: 6.3–8.1) in 2008 (p=0.395). The rate of fatal parapneumonic empyema hospitalizations increased from 0.24 (95% CI: 0.20–0.30) per 100,000 in 1996 to 0.43 (95% CI: 0.38–0.49) per 100,000 in 2008, a 1.8-fold increase (95% CI: 1.4–2.3, test for trend p<0.001).
Empyema related to specific pathogens
Overall, rates of pneumococcal empyema related hospitalizations were 0.68 and 0.74 per 100,000 in 1996 and 2008, respectively (rate ratio 1.1 (95% CI: 0.9–1.3, test for trend p=0.433). Pneumococcal empyema rates remained stable among children (rate ratio 1.1, 95% 0.7–1.7, p value for test for trend p=0.093) and adults (rate ratios 1.3, 1.2 and 0.8 for adults aged 18–39, 40–64 and ≥65 years, respectively).
Rates of streptococcal (non-pneumococcal) empyema increased by 1.9-fold (95% CI: 1.6–2.4, test for trend p<0.001) during the study period, whereas rates of staphylococcal empyema increased by 3.3-fold (95% CI: 2.7–4.0, test for trend p<0.001) (Figure 2). The mean length of hospitalizations was also consistently longer for staphylococcal empyema than for empyema associated with other pathogens and across age groups. Although the frequency of thoracentesis and related procedures was similar among all etiologic groups of empyema, the overall in-hospital case fatality ratio was higher among those with staphylococcal empyema compared with other groups (Table 2).
Figure 2. Trends in parapneumonic empyema-related hospitalizations by different pathogens, United States 1996–2008.
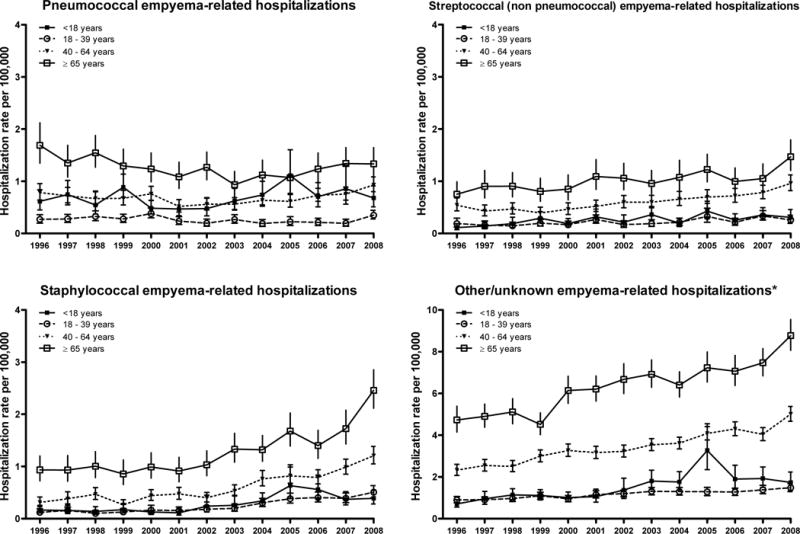
Date are from the Nationwide Inpatient Sample. *Note the scale change for other/unknown empyema estimates.
Table 2.
Selected characteristics of parapneumonic empyema-related hospitalizations by associated pathogens, United States 1996–2008
| Age and empyema group | Age, mean (95% CI) | Thoracentesis*, % | Length of stay, mean (days) | In-hospital case-fatality, % |
|---|---|---|---|---|
| Less than 18 years old | ||||
|
| ||||
| Pneumococcal | 4.6 (4.4–4.9) | 89.1 (86.6–91.6) | 13.2 (12.6–13.9) | 0.6 (0.2–1) |
| Streptococcal (non-pneumococcal) | 5.3 (4.9–5.7) | 90.1 (87.4–92.9) | 12.8 (11.9–13.6) | 0.8 (0–1.5) |
| Staphylococcal | 4.2 (3.7–4.7) | 86.6 (83.6–89.6) | 16.3 (15.1–17.6) | 0.7 (0–1.4) |
| Other/Unknown | 5.5 (5.3–5.7) | 81.3 (78.9–83.7) | 10.2 (9.8–10.6) | 0.2 (0.1–0.4) |
| 18–39 years | ||||
|
| ||||
| Pneumococcal | 31.1 (30.6–31.6) | 92.2 (90.1–94.4) | 16.8 (15.5–18) | 2.5 (1.3–3.8) |
| Streptococcal (non-pneumococcal) | 30.3 (29.7–31) | 95.5 (93.7–97.3) | 15.3 (14.2–16.4) | 2.3 (1–3.5) |
| Staphylococcal | 30.6 (30.1–31.2) | 90.3 (87.9–92.6) | 18 (16.9–19.2) | 2.8 (1.4–4.1) |
| Other/Unknown | 30.8 (30.5–31) | 90.5 (89.4–91.7) | 13 (12.5–13.4) | 2.1 (1.5–2.6) |
| 40–64 years | ||||
|
| ||||
| Pneumococcal | 52 (51.7–52.4) | 93.3 (92.1–94.6) | 17.8 (17.1–18.5) | 6.1 (4.9–7.3) |
| Streptococcal (non-pneumococcal) | 52.3 (51.9–52.7) | 92.9 (91.5–94.2) | 16.6 (15.8–17.3) | 4.4 (3.4–5.5) |
| Staphylococcal | 52 (51.7–52.4) | 84.6 (82.8–86.5) | 21.7 (20.7–22.6) | 8.9 (7.4–10.4) |
| Other/Unknown | 51.8 (51.6–51.9) | 87.3 (86.5–88.1) | 14 (13.7–14.2) | 4.4 (4–4.9) |
| 65 or more years | ||||
|
| ||||
| Pneumococcal | 76.8 (76.3–77.2) | 88.6 (86.6–90.6) | 17.4 (16.7–18.1) | 15.3 (13.2–17.4) |
| Streptococcal (non-pneumococcal) | 76.5 (76–77) | 89.9 (88–91.7) | 16.9 (16–17.7) | 12.1 (10–14.2) |
| Staphylococcal | 76.3 (75.9–76.7) | 79.4 (77–81.7) | 21.4 (20.3–22.5) | 21.8 (19.4–24.1) |
| Other/Unknown | 76.8 (76.6–77) | 79.4 (78.3–80.5) | 15.7 (15.3–16.1) | 15.7 (14.7–16.6) |
Includes thoracentesis-related procedures (ICD9-CM: 34.04, 34.06, 34.09, 34.21, 34.51, 34.52, 34.91)
There were 62.4% of parapneumonic empyema hospitalizations listed as having other/unknown etiology. The proportion of other/unknown etiology empyema increased with age and rates of these empyemas increased 2.1-fold (95% CI: 1.9–2.3, test for trend p<0.001) (Figure 2).
In the secondary analysis restricted to patients with empyema listed as the primary discharge diagnosis (45% of all parapneumonic empyema), the mean length of stay was 14.0 days (95% CI: 13.7–14.2) and the case fatality ratio was 5.8% (95% CI: 5.4–6.2), both lower than those observed for all parapneumonic empyemas. In this subgroup, the overall rates of empyema hospitalizations increased 1.9-fold (95% CI: 1.6–2.1). The increase in children was 1.9-fold, and 1.7, 2.0 and 1.5 among adults aged 18–39, 40–64 and ≥65 years, respectively. Consistent with the results from the main analyses, overall rates of pneumococcal empyema remained stable (IRR: 0.9 (95% CI: 0.6–1.2)), whereas rates of streptococcal (non-pneumococcal), staphylococcal and other empyema increased 1.7, 2.9 and 2.0-fold, respectively.
COMMENT
We used national hospitalization data collected from a period of thirteen years to assess changes in the epidemiology of parapneumonic empyema. Our study revealed a substantial increase in the incidence of parapneumonic empyema hospitalizations in the US. Parapneumonic empyema hospitalizations were commonly associated with in-hospital mortality and required long hospital stays. The largest relative increases were observed among young adults; however, the largest absolute increases occurred in older populations. Our data suggest that the most serious diseases were related to staphylococcal infections. Although parapneumonic empyema remains a relatively rare occurrence among children and young adults, empyema was more common and associated with a high in-hospital case fatality among the elderly. The observed increasing trend is worrisome and consistent with previous reports from large healthcare centers or regions within the US and abroad.4, 6, 9–13
Although most empyemas had other/unknown etiology, many pathogens appear to contribute to this increase. Among cases classified in our study pathogen-specific groups, staphylococcal related-empyema accounted for most of the increase observed during the study years and these patients had the longest lengths of stay and the highest in-hospital case fatality, suggesting more severe disease than other empyemas. The observed national increases in empyema associated with staphylococcal infections are also consistent with previous studies performed in large referral healthcare centers.6, 20
In contrast with the increases observed in other empyema groups, the incidence of pneumococcal empyema remained stable during the study period in both children and adults. It is possible that stable rates of pneumococcal empyema hospitalizations were related to direct and indirect protection derived from infant vaccination with a seven-valent pneumococcal conjugate vaccine (PCV7) that started in 2000.21–24 Previous studies have documented significant reductions in the incidence of pneumonia hospitalizations after PCV7 introduction.15, 19 Some studies reported local and regional increases in the frequency of pneumococcal empyemas in children. Those increases started in the 1990s9, 25 and continued after 2000.10, 11 Most of those increases were related to serotypes not covered in the PCV7 formulation, most notably serotype 1.9, 25 A recent study assessed national rates of pneumonia related empyema in children younger than 5 years and observed a significant increase among children aged 2–4 years but not among younger children.15 Another study that explored national changes in childhood pneumococcal empyema reported stable rates from 1997 through 2006.14 The present study, which was not restricted to young children, indicates that overall national rates of childhood pneumococcal empyema remained relatively stable during the study period. The recent introduction of a 13-valent pneumococcal conjugate vaccine in 2010 in the US could provide protection against pneumococcal serotypes 1, 3, 7F and 19A, commonly associated with empyema,26, 27 but the assessment of those vaccination effects will require additional studies.
A large number of parapneumonic empyemas were classified as due to other or unknown pathogens and large increases were observed in this group. Defining the etiology of empyema is difficult and whether these increases in empyema due to other or unknown pathogens also indicates true emerging trends, reduced or delayed laboratory testing or increased use of antibiotics prior to hospitalization or samples collection, is unclear. Furthermore, mixed bacterial infections are found in some parapneumonic empyemas28 but detailed microbiological information was not available for the present study.
The actual cause of the observed increase in empyema is unclear. The spread of antibiotic-resistant bacteria, some of which are major empyema pathogens may be a driver of the observed increases. It was previously suggested that the failure to initiate appropriate antibiotic treatment could result in an increased incidence of this condition. In particular, we observed increases in empyema related to staphylococcal infections, which have shown an increasing prevalence of antibiotic resistance during the last years.4 The increasing incidence of infections due to antibiotic-resistant pathogens in the US is well documented,29 with S. pneumoniae being the major exception as the incidence of invasive pneumococcal disease caused by resistant strains has decreased markedly following PCV7 introduction.30
It is also possible that the increasing wide availability of new diagnostic techniques, such as CT scans, could have contributed to an increased recognition of empyemas and to the observed increases.31 Moreover, other changes in the detection and management of empyema developed during this period. For instance, VATS became a common procedure and studies suggest that it can reduce the hospital length of stay and improve clinical outcomes.5, 32 The precise contribution of these changes in early detection and treatment of empyemas to the observed trends is unclear. In our study, the mean number of thoracentesis-related procedures performed during empyema hospitalizations increased throughout the study years. Notably, in spite of the increasing incidence of empyema observed, the mean length of hospital stay declined and the case fatality ratio associated with this condition remained stable. These findings could also be related to increased detection of less severe episodes of empyema or more complete coding of these episodes. It is also possible that there were more re-admissions for empyema in recent years. Since NIS data lack personal identifiers, we did not assess the contribution of multiple admissions for the same person to the incidence rates.
Our result must be interpreted in light of several limitations. First, we used coded discharge diagnoses to identify parapneumonic empyema and as a systematic review of clinical cases could not be performed, some misclassification of events cannot be ruled out. Our data used de-identified information and chart reviews or validation of the empyema discharge diagnosis was not feasible. Nevertheless, the vast majority of empyema hospitalizations had related procedures listed, suggesting high specificity of the discharge diagnoses. Second, although our data provide an overview of national changes in the incidence of parapneumonic empyema hospitalizations, a detailed assessment of the clinical characteristics of the patients and their microbiological analyses was not possible. Third, our study likely included some empyemas that developed during the course of a hospitalization (hospital-acquired), which appear to have different outcomes and etiologies than community-acquired empyemas.28 Although our study could not specifically distinguish hospital-acquired empyemas, a secondary analysis, that focused on a principal diagnosis of empyema (used as a surrogate for main reason for hospitalization and thus, community acquired empyema), showed results consistent with our main findings. Fourth, although NIS provides a valuable resource for the study of US hospitalizations, this resource does not collect data from patients who receive their care exclusively from federal institutions, such as the Veterans Affairs healthcare institutions; and, therefore we modestly underestimate the real disease burden in adults. Finally, our data sources lacked information for the period preceding hospital admission, and it is possible that some patients with empyema were admitted to the hospital after a previous pneumonia hospitalization or pneumonia managed in the ambulatory settings. In this scenario, some empyema hospitalizations could appear unrelated to pneumonia and would be excluded leading to an underestimation of the burden of parapneumonic empyema.
The etiology of empyema is difficult to establish and we used available information to assess etiologies. Some studies used molecular techniques and suggested that a sizable proportion of culture-negative empyema was caused by pneumococci, mainly serotype 1.12, 33–36 Moreover, although recent studies described the Streptococcus anginosus group as a leading bacterial cause of empyema3, 8, 28 our ability to discriminate between streptococcal species was limited and we only evaluated streptococcal (non-pneumococcal) empyema as a single group. Moreover, for a large proportion of patients, particularly older adults, empyema was recorded as other/unknown etiology.
In conclusion, our study demonstrated a substantial increase in the incidence of parapneumonic empyema hospitalizations in the US. Compared with other types of empyema, staphylococcal-related empyema showed the overall largest relative increase during the study period and was associated with relatively longer hospital stays and higher mortality.
Web Table.
Parapneumonic empyema-related hospitalizations by associated pathogens, United States 1996–2008
| Age group and empyema group | Number, 2008 | Rate per 100000, 2008 (95% CI) | Rate difference£ (95% CI) | Rate ratio£ (95% CI) | Test for trend, p |
|---|---|---|---|---|---|
| Less than 18 years old | |||||
|
| |||||
| Pneumococcal | 507 | 0.68 (0.51–0.91) | 0.07 (−0.17 – 0.43) | 1.1 (0.7–1.7) | 0.093 |
| Streptococcal (non-pneumococcal) | 231 | 0.31 (0.21–0.46) | 0.20 (0.05 – 0.46) | 2.7 (1.5–5) | <0.001 |
| Staphylococcal | 291 | 0.39 (0.28–0.54) | 0.23 (0.06 – 0.51) | 2.4 (1.4–4.1) | <0.001 |
| Other/Unknown | 1293 | 1.74 (1.35–2.23) | 1.03 (0.52 – 1.76) | 2.5 (1.7–3.5) | <0.001 |
| 18–39 years | |||||
|
| |||||
| Pneumococcal | 322 | 0.35 (0.28–0.44) | 0.08 (−0.03 – 0.24) | 1.3 (0.9–1.9) | 0.102 |
| Streptococcal (non-pneumococcal) | 238 | 0.26 (0.19–0.35) | 0.07 (−0.04 – 0.25) | 1.4 (0.8–2.3) | <0.001 |
| Staphylococcal | 466 | 0.51 (0.4–0.64) | 0.39 (0.19 – 0.72) | 4.2 (2.5–7) | <0.001 |
| Other/Unknown | 1358 | 1.48 (1.3–1.68) | 0.58 (0.3 – 0.93) | 1.6 (1.3–2) | <0.001 |
| 40–64 years | |||||
|
| |||||
| Pneumococcal | 924 | 0.93 (0.8–1.08) | 0.15 (−0.06 – 0.41) | 1.2 (0.9–1.5) | 0.205 |
| Streptococcal (non-pneumococcal) | 952 | 0.96 (0.82–1.12) | 0.42 (0.19 – 0.72) | 1.8 (1.3–2.3) | <0.001 |
| Staphylococcal | 1197 | 1.21 (1.05–1.38) | 0.90 (0.56 – 1.36) | 3.9 (2.8–5.4) | <0.001 |
| Other/Unknown | 4969 | 5.01 (4.66–5.38) | 2.68 (2.05 – 3.4) | 2.2 (1.9–2.5) | <0.001 |
| 65 or more years | |||||
|
| |||||
| Pneumococcal | 518 | 1.33 (1.08–1.64) | –0.36 (−0.71 – 0.12) | 0.8 (0.6–1.1) | 0.041 |
| Streptococcal (non-pneumococcal) | 571 | 1.47 (1.21–1.79) | 0.72 (0.3 – 1.31) | 2.0 (1.4–2.7) | <0.001 |
| Staphylococcal | 954 | 2.46 (2.12–2.85) | 1.53 (0.89 – 2.37) | 2.6 (2–3.5) | <0.001 |
| Other/Unknown | 3404 | 8.77 (8.06–9.55) | 4.04 (2.77 – 5.52) | 1.9 (1.6–2.2) | <0.001 |
Rate difference and rate ratios compared 2008 and 1996 rates. Test for trends included all study years, 1996–2008.
What is the key question?;
This study examined changes in the incidence of parapneumonic empyema hospitalizations and associated pathogens in the United States
What is the bottom line?; and
Parapneumonic empyema-related hospitalizations have increased substantially during the last years. A number of pathogens, especially staphylococcus, contributed to this increase.
Why read on?
Empyema is a relatively rare yet very serious disease. This article describes recent increases in its incidence and highlights the need for preventive strategies.
Acknowledgments
Financial support. This study was funded by the Centers for Disease Control and Prevention through a Cooperative Agreement with the Association for Prevention Teaching and Research (TS-1454). Dr. Grijalva is supported by a CDC career development award (K01 CI000163).
Appendix
ICD9-CM codes used for identification of parapneumonic empyema hospitalizations
Footnotes
Potential conflicts of interest. Dr. Grijalva received lecture fees from Wyeth (now Pfizer) and has been a consultant for Glaxo Smith Kline. Dr. Griffin received grant support from MedImmune. Drs. Grijalva and Griffin received research support for an investigator-originated project from Wyeth (now Pfizer). No other potential conflict of interest relevant to this article was reported.
Author Contributions: Study concept and design: Grijalva, Griffin. Acquisition of data: Grijalva. Analysis and interpretation of data: Grijalva, Zhu, Nuorti, Griffin. Drafting of the manuscript: Grijalva, Griffin. Critical revision of the manuscript for important intellectual content: Grijalva, Zhu, Nuorti, Griffin. Statistical analysis: Grijalva, Zhu. Obtained funding: Grijalva, Griffin. Study supervision: Grijalva, Nuorti, Griffin.
Disclaimer. The findings and conclusions in this article are those of the authors and do not necessarily represent the views of the Centers for Disease Control and Prevention.
References
- 1.Septimus E. Pleural Effusion and Empyema. In: Mandell GL, Bennett JERD, editors. Mandell, Douglas, and Bennett’s principles and practice of infectious diseases. Edinburgh: Churchill Livingstone; 2009. pp. 917–924. An imprint of ELSEVIER. [Google Scholar]
- 2.Ashbaugh DG. Empyema thoracis. Factors influencing morbidity and mortality. Chest. 1991 May;99(5):1162–1165. doi: 10.1378/chest.99.5.1162. [DOI] [PubMed] [Google Scholar]
- 3.Ahmed RA, Marrie TJ, Huang JQ. Thoracic empyema in patients with community-acquired pneumonia. Am J Med. 2006 Oct;119(10):877–883. doi: 10.1016/j.amjmed.2006.03.042. [DOI] [PubMed] [Google Scholar]
- 4.Finley C, Clifton J, Fitzgerald JM, Yee J. Empyema: an increasing concern in Canada. Can Respir J. 2008 Mar;15(2):85–89. doi: 10.1155/2008/975312. [DOI] [PMC free article] [PubMed] [Google Scholar]
- 5.Li ST, Gates RL. Primary operative management for pediatric empyema: decreases in hospital length of stay and charges in a national sample. Arch Pediatr Adolesc Med. 2008 Jan;162(1):44–48. doi: 10.1001/archpediatrics.2007.10. [DOI] [PubMed] [Google Scholar]
- 6.Schultz KD, Fan LL, Pinsky J, et al. The changing face of pleural empyemas in children: epidemiology and management. Pediatrics. 2004 Jun;113(6):1735–1740. doi: 10.1542/peds.113.6.1735. [DOI] [PubMed] [Google Scholar]
- 7.Ruoff KL. Streptococcus anginosus (“Streptococcus milleri”): the unrecognized pathogen. Clin Microbiol Rev. 1988 Jan;1(1):102–108. doi: 10.1128/cmr.1.1.102. [DOI] [PMC free article] [PubMed] [Google Scholar]
- 8.Maskell NA, Davies CW, Nunn AJ, et al. U.K. Controlled trial of intrapleural streptokinase for pleural infection. N Engl J Med. 2005 Mar 3;352(9):865–874. doi: 10.1056/NEJMoa042473. [DOI] [PubMed] [Google Scholar]
- 9.Byington CL, Spencer LY, Johnson TA, et al. An epidemiological investigation of a sustained high rate of pediatric parapneumonic empyema: risk factors and microbiological associations. Clin Infect Dis. 2002 Feb 15;34(4):434–440. doi: 10.1086/338460. [DOI] [PubMed] [Google Scholar]
- 10.Byington CL, Samore MH, Stoddard GJ, et al. Temporal trends of invasive disease due to Streptococcus pneumoniae among children in the intermountain west: emergence of nonvaccine serogroups. ClinInfect Dis. 2005;41(1):21–29. doi: 10.1086/430604. [DOI] [PubMed] [Google Scholar]
- 11.Byington CL, Korgenski K, Daly J, Ampofo K, Pavia A, Mason EO. Impact of the pneumococcal conjugate vaccine on pneumococcal parapneumonic empyema. Pediatr Infect Dis J. 2006 Mar;25(3):250–254. doi: 10.1097/01.inf.0000202137.37642.ab. [DOI] [PubMed] [Google Scholar]
- 12.Obando I, Munoz-Almagro C, Arroyo LA, et al. Pediatric parapneumonic empyema, Spain. Emerg Infect Dis. 2008 Sep;14(9):1390–1397. doi: 10.3201/eid1409.071094. [DOI] [PMC free article] [PubMed] [Google Scholar]
- 13.Roxburgh CS, Youngson GG, Townend JA, Turner SW. Trends in pneumonia and empyema in Scottish children in the past 25 years. Arch Dis Child. 2008 Apr;93(4):316–318. doi: 10.1136/adc.2007.126540. [DOI] [PubMed] [Google Scholar]
- 14.Li ST, Tancredi DJ. Empyema hospitalizations increased in US children despite pneumococcal conjugate vaccine. Pediatrics. 2010 Jan;125(1):26–33. doi: 10.1542/peds.2009-0184. [DOI] [PubMed] [Google Scholar]
- 15.Grijalva CG, Nuorti JP, Zhu Y, Griffin MR. Increasing incidence of empyema complicating childhood community-acquired pneumonia in the United States. Clin Infect Dis. 2010 Mar 15;50(6):805–813. doi: 10.1086/650573. [DOI] [PMC free article] [PubMed] [Google Scholar]
- 16.Lee GE, Lorch SA, Sheffler-Collins S, Kronman MP, Shah SS. National hospitalization trends for pediatric pneumonia and associated complications. Pediatrics. 2010 Aug;126(2):204–213. doi: 10.1542/peds.2009-3109. [DOI] [PMC free article] [PubMed] [Google Scholar]
- 17.Agency for Healthcare Research and Quality. The Healthcare cost and utilization project. Overview of the Nationwide Inpatient sample [Internet site] Available from http://www.hcup-us.ahrq.gov/nisoverview.jsp. Accessed August 10th; 2010.
- 18.Agency for Healthcare Research and Quality. The Healthcare cost and utilization project. Hospital Inpatient Statistics, 1996 [Internet site] Available from http://www.hcup-us.ahrq.gov/reports/natstats/his96/clinclas.htm. Accessed August 10th; 2010.
- 19.Grijalva CG, Nuorti JP, Arbogast PG, Martin SW, Edwards KM, Griffin MR. Decline in pneumonia admissions after routine childhood immunisation with pneumococcal conjugate vaccine in the USA: a time-series analysis. Lancet. 2007 Apr 7;369(9568):1179–1186. doi: 10.1016/S0140-6736(07)60564-9. [DOI] [PubMed] [Google Scholar]
- 20.Buckingham SC, King MD, Miller ML. Incidence and etiologies of complicated parapneumonic effusions in children, 1996 to 2001. Pediatr Infect Dis J. 2003 Jun;22(6):499–504. doi: 10.1097/01.inf.0000069764.41163.8f. [DOI] [PubMed] [Google Scholar]
- 21.Pilishvili T, Lexau C, Farley MM, et al. Sustained reductions in invasive pneumococcal disease in the era of conjugate vaccine. J Infect Dis. Jan 1;201(1):32–41. doi: 10.1086/648593. [DOI] [PubMed] [Google Scholar]
- 22.Poehling KA, Talbot TR, Griffin MR, et al. Invasive pneumococcal disease among infants before and after introduction of pneumococcal conjugate vaccine. Jama. 2006 Apr 12;295(14):1668–1674. doi: 10.1001/jama.295.14.1668. [DOI] [PubMed] [Google Scholar]
- 23.Tsai CJ, Griffin MR, Nuorti JP, Grijalva CG. Changing epidemiology of pneumococcal meningitis after the introduction of pneumococcal conjugate vaccine in the United States. Clin Infect Dis. 2008 Jun 1;46(11):1664–1672. doi: 10.1086/587897. [DOI] [PMC free article] [PubMed] [Google Scholar]
- 24.Whitney CG, Farley MM, Hadler J, et al. Decline in invasive pneumococcal disease after the introduction of protein-polysaccharide conjugate vaccine. N Engl J Med. 2003 May 1;348(18):1737–1746. doi: 10.1056/NEJMoa022823. [DOI] [PubMed] [Google Scholar]
- 25.Tan TQ, Mason EO, Jr, Wald ER, et al. Clinical characteristics of children with complicated pneumonia caused by Streptococcus pneumoniae. Pediatrics. 2002 Jul;110(1 Pt 1):1–6. doi: 10.1542/peds.110.1.1. [DOI] [PubMed] [Google Scholar]
- 26.Ampofo K, Herbener A, Blaschke AJ, et al. Association of 2009 Pandemic Influenza A (H1N1) Infection and Increased Hospitalization With Parapneumonic Empyema in Children in Utah. Pediatr Infect Dis J. Apr 19; doi: 10.1097/INF.0b013e3181df2c70. [DOI] [PMC free article] [PubMed] [Google Scholar]
- 27.Byington CL, Hulten KG, Ampofo K, et al. Molecular epidemiology of pediatric pneumococcal empyema from 2001 to 2007 in Utah. J Clin Microbiol. Feb;48(2):520–525. doi: 10.1128/JCM.01200-09. [DOI] [PMC free article] [PubMed] [Google Scholar]
- 28.Maskell NA, Batt S, Hedley EL, Davies CW, Gillespie SH, Davies RJ. The bacteriology of pleural infection by genetic and standard methods and its mortality significance. Am J Respir Crit Care Med. 2006 Oct 1;174(7):817–823. doi: 10.1164/rccm.200601-074OC. [DOI] [PubMed] [Google Scholar]
- 29.Spellberg B, Guidos R, Gilbert D, et al. The epidemic of antibiotic-resistant infections: a call to action for the medical community from the Infectious Diseases Society of America. Clin Infect Dis. 2008 Jan 15;46(2):155–164. doi: 10.1086/524891. [DOI] [PubMed] [Google Scholar]
- 30.Kyaw MH, Lynfield R, Schaffner W, et al. Effect of introduction of the pneumococcal conjugate vaccine on drug-resistant Streptococcus pneumoniae. N Engl J Med. 2006 Apr 6;354(14):1455–1463. doi: 10.1056/NEJMoa051642. [DOI] [PubMed] [Google Scholar]
- 31.Anthonisen NR. Empyema. Can Respir J. 2008 Mar;15(2):69–70. doi: 10.1155/2008/927191. [DOI] [PMC free article] [PubMed] [Google Scholar]
- 32.Avansino JR, Goldman B, Sawin RS, Flum DR. Primary operative versus nonoperative therapy for pediatric empyema: a meta-analysis. Pediatrics. 2005 Jun;115(6):1652–1659. doi: 10.1542/peds.2004-1405. [DOI] [PubMed] [Google Scholar]
- 33.Eltringham G, Kearns A, Freeman R, et al. Culture-negative childhood empyema is usually due to penicillin-sensitive Streptococcus pneumoniae capsular serotype 1. J Clin Microbiol. 2003 Jan;41(1):521–522. doi: 10.1128/JCM.41.1.521-522.2003. [DOI] [PMC free article] [PubMed] [Google Scholar]
- 34.Tarrago D, Fenoll A, Sanchez-Tatay D, et al. Identification of pneumococcal serotypes from culture-negative clinical specimens by novel real-time PCR. Clin Microbiol Infect. 2008 Sep;14(9):828–834. doi: 10.1111/j.1469-0691.2008.02028.x. [DOI] [PubMed] [Google Scholar]
- 35.Ploton C, Freydiere AM, Benito Y, et al. Streptococcus pneumoniae thoracic empyema in children: rapid diagnosis by using the Binax NOW immunochromatographic membrane test in pleural fluids. Pathol Biol (Paris) 2006 Oct-Nov;54(8–9):498–501. doi: 10.1016/j.patbio.2006.07.031. [DOI] [PubMed] [Google Scholar]
- 36.Le Monnier A, Carbonnelle E, Zahar JR, et al. Microbiological diagnosis of empyema in children: comparative evaluations by culture, polymerase chain reaction, and pneumococcal antigen detection in pleural fluids. Clin Infect Dis. 2006 Apr 15;42(8):1135–1140. doi: 10.1086/502680. [DOI] [PubMed] [Google Scholar]