

Abstract
Receptors located on brain capillary endothelial cells forming the blood–brain barrier are the target of most brain drug delivery approaches. Yet, direct subcellular evidence of vectorized transport of nanoformulations into the brain is lacking. To resolve this question, quantum dots were conjugated to monoclonal antibodies (Ri7) targeting the murine transferrin receptor. Specific transferrin receptor-mediated endocytosis of Ri7-quantum dots was first confirmed in N2A and bEnd5 cells. After intravenous injection in mice, Ri7-quantum dots exhibited a fourfold higher volume of distribution in brain tissues, compared to controls. Immunofluorescence analysis showed that Ri7-quantum dots were sequestered throughout the cerebral vasculature 30 min, 1 h, and 4 h post injection, with a decline of signal intensity after 24 h. Transmission electron microscopic studies confirmed that Ri7-quantum dots were massively internalized by brain capillary endothelial cells, averaging 37 ± 4 Ri7-quantum dots/cell 1 h after injection. Most quantum dots within brain capillary endothelial cells were observed in small vesicles (58%), with a smaller proportion detected in tubular structures or in multivesicular bodies. Parenchymal penetration of Ri7-quantum dots was extremely low and comparable to control IgG. Our results show that systemically administered Ri7-quantum dots complexes undergo extensive endocytosis by brain capillary endothelial cells and open the door for novel therapeutic approaches based on brain endothelial cell drug delivery.
Keywords: Blood–brain barrier, drug targeting, brain capillary endothelial cells, monoclonal antibody, quantum dot nanocrystals
Introduction
Brain capillary endothelial cells (BCECs) forming the blood–brain barrier (BBB) are classically considered as a major obstacle to drug delivery to the brain.1 Indeed, the BBB blocks the entry of most drugs into the central nervous system (CNS), making brain drug delivery one of the most challenging pharmaceutical problems.2 However, besides their role as a neuroprotective barrier, BCECs are essential to CNS homeostasis. Displaying a high metabolic rate,3 BCECs express a wide array of transporters and receptors enabling them to, respectively, take up small solutes and large hydrophilic compounds (insulin, transferrin, etc.) that are essential for the brain.4 These BCEC receptor-mediated transport systems therefore offer unique opportunities for brain drug delivery.
It has been initially hypothesized that vectors targeting these transport systems could be used to carry therapeutic drugs across the BBB.5 Preclinical successes have been reported using vectors targeting the transferrin receptor (TfR),6,7 the insulin receptor,8 and the low-density lipoprotein receptor-related-1.9 Owing to its high density in brain capillaries and its key role in iron transport, the TfR is one of the best-known receptors used for brain drug delivery.7,10 However, systemically administered antibodies targeting the TfR with a high affinity are unable to cross the BBB to target neurons and glial cells, instead remaining attached to BCECs.11,12 Indeed, although brain uptake of transferrin-bound iron is clearly mediated by the TfR localized on BCECs, the mechanism underlying the release of iron from the abluminal side of endothelial cells to the brain remains unclear.13,14 Accordingly, preclinical data suggesting the potential of novel vectors targeting the TfR to treat CNS diseases have not yet translated into clinical successes.15,16 Therefore, a better understanding of the intracellular fate of anti-TfR vectors in BCECs remains a prerequisite to their use for brain drug delivery.
In order to determine the nanocarrying capacity of anti-TfR vectors, we systemically administered Balb/c mice with quantum dots (Qdot™ 625) conjugated with anti-TfR monoclonal antibodies (mAbs) (Ri7 versus a control IgG). Key advantages of Qdots include the possibility of combining fluorescence and transmission electron microscopy (TEM) in the same experiments,17 as well as the possibility to investigate the delivery capacity of the anti-TfR vector Ri7 due to the relatively large size of these particles (10–20 nm). Because of these features, tracking and counting Qdots in brain tissue can then be performed to assess whether endocytosis, transcytosis, or binding restricted to luminally exposed TfR was involved. Fluorescence microscopic analysis showed the colocalization of Ri7-Qdots with the basal lamina marker collagen IV, in the absence of fluorescence signal in either neurons or astrocytes. TEM confirmed the massive internalization of Ri7-Qdot complexes into BCECs, mainly in multivesicular endosomes, but also in small vesicles (∼100 nm) and tubular structures, suggesting that Ri7-Qdot complexes are internalized by BCECs via endocytosis.
Materials and methods
Production and purification of mAbs in vitro
Hybridoma cell lines Ri7217.1.4 (Ri7) and 8d3 secreting rat mAbs specific for the mouse TfR1 were obtained from Drs Jayne Lesley (Salk Institute, via Dr Pauline Johnson, U. of British Columbia, Canada) and Britta Engelhardt (U. of Bern, Bern, Switzerland). The antibodies were designed to target an exofacial epitope on the TfR. Hybridoma cell lines were cultured in CELLine bioreactors in serum-free mAb medium (BD Biosciences, Mississauga, ON, Canada). Supernatants were harvested weekly. mAbs were purified using HiTrap protein G columns and the Akta Prime Plus system (GE Healthcare, Baie d’Urfé, QC, Canada) according to the manufacturer’s recommendations. Purified antibodies were concentrated with Amicon ultracentrifugal filter units (Millipore, Billerica, MA; molecular weight cutoff, MWCO = 30 kDa) and subsequently dialyzed against 1X phosphate-buffered saline (PBS) (pH 7.4) using Slide-A-Lyzer dialysis cassettes (MWCO = 10 kDa; Pierce, Rockford, IL). All protein concentrations were determined based on bicinchoninic acid (BCA) assays (Pierce). The weekly yield of purified mAbs averaged 3 mg.
mAb conjugation to Qdot 625 nanocrystals
Ri7, 8d3, and control IgG (BioXCell, West Lebanon, NH, USA) (300 µg) were thiolated for 1 h with a 40:1 molar excess of freshly prepared 2-iminothiolane (Traut’s reagent) in 0.05 M sodium borate/0.1 mM EDTA, pH 8.5. Thiolated mAbs were transferred to a buffer containing 0.05 M HEPES/0.01 mM EDTA (pH 7.0) by centrifugation in a Vivaspin (Sartorius Stedim Biotech, Aubagne, France) filter unit (MWCO 30 kDa). This step was repeated twice to discard 2-iminothiolane and reduce the final volume to 40 µl. Conjugation of mAbs to Qdot 625 nanocrystals (Life Technologies, Burlington, ON, Canada) was performed according to the manufacturer’s indications. Briefly, SMCC-activated Qdots and thiolated mAbs were desalted and then mixed together and incubated for 1 h at room temperature to allow conjugation. To quench the conjugation reaction, 10 µl of fresh 10 mM 2-mercaptoethanol solution were added to the mixture and incubated for 30 min. Finally, samples were concentrated to a final volume of 20 µl and conjugated mAbs were then purified using a size-exclusion chromatography column to discard unconjugated material. We estimated the number of antibodies attached to a single Qdot by measuring the protein concentration divided by the Qdot concentration calculated from the absorbance measured at 612 nm. Between three and four antibodies on average were conjugated to a single Qdot following these experimental procedures. Conjugated Qdots were characterized by dynamic light scattering (DLS) using a Zetasizer Nano ZS (Malvern Instruments Ltd, Worcestershire, UK). Parameters recorded included the hydrodynamic diameter, polydispersity index, and ζ-potential. Size distribution of Qdots was also assessed from the direct diameter measurement of 50 particles on TEM images, using ImageJ sofware.
In vitro competition studies
Murine neuroblastoma (N2A, #CCL-131, ATCC, Manassas, VA) and brain endothelioma (bEnd5, #96091930, HPACC, Salisbury, UK) cells were seeded in 96-well plates containing DMEM supplemented with 10% FBS at 4 × 10⁴ and 3 × 10⁴ cells/well, respectively. One day later, the medium was removed and cells were pretreated for 15 min with unlabeled Ri7 or control IgG (0, 10, 50, or 200 nM). Ri7-Qdots were then added to a final mAb concentration of 8.3 nM and incubation was resumed for 15 min. After washing twice with cold PBS, internalization of Ri7-Qdots was measured with a Synergy HT (Biotek, Winooski, VT) plate reader (440 nm (λexc)/645 nm (λem)). A similar protocol was used with µ-Slide VI0.4 chamber slides (IBIDI, Munich, Germany), where N2A (1.2 × 10⁴ cells/well) and bEnd5 (2 × 10⁴ cells/well) cells were pretreated with 50 nM unconjugated Ri7, 8d3, or control IgG and then incubated with 16.7 nM Ri7-Qdots. The washing steps were performed with 1X D-PBS containing Mg2+ and Ca2+. After two washes, cells were fixed for 20 min with 4% paraformaldehyde (PFA) and permeabilized with 0.5% Triton X-100. Qnuclear™ Deep Red stain was used to label nuclei, and slides were mounted with Qmount™ Qdot mounting media (Life Technologies).
Animals
Adult ♂ Balb/c mice (Charles River, Wilmington, MA, USA) weighing 20–30 g were used. They had ad libitum access to food and water. All procedures were performed in accordance with the Canadian Council on Animal Care standards and Animal Research: Reporting In Vivo Experiments guidelines and were approved by the Animal Ethics Committee of Université Laval.
Tissue preparation for postmortem analysis
For microscopy experiments, following a single intravenous (caudal vein) injection of 300 µg (15 mg/kg) of mAbs conjugated to Qdots, animals were sacrificed 0.5, 1, 4, or 24 h postinjection by terminal transcardiac perfusion under deep anesthesia with ketamine/xylazine. The injected dose of ketamine/xylazine was calculated based on the mouse weight (0.1 ml/10 g of a ketamine/xylazine solution at 87.5/12.5 mg/ml). Terminal perfusions were performed with 25 ml of 1X PBS, 50 ml of 3.5% acrolein in 0.1 M sodium phosphate buffer, pH 7.4, and/or 50 ml of 4% PFA in the same buffer. Brains were rapidly dissected, postfixed in 4% PFA for 4 h and cut with a vibratome (Leica Microsystems, Richmond Hill, ON, Canada) in transverse sections of 55 µm, which were collected in cold PBS. Tissues used for colocalization analysis were cut in coronal sections of 12 µm with a cryostat (Leica Microsystems). For Qdot biodistribution analysis, mice were sacrificed 1 h postinjection by decapitation under deep anesthesia with ketamine/xylazine (87.5/12.5 mg/ml), excepted for the capillary depletion experiment where mice were sacrificed by intracardiac perfusion with PBS 1X. Brain, heart, kidney, liver, lungs, and plasma were collected, weighed, and rapidly frozen until homogenization.
Capillary depletion
Brains were homogenized in 1.0 ml of physiological cold HEPES buffer (10 mM HEPES, 141 mM NaCl, 4 mM KCl, 2.8 mM CaCl2, 1 mM MgSO4, 1 mM NaH2PO4, and 10 mM glucose at pH 7.4). Afterward, 1.0 ml of a cold 37% dextran solution was added to the homogenate to obtain a final concentration of 18% and all samples were centrifuged at 5400g for 20 min at 4℃. The resulting postvascular supernatant and capillary pellet were separated manually and kept for further cadmium determination by ICP-MS. In the brain, the enzyme γ-GT is specifically expressed by BCECs and its activity can be used to confirm the success of the capillary depletion and to determine the contamination of the supernatant by BCECs content. γ-GT activity (Teco Diagnostics, Anaheim, CA) was assayed according to the manufacturer’s indications. Briefly, 100 µl of working reagent was added to 20 µl of each sample. Absorbance at 405 nm was recorded at 37℃ every minute, during 10 min.
Biodistribution analysis of Qdots
All samples were digested in 0.5 ml of an acidic solution (HNO3 (67–70%, #870003-261, VWR Canada, Montreal, CA) and H2O2 (30–32%, #H325-500, Fisher Scientific, Ottawa, CA) 1:1) at 60℃ for 12 h using heating blocks. Samples were homogenized every hour using a vortex mixer and tube caps were opened frequently during the process to equilibrate pressure. After complete digestion, samples were transferred to a 15 ml conical tube, diluted to a final 10 ml volume with ultratrace analysis water (#14211-1 L-F, Sigma-Aldrich, St Louis MO, USA). Then, all samples were filtered through 0.45 µm syringe filters (#SLHVM33RS, EMD Millipore, Etobicoke, CA) and transferred to sampling tubes. Cadmium determination was carried out in an ICP-MS (Agilent 8000 Triple Quad ICP-MS, Agilent technologies, Santa Clara CA, USA) equipped with a fully automated sampling unit (ASX-520, Agilent technologies). Cadmium signal (m/z = 111) was measured following experimental parameters and instrument settings proposed by the manufacturer handbook. Standard solutions in the µg/l (ppb) range were prepared from a 1000 ± 4 mg/l Cd2+ stock solution (#20895, Sigma-Aldrich). Blank sample analysis has shown no significant sign of signal interference and the limit of detection was evaluated at ∼0.2 µg/l using the (3σblank/m) approximation. Calibration standards were measured before, after, and midway through sample analysis and no significant drift of the analytical signal was observed (RSD ≅ 7%). A Qdot-free brain sample spiking at 10 µg/l Cd2+ was used as a reference material and was determined at 9.3 ± 0.7 µg/l giving the method an accuracy of ∼8%. Protein concentrations were determined based on BCA assays (Pierce).
Distribution volume (Vd) values in each organ were calculated as follows:
Immunofluorescence
Washing steps were performed using 1X PBS, pH 7.4, between each step of the immunofluorescence protocol (see below). Brain sections from mice injected with Qdot-mAbs were blocked for 1 h in a PBS solution containing 5% horse serum (Life Technologies) and 0.2% Triton X-100. Sections were then incubated overnight at 4℃ with primary antibodies in the blocking solution: goat anti-type IV collagen (Chemicon/Millipore, Temecula, CA, 1:500), mouse anti-feminizing locus on X-3 (Fox-3/neuronal nuclei (NeuN)), a neuronal marker (NeuN, Chemicon/Millipore, 1:1000), mouse anti-glial fibrillary acidic protein (GFAP, Sigma-Aldrich, Oakville, ON, Canada, 1:1000), and rabbit anti-laminin (Sigma-Aldrich, 1:1000). Following incubation with primary antibodies, slices were exposed to Alexa Fluor-conjugated donkey anti-goat and anti-mouse secondary antibodies (Life Technologies, 1:1000). Slides were then coverslipped with Mowiol™ mounting media (Sigma-Aldrich).
Immunogold labeling of unconjugated Ri7 mAb
Sections were washed in 1X (pH 7.4) PBS and blocked for 90 min with the same PBS solution containing 2% normal goat serum and 0.5% gelatin. Sections were incubated with a junction antibody (rabbit anti-rat IgG (H + L), 1:500, Vector Laboratories, Burlington, ON, Canada) for 90 min, washed with PBS, and incubated for 20 h at 4℃ in a solution containing a Nanogold goat anti-rabbit Fab’ secondary antibody conjugated to 1.4 nm colloidal gold particles (Nanoprobes, Yaphank, NY). These sections were washed in 3% (w/v) sodium acetate (pH 7.0) and then treated with HQ Silver Intensification kit (Nanoprobes) to increase the effective size of the immunogold particles and processed for TEM as described below. All incubations were performed in the blocking solution.
Ultrastructural analysis of mAb internalization
Sections were then osmicated, dehydrated in ethanol and propylene oxide, and flat-embedded in Durcupan (Fluka, Buchs, Switzerland). Quadrangular pieces from each section were removed, glued to the tip of resin blocks, and cut in ultrathin sections (∼80 nm) with a Leica EM UC7 ultramicrotome.18 Ultrathin sections were collected on bare 150-mesh copper grids, stained with lead citrate, and examined with a Tecnai 12 transmission electron microscope (100 kV; Philips Electronic) with an integrated MegaView II digital camera (SIS, Schwentinental, Germany).
Data and statistical analysis
Quantification of Qdots was performed on 35–50 sections per animal (n = 3–4), using Image J software. In vitro experiments were performed in triplicate. ANOVA followed by a Bonferroni post hoc test and analyses of contingency (chi-squared test) were used to detect significant differences when appropriate. Statistical significance was set at *p < 0.05, ***p < 0.001, and ****p < 0.0001. All statistical analyses were performed using Prism 5 for Macintosh (GraphPad Software Inc., San Diego, CA).
Results
Unconjugated anti-TfR mAbs prevent binding of Ri7-Qdot complexes
To estimate the size of Ri7-Qdot conjugates, we first took advantage of the electron density of Qdot nanocrystals. By measuring the diameter of 50 nanoparticles, we estimated the Qdots size on TEM images to 9.15 ± 0.87 nm (Figure 1(a) and (b)). As measured with DLS, Ri7-Qdots had a mean size of 26.1 ± 0.4 nm with a polydispersity index of 0.162 ± 0.047 and a ζ-potential of -12.7 mV (Figure 1(c)). Internalization of Ri7-Qdot conjugates was confirmed in vitro using cultured bEnd5 murine BCECs and N2A mouse neuroblastoma cells, which both express the TfR (Figure 1(d) to (k)). To verify that the internalization of Ri7-Qdots was mediated by the TfR, we pretreated N2A and bEnd5 cells with two anti-TfR mAb (Ri7 and 8d3) or a control rat IgG for 15 min. Unlabeled Ri7, unlike control IgG, reduced the uptake of Ri7-Qdots in both cell lines by up to 80% within 15 min (Figure 1(d) and (e)). Qdot binding to TfR was suppressed by the addition of either Ri7 or 8d3 in both N2A (Figure 1(f) to (h)) and bEnd5 cells (Figure 1(i) to (k)), supporting the potential of Ri7-Qdot conjugates to target BCECs.
Figure 1.

Characterization of Ri7-Qdots complexes and in vitro TfR-specific internalization. (a and b) The images were acquired from a TEM at 120 kV and show an average Qdots size of 9.15 ± 0.87 nm. (c) DLS analyses of conjugated nanocrystals estimated the size of the nanocomplex to 26.1 ± 0.4 nm with a polydispersity index of 0.162 ± 0.047 and a ζ-potential of -12.7 mV. Murine (d) neuroblastoma (N2A) and (e) brain endothelioma (bEnd5) cells were seeded in 96-well plates containing DMEM (+10% FBS). Cells were pretreated for 15 min with unlabeled Ri7 or control IgG (0, 10, 50, or 200 nM), followed by the addition of 8.3 nM Ri7-Qdots. Values are expressed as the mean ± standard error of the mean (SEM) of two experiments in triplicate. Statistical comparison: (d and e) one-way ANOVA followed by a Bonferroni post hoc test, ***p < 0.001 and ****p < 0.0001 versus unlabeled IgG. Control values (without unlabeled mAbs) were adjusted to 100%. (f to h) N2A and (i to k) bEnd5 cells were pretreated with 50 nM unconjugated control IgG (f and i), 8d3 (g and j), or Ri7 cells (h and k), and then incubated with 16.7 nM Ri7-Qdots. Qdots can be seen in red and nuclei in blue. Scale bars, b = 20 nm, f and i = 20 µm, g, h, j, and k = 40 µm.
Adding antibodies targeting the TfR leads to increased distribution of Qdots in the brain
To determine the extent by which Ri7 changes Qdot distribution after a systemic administration, we performed a biodistribution experiment in the mouse. Cadmium determination by ICP-MS was used to evaluate the relative distribution of Qdots (conjugated with either Ri7 or control IgG) in the brain, liver, spleen, kidneys, lung, and the plasma, 1 h after i.v. injection. The apparent volumes of distribution (Vd) were computed and are shown in Figure 2. Vd in the brain was fourfold higher for Ri7-Qdots compared to control 2a3-Qdots, consistent with a significant TfR-targeted delivery. Moreover, cadmium concentrations were approximately 10-fold higher in isolated capillaries compared with remaining brain tissue, suggesting that Ri7-Qdots remained mainly sequestered in BCECs (Figure 2(f)). The relative purity of the capillary pellet was confirmed by assessing the enzymatic activity of the endothelial specific enzyme γ-GT (pellet: 10.0 ± 3.7 mmol/min/mg, supernatant: 1.0 ± 0.1 mmol/min/mg).
Figure 2.

Brain distribution of Qdots is enhanced by conjugation to TfR-targeting mAbs. Mice were injected with Qdots conjugated with TfR-targeting or generic control mAbs and sacrificed 1 h following systemic injection. (a to e) Distribution volume (Vd) of Ri7-Qdots was calculated in organs from unperfused mice. (f) Capillaries of intracardially perfused mice were isolated by capillary depletion and compared with homogenates for the whole brain and postcapillary supernatants. Values are based on ICP-MS-determined cadmium levels and expressed as the mean ± SEM (n = 3/group). Statistical comparison: Unpaired t-test with Welch’s correction, *p < 0.05 or one-way analysis of variance followed by a Tukey post hoc test: **p < 0.01. Cadmium concentrations in all organs from untreated mice were lower than the limit of detection.
Intravenously injected Ri7-Qdots selectively and extensively label cerebral blood vessels
To determine the brain distribution of Ri7-Qdot complexes in vivo, we first conducted fluorescence microscopy analyses after intravenous injection to Balb/c mice. Data shown in Figure 3 indicate that Ri7-Qdot complexes were extensively bound to cerebral blood vessels, including small-diameter (<12 µm) capillaries. The observed signal was strong as early as 30 min postinjection, remained at peak up to 4 h postinjection, and then declined significantly 24 h postinjection ((a) to (c)). No signal was detectable for control IgGs conjugated with Qdots (d). We also observed qualitative changes over time. Between 4 and 24 h, the fluorescence signal had a granular-like appearance, suggesting a progressive concentration of Ri7-Qdot complexes into intracellular vesicles. To determine whether Ri7-Qdot complexes had reached neurons or glial cells, we performed immunofluorescence colocalization studies using NeuN and GFAP antibodies to label neuronal cells and astrocytes, respectively. However, no Ri7-Qdot signal was found in either neurons or astrocytes in any of the ∼30 sections investigated, 1 h after systemic injection ((f) and (g)). On the other hand, the specific distribution of Ri7-Qdot complexes in brain microvessels was confirmed by their colocalization with immunolabeled collagen IV, a marker of the basal lamina (H).
Figure 3.
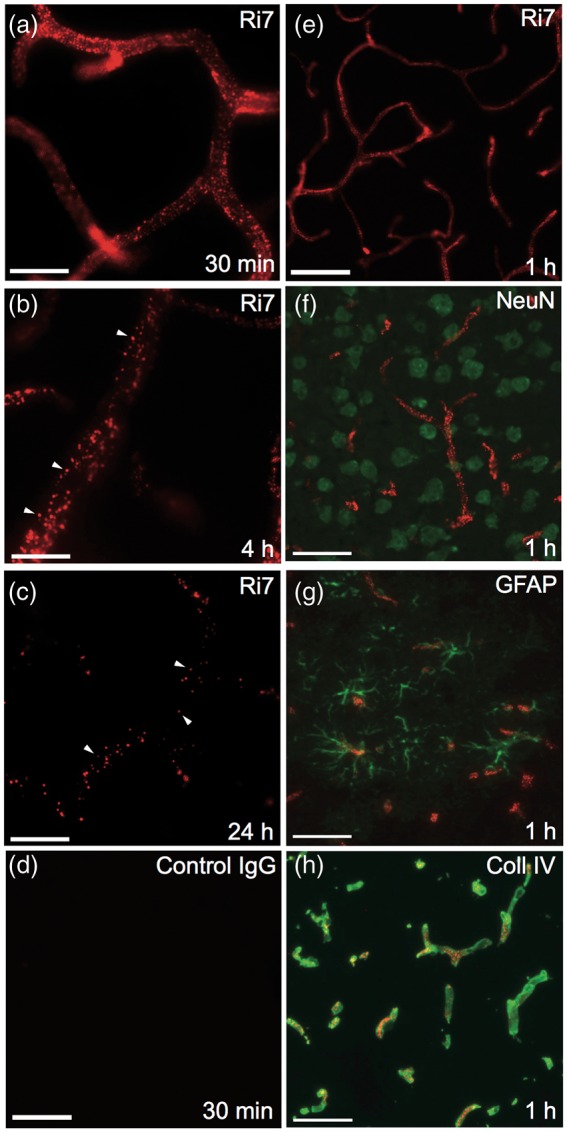
Labeling of cerebral blood vessels after intravenous injection of TfR mAbs. Balb/c mice were intravenously injected with mAb conjugated with Qdot nanocrystals and sacrificed 0.5, 1, 4, or 24 h postinjection. (a to d) The fluorescence signal (red) in mice injected with Ri7-Qdots remained strong up to 4 h postinjection but had considerably declined after 24 h. At 4 h (b) and 24 h (c), the mAb-Qdot signal had migrated to intracellular vesicles, as shown by the granular distribution. (d) Lack of signal from mice injected with Qdots conjugated with a generic control IgG is shown in (d). (e) Fluorescence signal from mAb-Qdots (red). (f) Immunofluorescence against neuronal marker NeuN showed absence of Qdot-labeled Ri7 (red) within neurons (green). (g) Ri7-Qdot signal (red) was not detected in astrocytes labeled with GFAP (green). (h) Colocalization of Ri7-Qdots (red) with the basal lamina immunolabeled with type IV collagen (green). Photomicrographs were taken in the cerebral cortex of mice (n = 3–4 animals per group). (a to d) Scale bar = 20 µm. (e to h) Scale bar = 50 µm.
Endocytosis of Ri7-Qdot complexes following intravenous injection
To determine whether Ri7-Qdot complexes enter BCECs via endocytosis, undergo transcytosis through the BBB, or simply bind to adluminal TfR without being internalized into BCECs, we performed TEM experiments. The analysis of brain sections from animals sacrificed 30 min, 1, 4, and 24 h following i.v. injection of Ri7-Qdots showed evidence of endocytosis of the complexes into BCECs (Figure 4). At 30 min, Qdots located within BCECs were distributed mainly in tubular structures (∼60–80 nm o.d.) and small vesicles (∼100 nm o.d.). A small population of Ri7-Qdots was located in the luminal compartment of the blood vessels on the adluminal side of endothelial cells, suggesting binding of the complex to TfR (Figure 4(a) to (d)). No Qdots conjugated to control IgG were detected in vessels (Figure 4(e)).
Figure 4.

Ri7-Qdots are extensively internalized in BCECs 0.5 and 1 h after intravenous injection of the vector. Mice injected with mAbs targeting the TfR (Ri7) or a generic control IgG (2a3) conjugated with Qdot nanocrystals were sacrificed 0.5 and 1 h following a systemic injection. (a to d) Electron micrograph showing the distribution of Ri7-Qdot in BCECs 30 min after systemic injection of Qdot conjugates. Ri7-Qdots were located in small vesicles (∼100 nm diameter), tubular structures (shown by arrow), and in the lumen of capillaries. (e) Qdots were not detected in the brain by TEM after intravenous injection of conjugated 2a3. (f to j) After 1 h, Ri7-Qdots were distributed in endothelial MVBs, tubular structures, and small vesicles, while only a few Qdots were found in the basal lamina. Electron micrographs were taken in the striatum of mice (n = 3–4). Scale bar = 200 nm. BCEC: brain capillary endothelial cell; BL: basal lamina; Lu: lumen; P: parenchyma.
To further determine the fate of anti-TfR mAbs after endocytosis, we also performed analyses of brain sections from mice sacrificed 1, 4, and 24 h after i.v. injection. After 1 h (Figure 4(f) to (j)), 4 h (Figure 5(a) to (f)), and 24 h (Figure 5(g) to (l)) the vast majority of Ri7-Qdot complexes were concentrated into multivesicular bodies (MVBs), but a significant fraction was still present in tubular structures, small vesicles, as well as on the basal lamina. At 24 h, fusion of large vesicles containing Qdots with lysosome was observed (Figure 5(i)). Some Qdot complexes also reached the abluminal side of BCECs and the brain parenchyma (Figure 5(b) and (l)). However, those observations were very rare, and Qdots found in the parenchyma were generally located in the vicinity of the basal lamina (∼100–300 nm). Finally, a few Qdots were occasionally observed within pericytes (Figure 5(f)). Immunofluorescence analyses were also conducted at 24 h (Figure 6). Ri7-Qdots complexes were almost exclusively bound to brain microvessels, no fluorescence signal was visible beyond the basal lamina (Figure 6(a) and (b)), and no colocalization with neurons (Figure 6(c)) or astrocytes (Figure 6(d)) was observed.
Figure 5.

The extensive internalization of Ri7-Qdots in BCECs is still easily detectable 4 and 24 h after intravenous injection of the vector. Mice injected with mAbs targeting the TfR (Ri7) or a generic control IgG (2a3) conjugated with Qdot nanocrystals were sacrificed 4 and 24 h following a systemic injection. (a to l) Four and 24 h postinjection, Qdot complexes were concentrated in MVBs, but a few were still visible in small vesicles. A few Qdots were also located in the basal lamina, in pericytes and in the parenchyma (shown by arrows). Electron micrographs were taken in the striatum of mice (n = 3–4). Scale bar = 200 nm. BCEC: brain capillary endothelial cell; BL: basal lamina; L: lysosome; Lu: lumen; M: mitochondria; P: parenchyma; Pe: pericyte.
Figure 6.

Labeling of brain blood vessels 24 h after intravenous injection of TfR mAbs. Mice were injected with mAbs conjugated with Qdot nanocrystals and sacrificed 24 h postinjection. (a) Colocalization of Ri7-Qdots (red) with the basal lamina immunolabeled with type IV collagen (green) and (b) laminin marker (green). (c) Immunofluorescence against the neuronal marker NeuN showed absence of Qdot-labeled Ri7 (red) within neurons (green). (d) Ri7-Qdot signal (red) was not detected in astrocytes labeled with GFAP (green). Photomicrographs were taken in the cerebral cortex of mice (n = 3–4 animals per group). Scale bar = 20 µm.
Adding a large moiety to anti-TfR mAb does not interfere with BBB crossing
To validate whether the conjugation of Qdot nanocrystals to mAbs altered the capacity of Ri7 to be exported to the brain parenchyma, we injected unlabeled antibodies and performed immunogold labeling using the appropriate secondary antibodies (Figure S1). We observed that unlabeled anti-TfR mAbs were distributed similarly to Qdot-conjugated Ri7 (Figure S1(a) to (d)), suggesting that Qdot conjugation to an anti-TfR mAb does not affect distribution of the latter within brain cells.
Qdot count analysis
Next, we performed a semi-quantitative determination of the subcellular distribution of Qdots (n = 3–4) in brain capillaries (Figure 7). The total number of internalized Qdots reached 8 ± 1 at 30 min post injection, peaked at 34 ± 7 at 1 h, and decreased thereafter (16 ± 3 and 9 ± 1 at 4 and 24 h, respectively). At all time points, the vast majority (70–90%) of Qdots remained localized within intracellular compartments of BCEC, along with subpopulations of Qdots found on the luminal or abluminal side of brain microvessels (Figure 7(a)). Nonetheless, the proportion of Qdots in the luminal compartment of brain blood vessels declined over time while the percentage of Qdots on the abluminal side increased, suggesting that Ri7-Qdot complexes migrated toward the abluminal side over a 24 h period (Figure 7(a)). However, as stated above, the fraction of Qdots apparently reaching the brain parenchyma (i.e. beyond the basal lamina) remained relatively low (Figure S2). Supplementary Figure S3 (Figure S3(a) to (c)) illustrates the delimitations used to define the luminal, endothelial, and abluminal compartments. The abluminal compartment included the basal lamina, pericytes, astrocytic, and neuronal projections.
Figure 7.
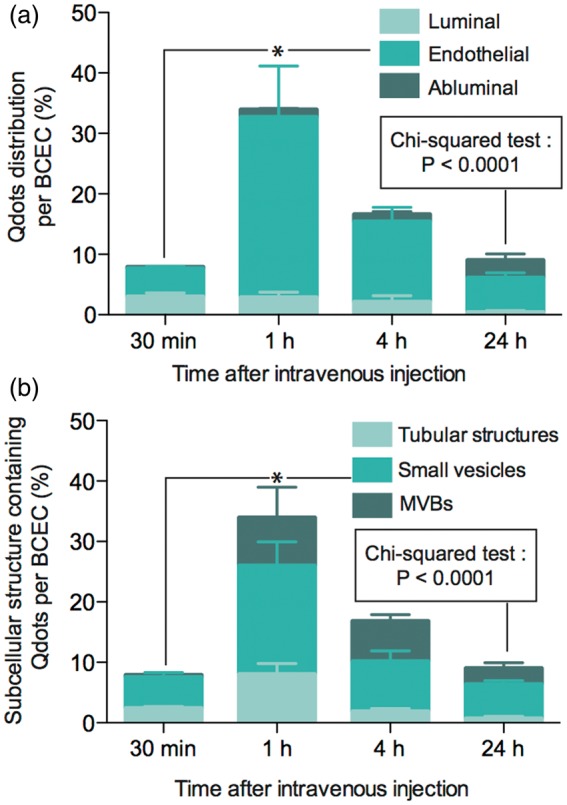
Analysis of Qdot subcellular distribution. Mice were systemically injected with TfR mAbs conjugated with Qdot nanocrystals and sacrificed 0.5, 1, 4, or 24 h later. (a) Percentage of Qdots found in the luminal, endothelial, or abluminal compartments of BCECs. (b) Percentage of Qdots found in tubular structures, small vesicles, and MVBs. Between 35 and 50 sections per time point were analyzed; n = 3–4 mice per time point. Data represent the mean ± SEM. Statistical comparison: (a and b) One-way ANOVA followed by a Bonferroni post hoc test, *p < 0.05, Chi-squared test, p < 0.0001.
Overall, Qdots were mostly found in small vesicles (58 ± 3.5%) at all time intervals examined (Figure 7(b)). The proportion of Qdots found in tubular structures was the highest 30 min (∼30%) after injection and decreased over time (24 h: ∼8%) while the proportion of Qdots found in MVBs increased over time (30 min: ∼6%) to reach its maximum 4 h postinjection (∼40%), suggesting a progressive routing of Qdots toward MVBs via the late endocytic pathway. Electron micrographs shown in supplementary Figure 3(d) to (f) illustrate typical examples of the subcellular structures analyzed.
In summary, qualitative and quantitative TEM analyses have revealed an extensive internalization of systemically administered Ri7-Qdots into BCECs, with progressive accumulation into MVBs, consistent with their incorporation via an endocytotic process.
Discussion
In this present work, we report for the first time direct evidence of the capacity of the anti-TfR mAb Ri7 to ferry a large quantity of nanoparticles into BCECs, but not in neurons or astrocytes, after a systemic injection. By combining fluorescence and electron microscopy approaches, our results demonstrate the specific BCEC targeting capacity of anti-TfR mAb, at both a cellular and subcellular level.
Biodistribution experiments using ICP-MS showed a relative tissue distribution and limited brain accretion of unconjugated Qdots after a systemic injection in the mouse, in agreement with previous studies.19,20 In contrast, the addition of a mAb targeting the TfR markedly increased the total cerebral accumulation of Qdots. The brain distribution values obtained here with Ri7-Qdots (Vd = 35.5 ± 5.2 µl/g) were almost fourfold higher than sucrose and azidothymidine, two molecules known for not crossing the BBB.21 On the other hand, Vd was comparable to [125I]-Tf22 and morphine-6-glucoronide.23 Indeed, the brain Vd of Ri7-Qdots reported here is comparable to common drugs marketed for CNS diseases,24 consistent with the strong BBB targeting capacity of anti-TfR mAbs. However, measurements based on whole brain homogenates do not discriminate endothelial accumulation from penetration into the brain parenchyma. Our subsequent measurements of cadmium in isolated brain microvessels indicate that the vast majority of Ri7-Qdots (∼90%) remain actually sequestered into BCECs, consistent with earlier work of Moos and Morgan in rats.25 The vast majority of the mAbs (∼90%) was found in the capillary pellet fraction versus only a small amount (∼10%) in the postcapillary supernatant. However, the proportion of Ri7-Qdots recovered in the supernatant was roughly equal to the proportion of γ-GT activity in each fraction, suggesting that the presence of Qdots in the supernatant is due to residual microvessels in the supernatant.
Fluorometric microscopy analyses confirmed that the anti-TfR mAb Ri7 can deliver Qdots into BCECs throughout the cerebral vasculature. These data are consistent with our previous work showing that systemically administrated Ri7 coupled to a fluorescent dye accumulate and are restricted into brain microvessels.12 Such BCEC-specific brain targeting through the use of anti-TfR mAbs is also in keeping with reports using radiolabeling, fluorescence resonance energy transfer (FRET), and immunohistochemical approaches.11,25
TEM analysis of Qdot brain distribution in vivo provides a new subcellular perspective on the targeting capacity of anti-TfR vectors. Our data clearly show that a large number of Qdots complexed with the Ri7 mAb did not only bind to the TfR present at the surface of BCECs but were also internalized into BCEC of mice, likely via a receptor-mediated endocytic mechanism. Combined with in vitro evidence generated using bEnd5 and N2A cultured cells, our results indicate that binding of the anti-TfR mAb Ri7 to the TfR triggered the endocytosis of Qdots into BCECs. Whereas shortly after injection (30 min) of the Ri7-Qdot, a major fraction of the conjugate was found in tubular structures and small vesicles, Qdots-Ri7 accumulated in MVBs at later times.
MVBs are found at the crossroads between the recycling and late endocytosis pathways and, depending on the cell type and on the model considered, can either fuse with lysosomes, mature into lysosomes, or fuse with the plasma membrane, thereby releasing their vesicular content (exosomes) by exocytosis.26 Normally, the Tf-TfR endocytic pathway avoids lysosomal fusion and the TfR is recycled toward the luminal membrane.27 Such an accumulation of Ri7-Qdot complexes into endosomal structures might prove useful from a drug delivery perspective, particularly if vectors are coupled to pH-sensitive nanoparticles programmed to release therapeutic agents into endosomes.28
While our TEM data are consistent with the integration of anti-TfR vectors into BCECs via endocytic mechanisms,14,29,30 they do not support the previously held hypothesis that anti-TfR mAbs undergo complete transcytosis in vivo to reach cells in the brain parenchyma. Such contention has been in part fueled by the repeated confirmation that TfRs are expressed in neurons12,31 and astrocytes.32 Here, Ri7-Qdots found in the brain parenchyma were extremely rare, at a frequency barely higher than in control IgG-Qdots injected animals. Based on the proportion of Qdots found in the brain parenchyma in our TEM images, we estimate that less than 0.1% of injected Ri7-Qdots reached the brain parenchyma. Consistent results were obtained using immunogold labeling of Ri7 antibodies on brain sections of injected animals. Although observations of anti-TfR mAb internalization of a similar magnitude are often interpreted as evidence of brain penetration,33,34 they are likely to be quantitatively insufficient for therapeutic use. Finally, more recent findings suggest that the poor brain penetration could alternatively be explained by the relatively high affinity of Ri7 mAbs for the TfR35 which would preclude their final release into the abluminal compartment.36
Overall, given the quantitatively high extent of Ri7-mediated internalization of Qdots, our data strongly suggest that anti-TfR mAbs can be effective BCEC-targeting vectors for drug delivery. Electron microscopic analyses confirmed the internalization of an extensive amount of Qdots within BCECs. In many cases, hundreds of Qdots could be found in a single BCEC, with an average of 34 ± 7 per cell, 1 h after i.v. injection. Considering the relatively large size of Qdots (10–30 nm), our data suggest that anti-TfR mAbs such as Ri7 might well carry other nanoscaled drug carriers to achieve brain endothelial cell delivery.
Mounting evidence suggests that BCECs are attractive from a brain targeting point of view. Indeed, BCEC transport systems are present throughout the dense network of brain capillaries37 and the distance between endothelial and parenchymal cells in the brain is short enough to allow the effective diffusion of bulky biopharmaceutical compounds.37 Therefore, the secretory capacity of BCECs could be used in the design of a therapeutic strategy for CNS pathologies in which BCECs would serve as launching platforms.38 This strategy could result in a quantitatively effective delivery of therapeutics throughout the brain parenchyma. Moreover, BCECs themselves have been proposed as playing a critical role in neurodegenerative diseases or displaying pathological abnormalities39 that could be treated by directly targeting BCECs.40
In conclusion, our results show that Ri7-decorated Qdots can be targeted into BCECs in vivo, leading to their intracellular accumulation into endosomes of the late endocytic pathway. In vitro experiments confirmed that the interaction between Ri7-Qdots and membrane-bound TfR was essential to their intracellular incorporation. On the one hand, the biodistribution of Ri7-Qdots opens the door to the therapeutic targeting of BCECs, a type of cells involved in a wide range of CNS diseases. On the other hand, the high number of Ri7-Qdots found hours after their systemic administration strongly indicate that therapeutically relevant concentrations of conjugates could be transported inside BCECs via this approach. Overall, our data indicate that anti-TfR mAb Ri7 are suitable vectors for brain endothelial cell drug delivery.
Supplementary Material
Acknowledgments
The authors thank Dr Richard Poulin for critical comments on the manuscript and Marie-France Champigny, Marie-Pier Laplante-Campbell for expert technical assistance.
Funding
The author(s) disclosed receipt of the following financial support for the research, authorship, and/or publication of this article:
This work was supported by grants from the Canadian Institutes of Health Research (CIHR) (FC—MOP84251, MP—MOP246453), the Alzheimer Society Canada (FC—ASC 0516), and the Canada Foundation for Innovation (10307). The work of FC was supported by a New Investigator Award from the Clinical Research Initiative and the CIHR Institute of Aging (CAN76833).
Declaration of conflicting interests
The author(s) declared no potential conflicts of interest with respect to the research, authorship, and/or publication of this article.
Authors’ contributions
FC designed research; SPR, DB, and VE performed research; SPR, DB, VE, MP, and FC analyzed data; SPR, VE, MP, and FC wrote the paper.
Supplementary material
Supplementary material for this paper can be found at http://jcbfm.sagepub.com/content/by/supplemental-data
References
- 1.Watts RJ, Dennis MS. Bispecific antibodies for delivery into the brain. Curr Opin Chem Biol 2013; 17: 393–399. [DOI] [PubMed] [Google Scholar]
- 2.Neuwelt E, Abbott NJ, Abrey L, et al. Strategies to advance translational research into brain barriers. Lancet Neurol 2008; 7: 84–96. [DOI] [PubMed] [Google Scholar]
- 3.Oldendorf WH. The blood-brain barrier. Exp Eye Res 1977; 25: 177–190. [DOI] [PubMed] [Google Scholar]
- 4.Broadwell RD. Transcytosis of macromolecules through the blood-brain barrier: a cell biological perspective and critical appraisal. Acta Neuropathol 1989; 79: 117–128. [DOI] [PubMed] [Google Scholar]
- 5.Cornford EM, Cornford ME. New systems for delivery of drugs to the brain in neurological disease. Lancet Neurol 2002; 1: 306–315. [DOI] [PubMed] [Google Scholar]
- 6.Ulbrich K, Hekmatara T, Herbert E, et al. Transferrin- and transferrin-receptor-antibody-modified nanoparticles enable drug delivery across the blood-brain barrier (BBB). Eur J Pharm Biopharm 2009; 71: 251–256. [DOI] [PubMed] [Google Scholar]
- 7.Zhang Y, Calon F, Zhu C, et al. Intravenous nonviral gene therapy causes normalization of striatal tyrosine hydroxylase and reversal of motor impairment in experimental parkinsonism. Hum Gene Ther 2003; 14: 1–12. [DOI] [PubMed] [Google Scholar]
- 8.Ulbrich K, Knobloch T, Kreuter J. Targeting the insulin receptor: nanoparticles for drug delivery across the blood-brain barrier (BBB). J Drug Target 2011; 19: 125–132. [DOI] [PubMed] [Google Scholar]
- 9.Demeule M, Currie J-C, Bertrand Y, et al. Involvement of the low-density lipoprotein receptor-related protein in the transcytosis of the brain delivery vector angiopep-2. J Neurochem 2008; 106: 1534–1544. [DOI] [PubMed] [Google Scholar]
- 10.Friden PM, Walus LR, Musso GF, et al. Anti-transferrin receptor antibody and antibody-drug conjugates cross the blood-brain barrier. Proc Natl Acad Sci USA 1991; 88: 4771–4775. [DOI] [PMC free article] [PubMed] [Google Scholar]
- 11.Gosk S, Vermehren C, Storm G, et al. Targeting anti-transferrin receptor antibody (OX26) and OX26-conjugated liposomes to brain capillary endothelial cells using in situ perfusion. J Cerebral Blood Flow Metab 2004; 24: 1193–1204. [DOI] [PubMed] [Google Scholar]
- 12.Paris-Robidas S, Emond V, Tremblay C, et al. In vivo labeling of brain capillary endothelial cells after intravenous injection of monoclonal antibodies targeting the transferrin receptor. Mol Pharmacol 2011; 80: 32–39. [DOI] [PubMed] [Google Scholar]
- 13.Moos T, Rosengren Nielsen T, Skjørringe T, et al. Iron trafficking inside the brain. J Neurochem 2007; 103: 1730–1740. [DOI] [PubMed] [Google Scholar]
- 14.Roberts RL, Fine RE, Sandra A. Receptor-mediated endocytosis of transferrin at the blood-brain barrier. J Cell Sci 1993; 104: 521–532. [DOI] [PubMed] [Google Scholar]
- 15.Atwal JK, Chen Y, Chiu C, et al. A therapeutic antibody targeting BACE1 inhibits amyloid-β production in vivo. Sci Transl Med 2011; 3: 84ra43. [DOI] [PubMed] [Google Scholar]
- 16.Gabathuler R. Approaches to transport therapeutic drugs across the blood-brain barrier to treat brain diseases. Neurobiol Dis 2010; 37: 48–57. [DOI] [PubMed] [Google Scholar]
- 17.Giepmans BNG, Deerinck TJ, Smarr BL, et al. Correlated light and electron microscopic imaging of multiple endogenous proteins using Quantum dots. Nat Methods 2005; 2: 743–749. [DOI] [PubMed] [Google Scholar]
- 18.Parent M, Wallman M-J, Descarries L. Distribution and ultrastructural features of the serotonin innervation in rat and squirrel monkey subthalamic nucleus. Eur J Neurosci 2010; 31: 1233–1242. [DOI] [PubMed] [Google Scholar]
- 19.Kato S, Itoh K, Yaoi T, et al. Organ distribution of quantum dots after intraperitoneal administration, with special reference to area-specific distribution in the brain. Nanotechnology 2010; 21: 335103. [DOI] [PubMed] [Google Scholar]
- 20.Wang T, Hsieh H, Hsieh Y, et al. The in vivo biodistribution and fate of CdSe quantum dots in the murine model: a laser ablation inductively coupled plasma mass spectrometry study. Anal Bioanal Chem 2012; 404: 3025–3036. [DOI] [PubMed] [Google Scholar]
- 21.Wu D, Clement JG, Pardridge WM. Low blood-brain barrier permeability to azidothymidine (AZT), 3TC, and thymidine in the rat. Brain Res 1998; 791: 313–316. [DOI] [PubMed] [Google Scholar]
- 22.Skarlatos S, Yoshikawa T, Pardridge WM. Transport of [125I]transferrin through the rat blood-brain barrier. Brain Res 1995; 683: 164–171. [DOI] [PubMed] [Google Scholar]
- 23.Wu D, Kang YS, Bickel U, et al. Blood-brain barrier permeability to morphine-6-glucuronide is markedly reduced compared with morphine. Drug Metab Dispos 1997; 25: 768–771. [PubMed] [Google Scholar]
- 24.Kalvass JC, Maurer TS, Pollack GM. Use of plasma and brain unbound fractions to assess the extent of brain distribution of 34 drugs: comparison of unbound concentration ratios to in vivo p-glycoprotein efflux ratios. Drug Metab Dispos 2007; 35: 660–666. [DOI] [PubMed] [Google Scholar]
- 25.Moos T, Morgan EH. Restricted transport of anti-transferrin receptor antibody (OX26) through the blood-brain barrier in the rat. J Neurochem 2001; 79: 119–129. [DOI] [PubMed] [Google Scholar]
- 26.Stahl PD, Barbieri MA. Multivesicular bodies and multivesicular endosomes: the ‘ins and outs’ of endosomal traffic. Sci STKE 2002; 2002: pe32. [DOI] [PubMed] [Google Scholar]
- 27.Aisen P. Transferrin receptor 1. Int J Biochem Cell Biol 2004; 36: 2137–2143. [DOI] [PubMed] [Google Scholar]
- 28.Felber AE, Castagner B, Elsabahy M, et al. siRNA nanocarriers based on methacrylic acid copolymers. J Control Release 2011; 152: 159–167. [DOI] [PubMed] [Google Scholar]
- 29.Harding C, Heuser J, Stahl P. Receptor-mediated endocytosis of transferrin and recycling of the transferrin receptor in rat reticulocytes. J Cell Biol 1983; 97: 329–339. [DOI] [PMC free article] [PubMed] [Google Scholar]
- 30.Harding C, Heuser J, Stahl P. Endocytosis and intracellular processing of transferrin and colloidal gold-transferrin in rat reticulocytes: demonstration of a pathway for receptor shedding. Eur J Cell Biol 1984; 35: 256–263. [PubMed] [Google Scholar]
- 31.Giometto B, Bozza F, Argentiero V, et al. Transferrin receptors in rat central nervous system. An immunocytochemical study. J Neurol Sci 1990; 98: 81–90. [DOI] [PubMed] [Google Scholar]
- 32.Orita T, Akimura T, Nishizaki T, et al. Transferrin receptors in injured brain. Acta Neuropathol 1990; 79: 686–688. [DOI] [PubMed] [Google Scholar]
- 33.Bickel U, Kang YS, Yoshikawa T, et al. In vivo demonstration of subcellular localization of anti-transferrin receptor monoclonal antibody-colloidal gold conjugate in brain capillary endothelium. J Histochem Cytochem 1994; 42: 1493–1497. [DOI] [PubMed] [Google Scholar]
- 34.Wiley DT, Webster P, Gale A, et al. Transcytosis and brain uptake of transferrin-containing nanoparticles by tuning avidity to transferrin receptor. Proc Natl Acad Sci USA 2013; 110: 8662–8667. [DOI] [PMC free article] [PubMed] [Google Scholar]
- 35.Bjorn MJ, Groetsema G. Immunotoxins to the murine transferrin receptor: intracavitary therapy of mice bearing syngeneic peritoneal tumors. Cancer Res 1987; 47: 6639–6645. [PubMed] [Google Scholar]
- 36.Yu YJ, Zhang Y, Kenrick M, et al. Boosting brain uptake of a therapeutic antibody by reducing its affinity for a transcytosis target. Sci Transl Med 2011; 3: 84ra44. [DOI] [PubMed] [Google Scholar]
- 37.Pardridge WM. Brain drug development and brain drug targeting. Pharm Res 2007; 24: 1729–1732. [DOI] [PubMed] [Google Scholar]
- 38.Jiang C, Koyabu N, Yonemitsu Y, et al. In vivo delivery of glial cell-derived neurotrophic factor across the blood-brain barrier by gene transfer into brain capillary endothelial cells. Hum Gene Ther 2003; 14: 1181–1191. [DOI] [PubMed] [Google Scholar]
- 39.Persidsky Y, Ramirez SH, Haorah J, et al. Blood-brain barrier: structural components and function under physiologic and pathologic conditions. J Neuroimmune Pharmacol 2006; 1: 223–236. [DOI] [PubMed] [Google Scholar]
- 40.Kuwahara H, Nishina K, Yoshida K, et al. Efficient in vivo delivery of siRNA into brain capillary endothelial cells along with endogenous lipoprotein. Mol Ther 2011; 19: 2213–2221. [DOI] [PMC free article] [PubMed] [Google Scholar]
Associated Data
This section collects any data citations, data availability statements, or supplementary materials included in this article.