Women with anorexia nervosa (AN) have higher fat attenuation than normal-weight women, and visceral adipose tissue attenuation but not cross-sectional area is inversely associated with lowest lifetime body mass index, which suggests that fat attenuation may serve as a biomarker of prior and current disease status in AN.
Abstract
Purpose
To investigate the composition, cross-sectional area (CSA), and hormonal correlates of different fat depots in women with anorexia nervosa (AN) and control subjects with normal weights to find out whether patients with AN have lower fat CSA but higher attenuation than did control subjects and whether these changes may be mediated by gonadal steroids, cortisol, and thyroid hormones.
Materials and Methods
This study was institutional review board approved and HIPAA compliant. Written informed consent was obtained. Forty premenopausal women with AN and 40 normal-weight women of comparable age (mean age ± standard deviation, 26 years ± 5) were studied. All individuals underwent computed tomography of the abdomen and thigh with a calibration phantom. Abdominal subcutaneous adipose tissue (SAT), visceral adipose tissue (VAT), thigh SAT, and thigh intermuscular adipose tissue CSA and attenuation were quantified. Serum estradiol, thyroid hormones, and urinary free cortisol levels were assessed. Variables were compared by using analysis of variance. Associations were examined by using linear regression analysis.
Results
Women with AN had higher fat attenuation than did control subjects (−100.1 to −46.7 HU vs −117.6 to −61.8 HU, P < .0001), despite lower fat CSA (2.0–62.8 cm2 vs 5.5–185.9 cm2, P < .0001). VAT attenuation but not CSA was inversely associated with lowest prior lifetime body mass index in AN (r = −0.71, P = .006). Serum estradiol levels were inversely associated with fat attenuation (r = −0.34 to −0.61, P = .03 to <.0001) and were positively associated with fat CSA of all compartments (r = 0.42–0.64, P = .007 to <.0001). Thyroxine levels and urinary free cortisol levels were positively associated with thigh SAT attenuation (r = 0.64 [P = .006] and r = 0.68 [P = .0004], respectively) and were inversely associated with abdominal SAT and VAT CSA (r = −0.44 to −0.58, P = .04 to .02).
Conclusion
Women with AN have differences in fat composition, with higher fat attenuation than that of control subjects, as well as low fat mass. VAT attenuation but not CSA is inversely associated with lowest prior lifetime body mass index, suggesting that fat attenuation may serve as a biomarker of prior and current disease status in AN.
© RSNA, 2015
Introduction
Patients with anorexia nervosa (AN) have a low body mass index (BMI) and low body fat mass, and both are positive predictors of morbidity and relapse after recovery in this population (1,2). Body fat distribution can be accurately assessed by using computed tomography (CT) (3). Tissue attenuation assessed with CT by using Hounsfield units represents an indirect measure of tissue quality and composition. Adipose tissue with lower attenuation reflects higher lipid content and larger adipocytes, while higher attenuation is associated with lower lipid content, smaller adipocytes, and markers of systemic fibrosis (4,5). Recent studies regarding the quality of subcutaneous and visceral fat have been focused on cardiovascular risk and mortality prediction. In those studies, low fat attenuation was seen in obese subjects and correlated with increased cardiovascular risk (4–7).
Studies in cancer-related weight loss and cachexia have shown that weight loss is associated with decreased adipocyte lipid content and volume and increased fibrosis of the extracellular matrix (8). Furthermore, gene expression profiles for abdominal subcutaneous adipose tissue (SAT) in patients with cancer cachexia suggest that genes that regulate energy turnover, cytoskeleton, and extracellular matrix may be responsible for loss of adipose tissue in this population (8). This implies that the composition of adipose tissue and extracellular matrix may play a role in the detrimental body composition changes associated with cachexia.
Patients with AN have low fat mass, but there are no data on fat composition, relative fat distribution, and potential hormonal determinants in this population, to our knowledge. Endocrine abnormalities in AN include hypogonadism, hypercortisolemia, and thyroid axis dysregulation, all of which may influence fat mass and fat distribution (9). Although accumulation of visceral adipose tissue (VAT) and intermuscular adipose tissue (IMAT) is associated with increased cardiometabolic risk, SAT is relatively protective. No studies have been performed to investigate composition of these fat compartments by using CT and hormonal correlates. Given the detrimental changes in fat and extracellular matrix composition in cachexia, noninvasive assessment of fat composition may serve as an indicator of disease severity in AN. The purpose of our study was therefore to investigate composition and cross-sectional areas (CSAs), as well as hormonal correlates of different fat depots in women with AN and normal-weight control subjects. We hypothesized that patients with AN have lower fat CSA but higher attenuation than normal-weight control subjects and that these changes may be mediated by gonadal steroids, cortisol, and thyroid hormones.
Materials and Methods
The study was institutional review board approved and was Health Insurance Portability and Accountability Act compliant. This was a retrospective review of prospectively acquired data. Data were acquired after written informed consent was obtained from all individuals prior to the study.
Study Population
We studied a total of 80 premenopausal women—40 women with AN and 40 women of normal weight and of comparable age—who were participants in different clinical trials. Patients with AN were referred by eating disorder care providers or were recruited through advertisements, and normal-weight control subjects were recruited through advertisements. Inclusion criteria for all groups were age of 18–45 years and female sex. All participants were non-Hispanic white. Patients with AN met the weight and psychiatric criteria in the fourth edition of the Diagnostic and Statistical Manual of Mental Disorders. The normal-weight subjects had a BMI of at least 19 kg/m2 and less than 25 kg/m2, were healthy, and had regular menses and no history of amenorrhea or an eating disorder. None of the patients with AN or normal-weight control subjects were taking estrogen or oral contraceptives. Exclusion criteria for both groups included pregnancy and presence of a chronic disease (other than AN). None of the individuals screened for participation were excluded on the basis of pregnancy or presence of chronic disease other than AN. Clinical characteristics have been reported previously in a subset of study subjects (27 patients with AN and 19 normal-weight control subjects); however, none have been reported in the entire cohort, and no data on fat attenuation have been described (3,10,11).
CT Examination
Each participant underwent CT of the abdomen and thigh by using a 16–detector row scanner (LightSpeedPro; General Electric, Waukesha, Wis). Single-section CT of the abdomen at the level of the fourth lumbar vertebra (L4) and the left midthigh was performed. Patients were placed supine in the CT scanner on a calibration phantom (Mindways Software, Austin, Tex), and lateral and frontal scout images were obtained. Scanning parameters were standardized: 144-mm table height, 80 kV and 70 mA for the abdomen, 120 kV and 170 mA for the thigh, scanning time of 2 seconds, 1-cm section thickness, and 48-cm field of view. Thresholding methods were applied to identify adipose tissue by using a threshold set for −50 to −250 HU as described by Borkan et al (12). Manual delineation was used to separate SAT, VAT, and IMAT. CSAs (in square centimeters) were obtained, along with mean attenuation (in Hounsfield units) of abdominal and thigh SAT, VAT, and IMAT CSAs. The relative distribution of body fat in the abdomen and thigh was assessed by using VAT/SAT and IMAT/SAT ratios, respectively. Analyses were performed by using Osirix software version 3.2.1 (www.osirix-viewer.com/index.html).
Endocrine Testing
Estradiol levels were measured in 23 patients with AN and 18 normal-weight control subjects by using a chemiluminescent microparticle immunoassay kit from Architect (Abbot Laboratories, Abbot Park, Ill). Urinary free cortisol levels were measured over 24 hours in 22 patients with AN by using published methods (13) in the hospital laboratory. Thyroid-stimulating hormone levels were measured in 13 patients with AN and 21 normal-weight control subjects by means of electrochemiluminescence immunoassay, and total thyroxine levels were measured in 17 patients with AN by means of cloned enzyme donor immunoassay. The endocrine testing was performed in accordance with the clinical protocols in which the individuals were participating. Clinical characteristics and body composition did not differ between participants with and those without hormonal testing (P = .5–.8).
Statistical Analysis
Statistical analysis was performed by using JMP software (version 11; SAS Institute, Cary, NC). Variables were compared by using analysis of variance. Associations were examined by using linear regression analysis. Data were adjusted for disease status, BMI, and fat CSA by using multivariate standard least-squares regression modeling. The variance inflation factor was used to rule out collinearity among the terms in the model. High variance inflation factors indicate collinearity. In our models, the variance inflation factor was less than two. Means and standard deviations are reported. A P value less than .05 was used to denote a significant difference.
Results
Clinical Characteristics and Body Composition of Study Participants
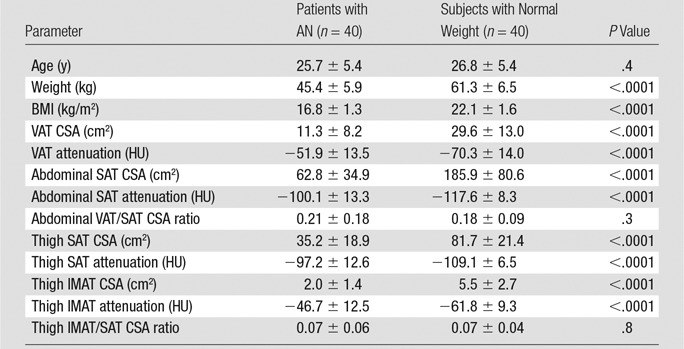
Individual characteristics and body composition, including fat CSA and attenuation of the AN and normal-weight groups, are shown in Table 1. Study participants ranged from 19 to 42 years of age (mean age ± standard deviation, 26 years ± 5) with a BMI of 13.3–24.9 kg/m2 (mean BMI, 19.4 kg/m2 ± 3.0). Patients with AN had lower serum estradiol levels than did normal-weight control subjects (26.3 pg/mL ± 22.9 [96.5 pmol/L ± 84.1] vs 71.0 pg/mL ± 59.0 [260.6 pmol/L ± 216.6], P = .001). There was no significant difference in thyroid-stimulating hormone levels between the groups (P = .5). The mean thyroxine levels were low in patients with AN (mean thyroxine levels, 3.5 μg/dL ± 2.9 [45.0 nmol/L ± 37.3]; normal range, 4.5–10.9 μg/dL [57.9–140.3 nmol/L]).
Table 1.
Clinical Characteristics and Body Composition of Study Participants
Note.—Values are means ± standard deviations, unless indicated otherwise.
As expected, women with AN had lower abdominal and thigh fat CSA than did normal-weight control subjects (P < .0001) (Fig 1). There was no significant difference in relative fat distribution of the abdomen (VAT/SAT ratio) and thigh (IMAT/SAT ratio) between the groups (P = .3 and P = .8, respectively).
Figure 1a:
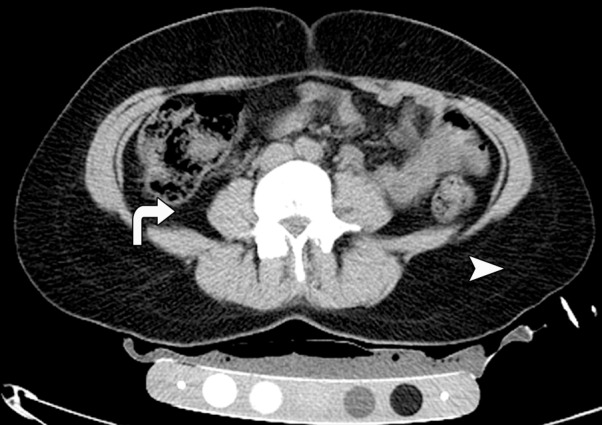
CT images in the (a) abdomen and (b) thigh in a 35-year-old woman with normal weight (BMI, 24 kg/m2) and CT images in the (c) abdomen and (d) thigh in a 34-year-old woman with AN (BMI, 18 kg/m2) demonstrate markedly reduced VAT (arrows), abdominal and thigh SAT (arrowheads), and IMAT (arrows) CSAs, as well as increased attenuation in the woman with AN compared with the normal-weight subject. All images are presented by using the same window and level.
Figure 1b:
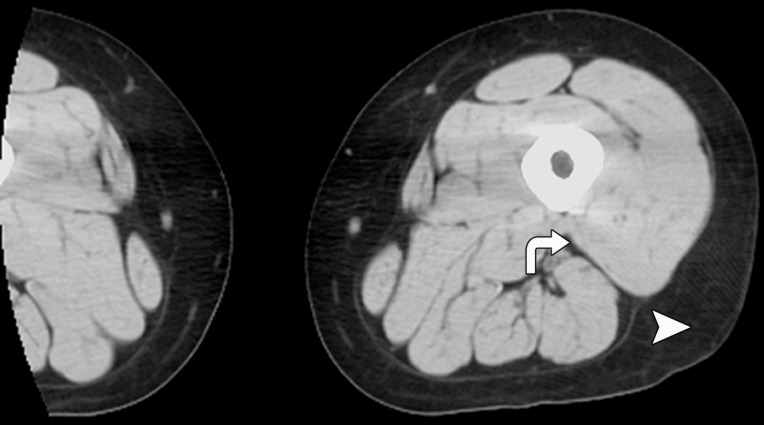
CT images in the (a) abdomen and (b) thigh in a 35-year-old woman with normal weight (BMI, 24 kg/m2) and CT images in the (c) abdomen and (d) thigh in a 34-year-old woman with AN (BMI, 18 kg/m2) demonstrate markedly reduced VAT (arrows), abdominal and thigh SAT (arrowheads), and IMAT (arrows) CSAs, as well as increased attenuation in the woman with AN compared with the normal-weight subject. All images are presented by using the same window and level.
Figure 1c:
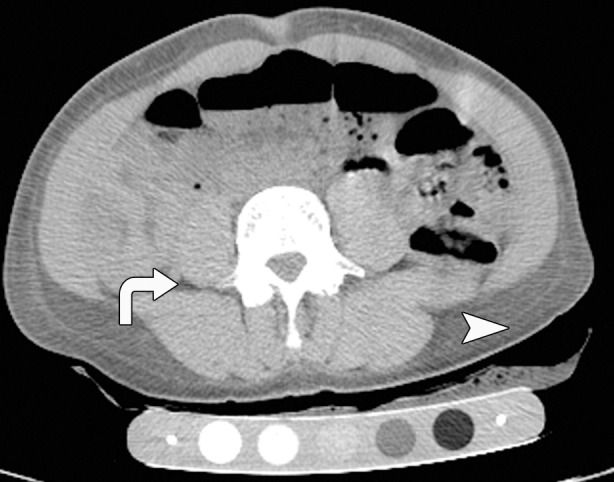
CT images in the (a) abdomen and (b) thigh in a 35-year-old woman with normal weight (BMI, 24 kg/m2) and CT images in the (c) abdomen and (d) thigh in a 34-year-old woman with AN (BMI, 18 kg/m2) demonstrate markedly reduced VAT (arrows), abdominal and thigh SAT (arrowheads), and IMAT (arrows) CSAs, as well as increased attenuation in the woman with AN compared with the normal-weight subject. All images are presented by using the same window and level.
Figure 1d:
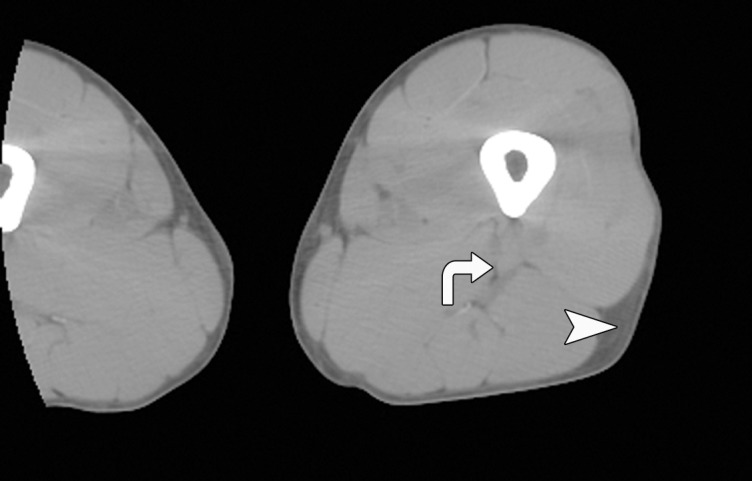
CT images in the (a) abdomen and (b) thigh in a 35-year-old woman with normal weight (BMI, 24 kg/m2) and CT images in the (c) abdomen and (d) thigh in a 34-year-old woman with AN (BMI, 18 kg/m2) demonstrate markedly reduced VAT (arrows), abdominal and thigh SAT (arrowheads), and IMAT (arrows) CSAs, as well as increased attenuation in the woman with AN compared with the normal-weight subject. All images are presented by using the same window and level.
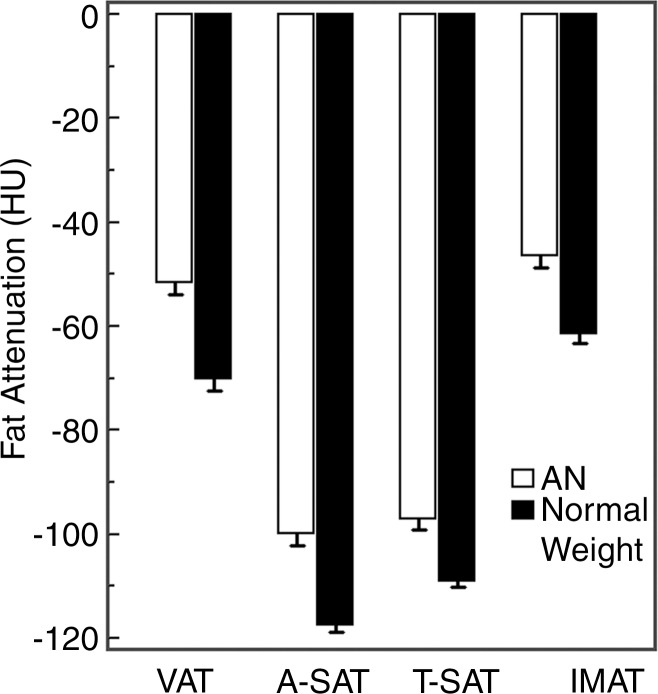
Attenuation of all fat compartments was higher in patients with AN than in normal-weight control subjects (Figs 1, 2). After controlling for abdominal SAT CSA, the difference in abdominal SAT attenuation between the patients with AN and the normal-weight group remained significant (P = .003), suggesting that fat attenuation provides information on fat composition that is independent of fat CSA.
Figure 2:
Graph of the attenuation of VAT, abdominal SAT (A-SAT), thigh SAT (T-SAT), and IMAT in women with AN and women with normal weight. There was a significant difference between fat attenuation in all compartments in the AN and normal-weight groups (P < .0001), with patients with AN having higher fat attenuation.
Fat attenuation of all compartments in the abdomen and thigh was inversely associated with BMI (r = −0.59 to −0.66, P < .0001 for all correlations). The inverse association between BMI and fat attenuation of all compartments remained significant after controlling for disease status (AN vs normal weight) (P = .03 to .0004). Fat attenuation was inversely associated with fat CSA of all compartments (r = −0.69 to r = −0.82, P < .0001 for all correlations).
VAT attenuation was inversely associated with lowest reported lifetime BMI in AN (r = −0.71, P = .006), while there was no association between fat CSA and lowest lifetime BMI (P = .1–.6).
There was a significant difference between the attenuation of all fat compartments in the normal-weight group. The lowest attenuation was seen in abdominal SAT, followed by thigh SAT and VAT, with IMAT having the highest attenuation (P < .02) (Table 1). Similar findings were seen in the AN group; however, there was no significant difference in abdominal and thigh SAT (P = .8).
Hormonal Correlates of Fat Attenuation and CSA
Associations between hormones and fat attenuation and CSA are shown in Table 2.
Table 2.
Associations of Hormones, Fat CSAs, and Fat Attenuation
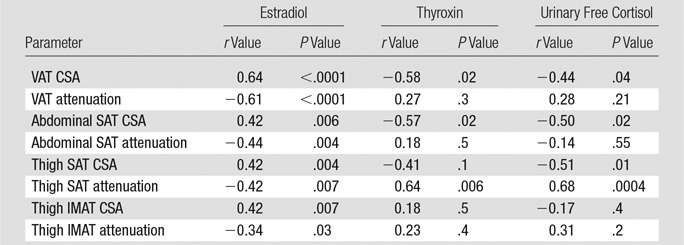
Estradiol levels were inversely associated with fat attenuation of all compartments and were positively associated with fat CSA of all compartments. After controlling for BMI, the inverse association between estradiol and VAT attenuation remained significant (P = .003), while the remaining associations lost significance (P = .2–.7).
Thyroxine levels were inversely associated with VAT and abdominal SAT CSA and were positively associated with thigh SAT attenuation.
Urinary free cortisol levels were inversely associated with VAT, abdominal SAT, and thigh SAT CSA and were positively associated with thigh SAT attenuation. However, the inverse associations between cortisol and fat CSA lost significance after controlling for BMI (P = .1 to .2), suggesting that the thinnest women with AN are most stressed and have the highest cortisol levels. However, the positive association between cortisol levels and SAT attenuation remained significant after controlling for BMI (P = .009), suggesting that cortisol is involved in the regulation of fat composition.
There were no associations between hormones and lowest prior lifetime BMI (P = .2–.5).
Discussion
Our study shows that women with AN have higher fat attenuation and lower fat CSA than did normal-weight control subjects. VAT attenuation but not CSA is inversely associated with lowest lifetime BMI, suggesting that fat attenuation assessed by using CT may serve as a biomarker of current and prior disease status in AN. Our data also suggest that adipocyte and extracellular matrix composition in AN may be modulated in part by gonadal steroids, cortisol, and thyroid hormones.
Patients with AN have a known paucity of body fat, but there are only a few studies on the detailed assessment of abdominal and thigh fat compartments by using cross-sectional imaging (3,14,15) and none on the relative distribution of abdominal and thigh fat. In our study, women with AN had lower fat CSA of all fat compartments compared with normal-weight control subjects, although there was no significant difference in the distribution of abdominal (VAT/SAT ratio) fat and thigh (IMAT/thigh SAT ratio) fat. Interestingly, patients with AN and acute weight restoration have been shown to preferentially accumulate VAT and IMAT (15). Our study shows that in states of low body weight, there are no differences in relative fat distribution between patients with AN and normal-weight control subjects.
Recent studies have shown that the quality of fat may be a marker of cardiometabolic risk and mortality, independent of fat volumes (4,5). The attenuation of fat as assessed with CT reflects the biochemical composition of tissue, with lower attenuation (ie, more negative numbers) corresponding to larger adipocytes and increased fat content, while higher attenuation (ie, more positive numbers) corresponding to lower lipid content and smaller adipocytes (4). However, the data on fat attenuation and mortality and cardiovascular risk are conflicting. An increased cardiometabolic risk was found to be associated with low CT fat attenuation, independent of BMI (6). Paradoxically, in the same cohort and in two additional large cohorts, increased fat attenuation was a positive predictor of mortality (4,5). A potential explanation for these apparently conflicting findings is that although lower fat attenuation may reflect larger adipocytes and increased cardiovascular risk in individuals with visceral adiposity, increased extracellular matrix fibrosis that corresponds to high-attenuation fat tissue may be present in ill patients who have experienced substantial weight loss. In fact, higher levels of markers of systemic fibrosis were associated with an increase in SAT attenuation, linking higher fat attenuation with an increased risk for mortality (5). Furthermore, studies in cancer-related weight loss and cachexia have shown that weight loss is associated with a decrease in adipocyte lipid content and volume but not number, as well as adipose tissue remodeling with up-regulation of genes modulating energy turnover and down-regulation of genes related to cellular adhesion, extracellular matrix, and cytoskeleton (8,16). Interestingly, these changes are reciprocal to those observed in obesity and are similar to changes seen after weight loss in obesity (17,18), which provides a possible explanation for the increased cardiometabolic risk with low-attenuation fat and the increased mortality with high-attenuation fat (4,5,7). In our study, women with AN had significantly higher fat attenuation compared with normal-weight control subjects, and this was in part independent of fat CSA, suggesting that fat attenuation may provide information on fat composition that is independent of fat quantity. VAT attenuation but not fat CSA or hormones was inversely associated with lowest lifetime BMI in AN. Low BMI is associated with serious medical complications in AN (2). Our data suggest that VAT attenuation may serve as a biomarker of prior and current disease status in AN.
In prior studies on CT attenuation of fat, investigators only evaluated abdominal SAT and VAT attenuation. While accumulation of VAT and IMAT is associated with increased cardiometabolic risk, SAT, especially thigh SAT, is relatively protective (19–21). We therefore examined CSA and attenuation of abdominal and thigh fat depots to determine the relative distribution and composition of these depots in a group of premenopausal women with AN and those of normal weight. We found a significant difference between the attenuation of different fat compartments, with abdominal and thigh SAT having lower attenuation and VAT and IMAT having higher attenuation. These findings suggest that fat compartments that are associated with adverse cardiometabolic risk have increased fat attenuation compared with compartments associated with a more protective cardiometabolic profile, thereby providing information on metabolic activity of different fat depots.
No data on hormonal correlates of fat attenuation have been published, to our knowledge. We found inverse associations between estradiol levels and abdominal and thigh fat attenuation and positive associations with fat CSA. Estrogen plays an important role in modulating body composition (22,23). Our findings of a BMI-independent inverse association between estradiol and fat attenuation suggest that estrogen may also be involved in modulation of fat composition in AN.
Urinary free cortisol levels were positively associated with thigh fat attenuation in our study. Cortisol is an important modulator of body composition, and increased cortisol levels, as seen in Cushing syndrome, are associated with visceral fat accumulation and wasting of peripheral SAT (24,25). In our study, urinary free cortisol levels were inversely associated with VAT and SAT CSA; however, the association lost significance after controlling for BMI, which suggests that the thinnest women with AN are the most stressed and have the highest cortisol levels. However, our observed positive correlation between fat attenuation and cortisol levels was independent of BMI. A study in women with Cushing syndrome and women who were taking long-term corticosteroids and who were undergoing fat biopsies showed smaller adipocytes in the gluteal region compared with those in control subjects (26). Smaller adipocytes in monkeys have been found to be associated with increased fat attenuation at CT (4), which provides a possible explanation for the strong positive correlation between urinary free cortisol levels and fat attenuation in our study. Our results also suggest that fat attenuation provides information that is independent of fat CSA.
A recent study demonstrated that hypothyroidism in mice prevents accumulation of fat within the liver but leads to altered hepatic fatty acid composition and glycogen accumulation (27). In our study, patients with AN had normal thyroid-stimulating hormone levels but mildly decreased thyroxine levels. Our observed association between thyroxine levels and fat attenuation suggests that thyroid hormones may be associated with altered lipid composition in AN.
Our study had several limitations. First, the cross-sectional design limits our ability to determine causality. Second, we did not perform biopsies of adipose tissue to assess adipocyte and extracellular matrix composition. Third, hormonal data were not available in all participants, because the individuals participated in different clinical protocols.
Strengths of our study include the large number of patients with AN and detailed quantification of abdominal and thigh fat compartments and attenuation, with hormonal correlates.
In conclusion, women with AN have higher fat attenuation than do normal-weight women. VAT attenuation but not CSA is inversely associated with lowest lifetime BMI, which suggests that fat attenuation may serve as a biomarker of prior and current disease status in AN. Adipocyte and extracellular matrix composition in AN may be modulated in part by gonadal steroids, cortisol, and thyroid hormones. Further interventional studies are needed to investigate this hypothesis and other potential mediators of fat attenuation.
Advances in Knowledge
■ Visceral adipose tissue attenuation but not cross-sectional area is inversely associated with lowest prior lifetime body mass index, suggesting that fat attenuation may serve as a biomarker of current and prior disease status in anorexia nervosa (AN).
■ Women with AN have not only lower fat mass but also differences in fat composition, with higher fat attenuation than that of normal-weight control subjects.
■ Adipocyte and extracellular matrix composition may be modulated in part by gonadal steroids, cortisol, and thyroid hormones.
Implication for Patient Care
■ Fat attenuation assessed by using CT may serve as a novel biomarker of current and prior disease status in AN.
Received May 19, 2015; revision requested June 24; revision received July 16; accepted July 30; final version accepted August 18.
Funding: This research was supported by the National Institutes of Health (grants R01 MH083657, R01 DK052625, R03 DK59297, M01 RR01066, UL1 RR025758, T32 DK 007028, and K23 RR-23090).
Disclosures of Conflicts of Interest: C.M.G. disclosed no relevant relationships. M.T. disclosed no relevant relationships. R.M. disclosed no relevant relationships. T.B.H. disclosed no relevant relationships. K.K.M. disclosed no relevant relationships. A.K. disclosed no relevant relationships. M.A.B. disclosed no relevant relationships.
Abbreviations:
- AN
- anorexia nervosa
- BMI
- body mass index
- CSA
- cross-sectional area
- IMAT
- intermuscular adipose tissue
- SAT
- subcutaneous adipose tissue
- VAT
- visceral adipose tissue
References
- 1.Bodell LP, Mayer LE. Percent body fat is a risk factor for relapse in anorexia nervosa: a replication study. Int J Eat Disord 2011;44(2):118–123. [DOI] [PMC free article] [PubMed] [Google Scholar]
- 2.Kawai K, Yamashita S, Yamanaka T, et al. The longitudinal BMI pattern and body composition of patients with anorexia nervosa who require urgent hospitalization: a case control study. Biopsychosoc Med 2011;5:14. [DOI] [PMC free article] [PubMed] [Google Scholar]
- 3.Bredella MA, Ghomi RH, Thomas BJ, et al. Comparison of DXA and CT in the assessment of body composition in premenopausal women with obesity and anorexia nervosa. Obesity (Silver Spring) 2010;18:2227–2233. [DOI] [PMC free article] [PubMed] [Google Scholar]
- 4.Murphy RA, Register TC, Shively CA, et al. Adipose tissue density, a novel biomarker predicting mortality risk in older adults. J Gerontol A Biol Sci Med Sci 2014;69(1):109–117. [DOI] [PMC free article] [PubMed] [Google Scholar]
- 5.Rosenquist KJ, Massaro JM, Pedley A, et al. Fat quality and incident cardiovascular disease, all-cause mortality, and cancer mortality. J Clin Endocrinol Metab 2015;100(1):227–234. [DOI] [PMC free article] [PubMed] [Google Scholar]
- 6.Rosenquist KJ, Pedley A, Massaro JM, et al. Visceral and subcutaneous fat quality and cardiometabolic risk. JACC Cardiovasc Imaging 2013;6(7):762–771. [DOI] [PMC free article] [PubMed] [Google Scholar]
- 7.Torriani M, Oliveira AL, Azevedo DC, Bredella MA, Yu EW. Effects of Roux-en-Y gastric bypass surgery on visceral and subcutaneous fat density by computed tomography. Obes Surg 2015;25(2):381–385. [DOI] [PMC free article] [PubMed] [Google Scholar]
- 8.Dahlman I, Mejhert N, Linder K, et al. Adipose tissue pathways involved in weight loss of cancer cachexia. Br J Cancer 2010;102(10):1541–1548. [DOI] [PMC free article] [PubMed] [Google Scholar]
- 9.Miller KK. Endocrine effects of anorexia nervosa. Endocrinol Metab Clin North Am 2013;42(3):515–528. [DOI] [PMC free article] [PubMed] [Google Scholar]
- 10.Bredella MA, Gill CM, Keating LK, et al. Assessment of abdominal fat compartments using DXA in premenopausal women from anorexia nervosa to morbid obesity. Obesity (Silver Spring) 2013; 21:2458–2464. [DOI] [PMC free article] [PubMed] [Google Scholar]
- 11.Miller KK, Grieco KA, Klibanski A. Testosterone administration in women with anorexia nervosa. J Clin Endocrinol Metab 2005; 90:1428–1433. [DOI] [PubMed] [Google Scholar]
- 12.Borkan GA, Gerzof SG, Robbins AH, Hults DE, Silbert CK, Silbert JE. Assessment of abdominal fat content by computed tomography. Am J Clin Nutr 1982;36(1):172–177. [DOI] [PubMed] [Google Scholar]
- 13.Jordan C, Flood J, Laposata M, Lewandrowski K. Case records of the Massachusetts General Hospital. Weekly clinicopathological exercises. Normal reference laboratory values. N Engl J Med 1992;327(10):718–724. [DOI] [PubMed] [Google Scholar]
- 14.Mayer L, Walsh BT, Pierson RN, Jr, et al. Body fat redistribution after weight gain in women with anorexia nervosa. Am J Clin Nutr 2005;81(6):1286–1291. [DOI] [PubMed] [Google Scholar]
- 15.Mayer LE, Klein DA, Black E, et al. Adipose tissue distribution after weight restoration and weight maintenance in women with anorexia nervosa. Am J Clin Nutr 2009;90(5):1132–1137. [DOI] [PMC free article] [PubMed] [Google Scholar]
- 16.Bing C, Trayhurn P. New insights into adipose tissue atrophy in cancer cachexia. Proc Nutr Soc 2009;68(4):385–392. [DOI] [PubMed] [Google Scholar]
- 17.Dahlman I, Kaaman M, Olsson T, et al. A unique role of monocyte chemoattractant protein 1 among chemokines in adipose tissue of obese subjects. J Clin Endocrinol Metab 2005;90(10):5834–5840. [DOI] [PubMed] [Google Scholar]
- 18.Mutch DM, Tordjman J, Pelloux V, et al. Needle and surgical biopsy techniques differentially affect adipose tissue gene expression profiles. Am J Clin Nutr 2009;89(1):51–57. [DOI] [PubMed] [Google Scholar]
- 19.Fox CS, Massaro JM, Hoffmann U, et al. Abdominal visceral and subcutaneous adipose tissue compartments: association with metabolic risk factors in the Framingham Heart Study. Circulation 2007;116(1):39–48. [DOI] [PubMed] [Google Scholar]
- 20.Goodpaster BH, Theriault R, Watkins SC, Kelley DE. Intramuscular lipid content is increased in obesity and decreased by weight loss. Metabolism 2000;49(4):467–472. [DOI] [PubMed] [Google Scholar]
- 21.Snijder MB, Visser M, Dekker JM, et al. Low subcutaneous thigh fat is a risk factor for unfavourable glucose and lipid levels, independently of high abdominal fat. The Health ABC Study. Diabetologia 2005;48(2):301–308. [DOI] [PubMed] [Google Scholar]
- 22.Garaulet M, Pérex-Llamas F, Fuente T, Zamora S, Tebar FJ. Anthropometric, computed tomography and fat cell data in an obese population: relationship with insulin, leptin, tumor necrosis factor-alpha, sex hormone-binding globulin and sex hormones. Eur J Endocrinol 2000;143(5):657–666. [DOI] [PubMed] [Google Scholar]
- 23.Gavin KM, Cooper EE, Hickner RC. Estrogen receptor protein content is different in abdominal than gluteal subcutaneous adipose tissue of overweight-to-obese premenopausal women. Metabolism 2013;62(8):1180–1188. [DOI] [PubMed] [Google Scholar]
- 24.Geer EB, Shen W, Gallagher D, et al. MRI assessment of lean and adipose tissue distribution in female patients with Cushing’s disease. Clin Endocrinol (Oxf) 2010;73(4):469–475. [DOI] [PMC free article] [PubMed] [Google Scholar]
- 25.Rockall AG, Sohaib SA, Evans D, et al. Computed tomography assessment of fat distribution in male and female patients with Cushing’s syndrome. Eur J Endocrinol 2003;149(6):561–567. [DOI] [PubMed] [Google Scholar]
- 26.Krotkiewski M, Blohmé B, Lindholm N, Björntorp P. The effects of adrenal corticosteroids on regional adipocyte size in man. J Clin Endocrinol Metab 1976;42(1):91–97. [DOI] [PubMed] [Google Scholar]
- 27.Yao X, Hou S, Zhang D, et al. Regulation of fatty acid composition and lipid storage by thyroid hormone in mouse liver. Cell Biosci 2014;4:38. [DOI] [PMC free article] [PubMed] [Google Scholar]


