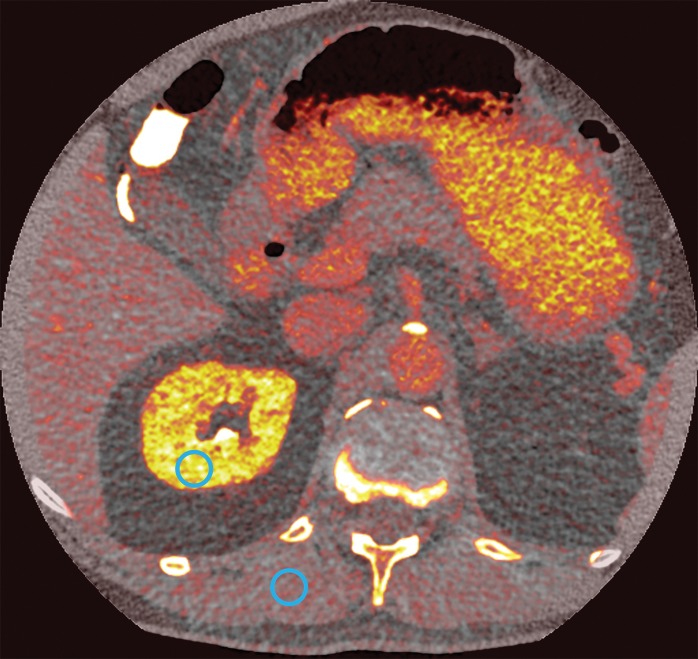
The photon-counting detector system showed equivalent performance to clinical energy-integrating detectors when the abdomen was evaluated in a conventional scanning mode with the added advantage of providing spectral information that may be used for material decomposition.
Abstract
Purpose
To evaluate the performance of a prototype photon-counting detector (PCD) computed tomography (CT) system for abdominal CT in humans and to compare the results with a conventional energy-integrating detector (EID).
Materials and Methods
The study was HIPAA-compliant and institutional review board–approved with informed consent. Fifteen asymptomatic volunteers (seven men; mean age, 58.2 years ± 9.8 [standard deviation]) were prospectively enrolled between September 2 and November 13, 2015. Radiation dose–matched delayed contrast agent–enhanced spiral and axial abdominal EID and PCD scans were acquired. Spiral images were scored for image quality (Wilcoxon signed-rank test) in five regions of interest by three radiologists blinded to the detector system, and the axial scans were used to assess Hounsfield unit accuracy in seven regions of interest (paired t test). Intraclass correlation coefficient (ICC) was used to assess reproducibility. PCD images were also used to calculate iodine concentration maps. Spatial resolution, noise-power spectrum, and Hounsfield unit accuracy of the systems were estimated by using a CT phantom.
Results
In both systems, scores were similar for image quality (median score, 4; P = .19), noise (median score, 3; P = .30), and artifact (median score, 1; P = .17), with good interrater agreement (image quality, noise, and artifact ICC: 0.84, 0.88, and 0.74, respectively). Hounsfield unit values, spatial resolution, and noise-power spectrum were also similar with the exception of mean Hounsfield unit value in the spinal canal, which was lower in the PCD than the EID images because of beam hardening (20 HU vs 36.5 HU; P < .001). Contrast-to-noise ratio of enhanced kidney tissue was improved with PCD iodine mapping compared with EID (5.2 ± 1.3 vs 4.0 ± 1.3; P < .001).
Conclusion
The performance of PCD showed no statistically significant difference compared with EID when the abdomen was evaluated in a conventional scan mode. PCD provides spectral information, which may be used for material decomposition.
© RSNA, 2016
Introduction
Commercially available computed tomography (CT) scanners use energy-integrating detectors (EIDs) to convert x-ray photon energy to an electrical signal. Photon-counting detectors (PCDs) use high-speed semiconductors to directly count individual photon interactions and eliminate the need for scintillator crystals, which limit spatial and temporal resolution of x-ray detection. PCDs may offer substantial benefits over conventional EIDs, such as reduced sensitivity to electronic noise, increased contrast-to-noise ratio, higher spatial resolution, better material decomposition, and higher dose efficiency, which lead to a decrease in radiation exposure (1). With PCDs, each x-ray photon interaction induces a pulse in the detector and the height of the pulse is proportional to the photon energy. This allows for simultaneous measurement of the energy and number of photons. PCD technology was demonstrated in breast tissue characterization (2) and in contrast agent–enhanced dual energy scans of the head and neck in a human (3). Whole-body CT scanning poses additional challenges, but early results in phantoms and human cadavers demonstrated the potential for this relatively new technology (4–6). The purpose of this study was to evaluate the performance of a prototype PCD CT system for abdominal CT in humans and to compare the results to a conventional EID.
Materials and Methods
This study was supported in part by a collaborative research agreement with Siemens Medical Systems (Forchheim, Germany). Authors who are not employees of or consultants for Siemens had control of inclusion of any data and information that might present a conflict of interest for the authors who are employed by Siemens.
Volunteer Population
The study was compliant with the Health Insurance Portability and Accountability Act and approved by our institutional review board. Written informed consent was obtained from each patient before enrollment.
Fifteen asymptomatic volunteers (seven men) older than 45 years were prospectively and consecutively enrolled between September 2 and November 13, 2015, at the National Institutes of Health Clinical Center. Mean age for men, women, and all patients was 66 years (age range, 46–73 years), 52 years (age range, 45–58 years), and 58 years (age range, 45–73 years), respectively. Exclusion criteria included renal failure, allergy to iodinated contrast material, pregnancy, known or possible genetic disposition to cancer, and CT scan within the last year.
CT Imaging System
Details of this prototype PCD system were previously described (5). In brief, a commercially available CT scanner (Somatom Flash; Siemens Healthcare) with two independent x-ray sources at 90° separation was modified so that one of the EIDs was replaced with a cadmium telluride–based PCD. The EID and PCD have, respectively, an effective field of view of 500 mm and 275 mm and collimation × pixel pitch of 128 × 0.6 mm and 32 × 0.5 mm at isocenter. The x-ray beam for the PCD was from the x-ray source of the commercial system and had 32-cm coverage along the fan angle. Up to four energy thresholds can be set on the PCD at 1-keV resolution: two between 20 and 50 keV and two between 50–90 keV. We set the energy thresholds at 25 keV and 65 keV with a tube voltage of 140 kVp, which resulted in two energy bins (low, 25–65 keV; high, 65–140 keV) to achieve roughly the same number of photons in each projection bin; the threshold setting was recommended by the scanner manufacturer to achieve a reasonable contrast-to-noise ratio, but it is not necessarily the optimal setting.
We combined the energy bins to reconstruct image volumes by using all the detected photons for comparison to the EID system. We use the term PCD data to refer to projections or images calculated from all detected photons. Images of each energy bin were also reconstructed separately for dual-energy material decomposition.
CT Scanning Protocol
For all study participants, iodinated contrast material (iopamidol 300 mg/mL; Isovue-300, Bracco Diagnostics, Melville, NY) was administered intravenously (2 mL/kg, up to a maximum of 130 mL, per our routine clinical protocol) at a rate of 2 mL/sec. An EID spiral scan of the abdomen was performed 70 seconds after injection of contrast material, followed within 6 seconds by a PCD spiral scan. Two minutes after contrast agent administration, additional EID and PCD scans of the kidneys were performed in axial mode in a single breath hold both within a time interval of less than 8 seconds, which therefore minimized differences in the phase of contrast enhancement. The axial scans were added to the study protocol after the fifth volunteer and were performed on the subsequent 10 patients. We also scanned an American College of Radiology CT phantom (Gammex, Middleton, Wis) in spiral mode on both systems with scan techniques similar to those of the clinical protocol (EID: 120 kVp, 100 mAs; PCD: 140 kVp, 60 mAs, with matched volume CT dose index [CTDIvol]).
We used the vendor-supplied software (Care Dose 4D; Siemens Healthcare) to calculate size-specific radiation dose estimate of the EID system for a contrast-enhanced abdomen protocol to achieve image quality comparable to a reference clinical setting of 210 mAs and 120 kVp in a so-called average patient (7). The PCD scan was performed at 140 kVp to take advantage of the energy discrimination capabilities of the system. Because the tube voltage settings were different in the two systems, we matched the CTDIvol of the two scans to ensure the same amount of radiation dose was used to image each section.
Tube current-time settings were adjusted in three groups of five patients each, with progressively lower radiation exposure: 100%, 80%, and 60% of the CTDIvol estimates (Care Dose 4D; Siemens Healthcare). The Table includes the details of radiation dose and milliampere-second values for the three groups. The spiral pitch was set at 0.8 and 0.6 for the EID and PCD systems, respectively; gantry rotation time was fixed at 0.5 seconds.
Baseline Demographic Data and Laboratory and Radiation Dose Parameters
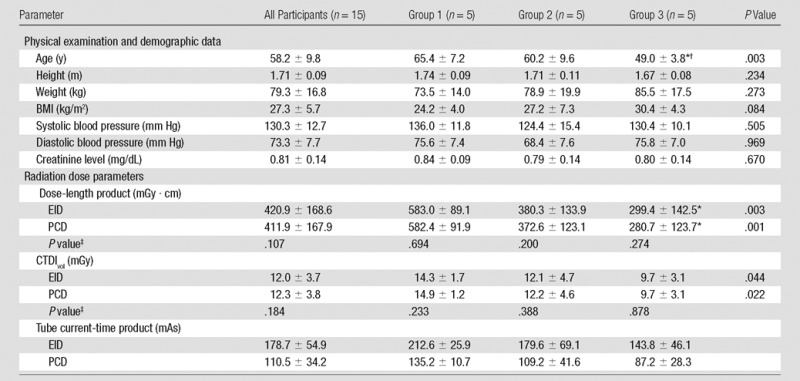
Note.—Data are means ± standard deviation unless otherwise indicated. Groups 1, 2, and 3 were scanned at 100%, 80%, and 60% of the recommended radiation dose, respectively. P values were calculated by using the one-way analysis of variance.
*Significant post hoc with Bonferroni correction versus group 1.
†Significant post hoc with Bonferroni correction versus group 2.
‡Post hoc pairwise comparison with student t test.
CT Image Reconstruction
Weighted filtered back projection image reconstruction was performed (Recon CT version 13.8.3.0; Siemens Healthcare). For each patient, the spiral EID and PCD images were reconstructed at a section thickness and increment of 2 mm and 1 mm by using two different kernels: B31f (medium smooth+) to assess the liver and the kidneys and B80f (ultrasharp) to assess the lungs and the pelvic bones. In addition to the four series above, images were reconstructed with B31f kernel at section thickness of 5 mm and increment 5 mm through the liver. For the qualitative comparison, we selected a series of images that were 5 cm of z-axis coverage of the lungs, liver, kidneys, and pelvis. Five series of images were chosen per patient for each detector system.
The 2-minute delayed enhanced axial EID and PCD (low-energy bin, high- energy bin, and combined) images were reconstructed with a quantitative kernel (D30f) at section thickness of 1 mm and increment of 1 mm with no bone or iodine beam hardening correction. All reconstructions were performed with field of view of 275 mm and 512 × 512 matrix.
Qualitative Image Analysis
Three radiologists (E.C.J. and L.R.F., each with >20 years of experience, and A.A.M., with 6 years of experience) independently rated the quality of PCD and EID images by using radiology imaging software (VuePACS version 12.0.0; Carestream Health, Rochester, NY). The readers were blinded to the system used (EID or PCD), patient demographics, and radiation dose. Image series were presented in random order. The images were set to corresponding standard window center and width values for evaluation of lung, soft tissue, and bone. Image quality was evaluated in terms of diagnostic acceptability, subjective image noise, and presence of artifacts. The images were reinterpreted (L.R.F.) to assess intrarater reproducibility.
The image quality scores were derived from the European Guidelines on Quality Criteria for CT, previously used in similar CT studies (8,9). Diagnostic scan quality was assessed with a yes-or-no question followed by a four-point score. Subjective image noise and image artifacts were graded on a five-point scale.
Quantitative Image Analysis
Spatial resolution and noise performance of the systems were investigated by using scans of the American College of Radiology CT phantom (Gammex). Noise-power spectrum and radial modulation transfer function of both systems were calculated as described in Friedman et al (10) by using software (Matlab; Mathworks, Natick, Mass). Hounsfield unit accuracy of the systems was also tested in module 1 of the phantom in five regions of interest (ROIs): bone, air, water, polyethylene, and acrylic. Hounsfield unit comparison of EID and PCD systems was also performed in seven paired circular ROIs that were approximately 1 cm2 in the 10 patients with 2-minute delayed enhanced axial scans (70 paired ROIs) covering the paraspinal muscles, kidney, liver, gallbladder, subcutaneous fat, spinal cord, and air in bowel lumen.
We used vendor-supplied dual-energy material decomposition software (11) to quantify the amount of iodinated contrast agent in tissue and create virtual noncontrast images. The contrast-to-noise ratios between kidney and paraspinal muscle of the EID, PCD, and iodine map images were calculated.
Statistical Analysis
This was an exploratory experiment and therefore a relatively small sample size was chosen and no preliminary statistical power analysis was performed. Statistical analyses were performed by using statistical software (R Statistical Software version 3.2.0; R Foundation for Statistical Computing, Vienna, Austria). Data were tested for normal distribution with the Shapiro-Wilk test. Continuous data were expressed as means ± standard deviation. One-way analysis of variance was used to assess the trend among the dose groups, and post hoc pairwise comparison of EID and PCD was performed by using the Student t test. Paired t test was used to compare continuous variables. Wilcoxon signed-rank test (paired) with continuity correction was used to compare the qualitative scores, and McNemar test was used to compare diagnostic acceptability. The intraclass correlation coefficient (ICC) was used to determine interrater and intrarater reproducibility; ICC greater than 0.75 indicated strong agreement and ICC of 0.4–0.75 indicated average agreement. A P value of less than .05 was considered to indicate statistical significance.
Results
The Table shows the demographics of study participants and dose parameters of the CT scan. As we expected, effective radiation dose, CTDIvol, dose-length product, and tube current significantly decreased with lower dose groups; however, radiation dose measurements were similar for the EID and PCD system in all dose groups.
Qualitative Assessment of Image Quality
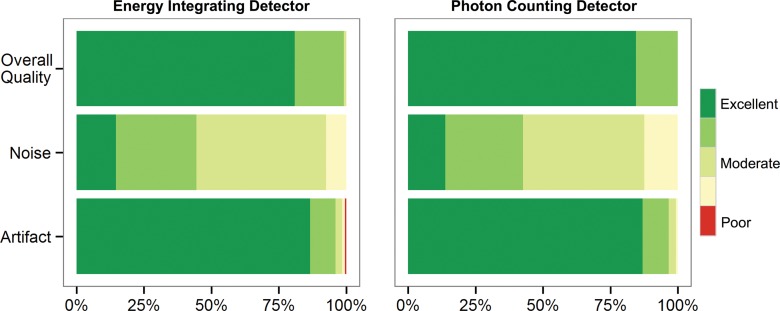
The three readers each analyzed 150 series of images (five anatomic regions × 15 patients × two detectors × three readers = 450 readings). All images were of diagnostic quality (P > .999). The scores for image quality (median score, 4; P = .19), qualitative noise (median score, 3; P = .30), and image artifacts (median score, 1; P = .17) were similar for the EID and PCD systems in all dose groups (Fig 1). Image quality and noise scores were significantly different among the three dose groups, decreasing with the dose, but not different between the detector systems. Interrater agreement for the three readers was average-to-strong for image quality (ICC, 0.84), qualitative noise (ICC, 0.88), and image artifacts (ICC, 0.74), and the intrarater agreement was strong (ICC, 0.94).
Figure 1:
Qualitative analysis scores. Near equivalence was noted for the EID and PCD systems for three readers who each evaluated 150 series of images for image quality (P = .19), noise (P = .30), and artifact (P = .17) by using Wilcoxon signed-rank test. Red = artifacts that affect the interpretation of a lesion or an organ of interest, yellow = pronounced artifacts that interfere with diagnosis (but a diagnosis can be made), light green = moderate artifacts that slightly interfere with diagnostic decision making, green = mild artifacts that do not interfere with diagnostic decision making, and dark green = no artifacts.
Quantitative Analysis
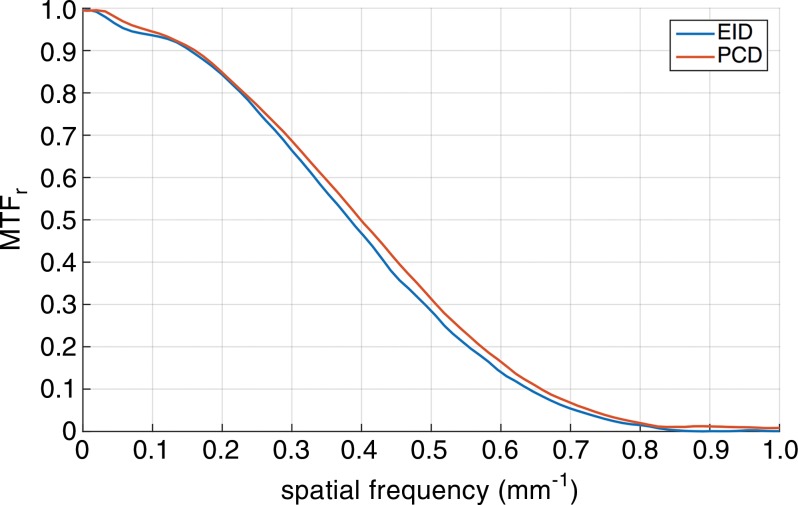
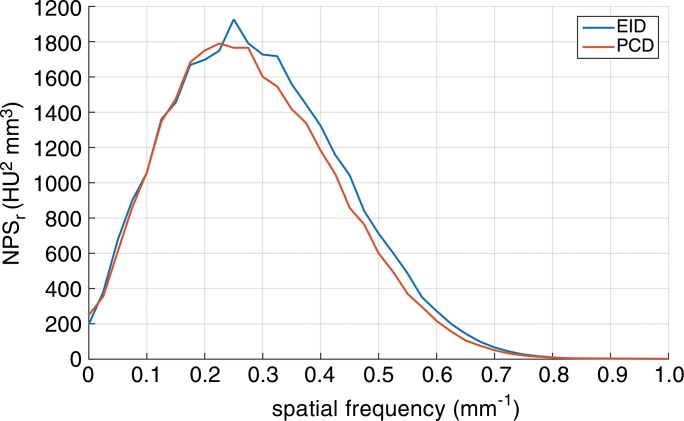
Phantom experiments.—The PCD had similar but marginally better performance in noise power spectrum; modulation transfer function measurements showed slight advantage of PCD in image resolution consistent with smaller PCD detector size (Fig 2). The Hounsfield unit accuracy measurements in the phantom did not reveal a significant difference between the two systems.
Figure 2a:
Quantitative assessment of the EID and PCD systems with an American College of Radiology (ACR) CT phantom. (a) Graph shows the radial modulation transfer function (MTF) at 10 cm off the isocenter. (b) Graph shows the noise-power spectrum (NPS). (c) Bar graphs show CT number (Hounsfield unit) accuracy in five different calibrated regions of the American College of Radiology CT phantom: bone, polyethylene (PE), acrylic, air, and water.
Figure 2b:
Quantitative assessment of the EID and PCD systems with an American College of Radiology (ACR) CT phantom. (a) Graph shows the radial modulation transfer function (MTF) at 10 cm off the isocenter. (b) Graph shows the noise-power spectrum (NPS). (c) Bar graphs show CT number (Hounsfield unit) accuracy in five different calibrated regions of the American College of Radiology CT phantom: bone, polyethylene (PE), acrylic, air, and water.
Figure 2c:
Quantitative assessment of the EID and PCD systems with an American College of Radiology (ACR) CT phantom. (a) Graph shows the radial modulation transfer function (MTF) at 10 cm off the isocenter. (b) Graph shows the noise-power spectrum (NPS). (c) Bar graphs show CT number (Hounsfield unit) accuracy in five different calibrated regions of the American College of Radiology CT phantom: bone, polyethylene (PE), acrylic, air, and water.
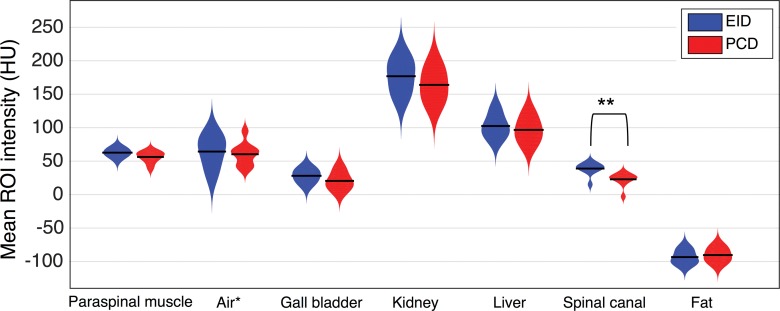
Human data.—The difference in the mean Hounsfield unit value of the selected ROIs between the PCD and EID images was not statistically significant except for the spinal cord (Fig 3). The mean Hounsfield unit in the spinal canal was significantly lower in the PCD than EID images (20 HU vs 36.5 HU; P < .001). There was no significant difference observed in Hounsfield unit accuracy in different dose groups between PCD and EID; however, the noise measured in the ROI of the paraspinal muscle increased significantly with dose reduction in both systems.
Figure 3:
Distribution plots of the mean Hounsfield unit value of the 1-cm2 circular ROIs selected from the 2-minute delayed contrast-enhanced axial EID and PCD images of 10 patients. Seven paired ROIs were selected in each patient: paraspinal muscle, air in bowel lumen, gallbladder, kidney, liver, spinal canal, and subcutaneous fat. * The air Hounsfield unit values are subtracted from −1000 HU for easier visualization. ** P < .001.
Multienergy Analysis
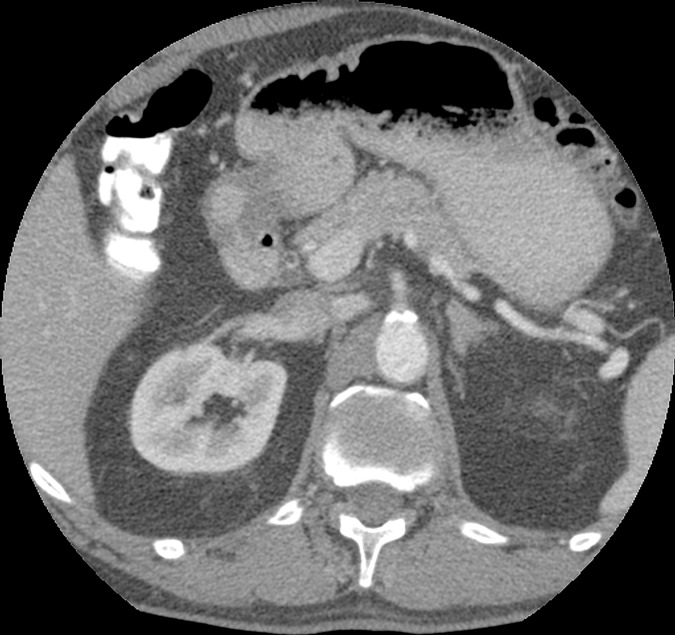
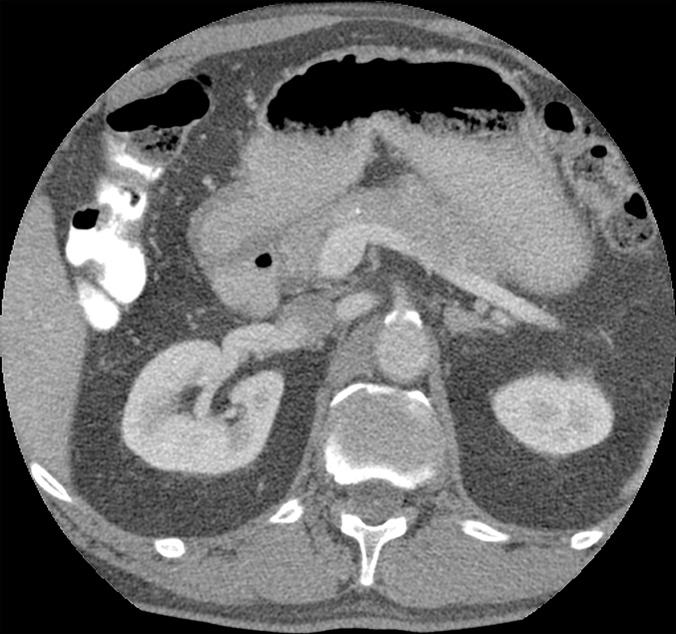
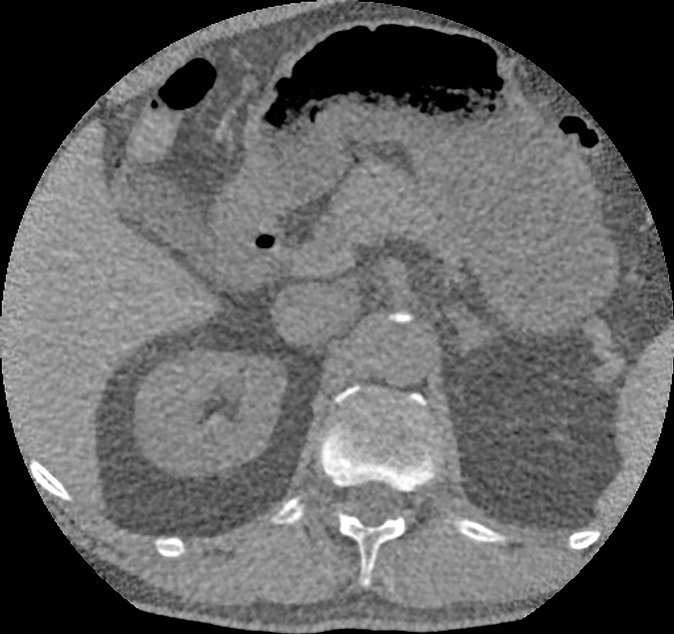
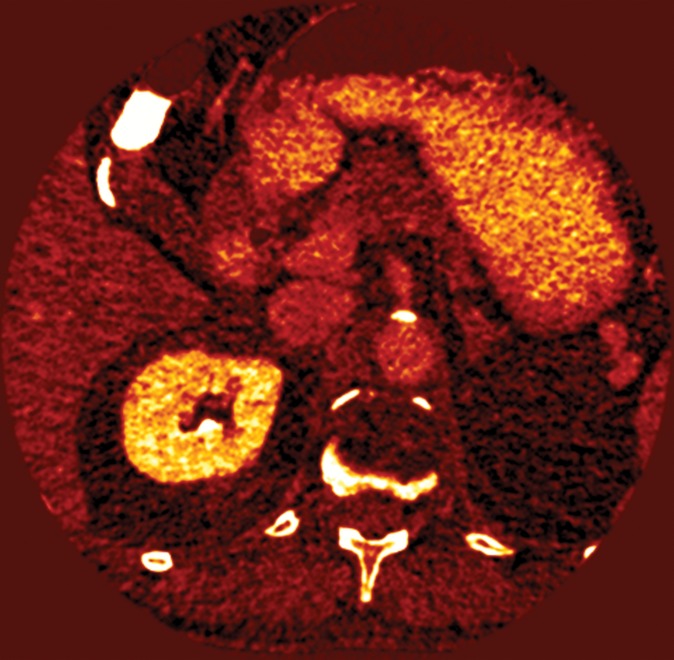
We used low- and high-energy PCD images to calculate iodine concentration maps and virtual noncontrast images for delayed-enhanced axial scans. Figure 4 shows an example of a virtual noncontrast image and the corresponding iodine concentration map. The mean contrast-to-noise ratios between kidney and paraspinal muscle in EID, PCD, and dual-energy iodine maps were 4.0 ± 1.3, 3.3 ± 0.9, and 5.2 ± 1.3, respectively. As we expected, the contrast-to-noise ratio in PCD was significantly lower than that in EID because of the higher tube voltage; however, the contrast-to-noise ratios in the iodine maps were 32% greater than in EID (P < .001).
Figure 4a:
Axial images in a 51-year-old woman. Images acquired with (a) EID and (b) PCD show no significant difference in qualitative image analysis. Multienergy analysis of contrast-enhanced PCD CT images: (c) a virtual noncontrast image, (d) an iodine concentration map, and (e) an iodine map superimposed on the virtual noncontrast image; the blue circles represent the ROI used for contrast-to-noise ratio calculation.
Figure 4b:
Axial images in a 51-year-old woman. Images acquired with (a) EID and (b) PCD show no significant difference in qualitative image analysis. Multienergy analysis of contrast-enhanced PCD CT images: (c) a virtual noncontrast image, (d) an iodine concentration map, and (e) an iodine map superimposed on the virtual noncontrast image; the blue circles represent the ROI used for contrast-to-noise ratio calculation.
Figure 4c:
Axial images in a 51-year-old woman. Images acquired with (a) EID and (b) PCD show no significant difference in qualitative image analysis. Multienergy analysis of contrast-enhanced PCD CT images: (c) a virtual noncontrast image, (d) an iodine concentration map, and (e) an iodine map superimposed on the virtual noncontrast image; the blue circles represent the ROI used for contrast-to-noise ratio calculation.
Figure 4d:
Axial images in a 51-year-old woman. Images acquired with (a) EID and (b) PCD show no significant difference in qualitative image analysis. Multienergy analysis of contrast-enhanced PCD CT images: (c) a virtual noncontrast image, (d) an iodine concentration map, and (e) an iodine map superimposed on the virtual noncontrast image; the blue circles represent the ROI used for contrast-to-noise ratio calculation.
Figure 4e:
Axial images in a 51-year-old woman. Images acquired with (a) EID and (b) PCD show no significant difference in qualitative image analysis. Multienergy analysis of contrast-enhanced PCD CT images: (c) a virtual noncontrast image, (d) an iodine concentration map, and (e) an iodine map superimposed on the virtual noncontrast image; the blue circles represent the ROI used for contrast-to-noise ratio calculation.
Discussion
These results report initial contrast-enhanced abdominal CT scans obtained by using a whole-body PCD CT scanner in a study of humans. The prototype scanner, reported here, contained both conventional EIDs and PCDs; this represents ideal conditions to directly compare both detector systems in the same patient with as little as a 1-second time interval between EID and PCD scans for axial and 6 seconds for spiral mode.
At the current stage of development, the qualitative and quantitative image quality analyses showed similar performance in EID and PCD. In addition, the current PCD system with two to four adjustable energy thresholds can acquire dual- and multienergy projections from a single scan, which could be used in multimaterial decomposition (12). The higher Hounsfield unit of the spinal canal in EID images can be attributed to the slight beam-hardening artifact caused by the vertebral body. The artifact was less prominent in the PCD images likely because they were acquired at a higher kilovolt-peak setting, and because the PCD can detect individual x-ray photons with spectral sensitivity and lower background noise.
There are multiple technical approaches to acquire clinical dual-energy images, including dual-source, fast kilovolt switching, and dual-layer detector technologies (13). Compared with these techniques, PCD has an advantage in that both low- and high-energy projections are acquired simultaneously and in the same detector pixel, which eliminates misregistration between the two energy bin images. In addition, the use of the same x-ray spectrum to acquire both energy bins may lead to more accurate and radiation dose–efficient photon energy detection. It should be noted that clinical PCD technology is in its early stages of development and many material decomposition, calibration, and artifact correction algorithms that are developed for conventional EID need to be optimized for PCD.
Pulse-pileup artifact is an important limitation of PCD technology and occurs when two or more photons are detected as one higher-energy photon because of their proximity in time. Another PCD artifact is charge sharing, which occurs when a photon is erroneously detected by neighboring detector pixels at lower energy levels; pulse pileup occurs in high tube currents and charge-sharing artifact is more prominent at very low tube current settings. In this study we set all milliampere values below the threshold recommend by the scanner manufacturer to avoid the pileup artifact, but high enough to reduce charge-sharing. A detailed analysis of photon-counting artifacts for the current prototype is reported in the literature (5,6).
In summary, this report demonstrates initial human results for contrast-enhanced abdominal imaging for PCD CT technology. The PCD system showed comparable performance to clinical EIDs when the abdomen was evaluated in a conventional scanning mode with the added advantage of providing spectral information that may be used for material decomposition.
Advances in Knowledge
■ This study demonstrates initial human results of photon-counting detector (PCD) CT for contrast agent–enhanced scans of the abdomen.
■ Phantom scans indicated similar spatial resolution (in terms of modulation transfer function), noise-power spectrum, and CT number accuracy between conventional (ie, energy-integrating detector [EID]) scans acquired at 120 kVp and dose-matched PCD scans acquired at 140 kVp (for PCD and EID, respectively: 20% modulation transfer function cutoff, 0.57 mm−1 vs 0.55 mm−1; and water attenuation, −1 HU ± 4 vs 2 HU ± 5).
■ Compared with dose-matched EID CT images, PCD CT images showed similar overall qualitative scores for image quality (median score, 4; P = .19), noise (median score, 3; P = .30), and artifact (median score, 1; P = .17).
■ EID and PCD CT images showed no significant difference in tissue attenuation Hounsfield unit measurements other than in the spinal canal, where the mean Hounsfield unit was higher in EID (20 HU vs 36.5 HU, P < .001), which is likely because of beam-hardening artifact on EID CT images.
■ Iodine concentration maps and virtual noncontrast images from PCD CT showed greater contrast-to-noise ratio than did EID scans by an average of 32% (P < .001).
Implication for Patient Care
■ PCD CT can provide similar image quality compared with conventional CT while also providing spectral CT images for material decomposition.
Received November 24, 2015; revision requested December 10; revision received December 21; accepted December 22; final version accepted January 15, 2016.
Supported by a collaborative research agreement with Siemens Medical Solutions.
A.P. and R.S. contributed equally to this work.
Funding: R.S. supported by National Institutes of Health Intramural research program http://dx.doi.org/ (ZIACL090019; ZIAEB000072).
Disclosures of Conflicts of Interest: A.P. disclosed no relevant relationships. R.S. disclosed no relevant relationships. V.S. disclosed no relevant relationships. M.M. disclosed no relevant relationships. M.K.F. disclosed no relevant relationships. G.H. disclosed no relevant relationships. E.C.J. disclosed no relevant relationships. A.A.M. disclosed no relevant relationships. L.R.F. Activities related to the present article: disclosed no relevant relationships. Activities not related to the present article: author disclosed a research agreement with Carestream Health (PACS) and a patent on CT viewing window level issued to the military. Other relationships: disclosed no relevant relationships. D.A.B. Activities related to the present article: disclosed nonfinancial support from Siemens. Activities not related to the present article: disclosed no relevant relationships. Other relationships: disclosed no relevant relationships.
Abbreviations:
- CTDIvol
- volume CT dose index
- EID
- energy-integrating detector
- ICC
- intraclass correlation coefficient
- PCD
- photon-counting detector
- ROI
- region of interest
References
- 1.Taguchi K, Iwanczyk JS. Vision 20/20: Single photon counting x-ray detectors in medical imaging. Med Phys 2013;40(10):100901. [DOI] [PMC free article] [PubMed] [Google Scholar]
- 2.Ding H, Klopfer MJ, Ducote JL, Masaki F, Molloi S. Breast tissue characterization with photon-counting spectral CT imaging: a postmortem breast study. Radiology 2014;272(3):731–738. [DOI] [PMC free article] [PubMed] [Google Scholar]
- 3.Iwanczyk JS, Nygård E, Meirav O, et al. Photon counting energy dispersive detector arrays for x-ray imaging. IEEE Trans Nucl Sci 2009;56(3):535–542. [DOI] [PMC free article] [PubMed] [Google Scholar]
- 4.Feuerlein S, Roessl E, Proksa R, et al. Multienergy photon-counting K-edge imaging: potential for improved luminal depiction in vascular imaging. Radiology 2008;249(3):1010–1016. [DOI] [PubMed] [Google Scholar]
- 5.Kappler S, Henning A, Kreisler B, Schoeck F, Stierstorfer K, Flohr T. Photon counting CT at elevated X-ray tube currents: contrast stability, image noise and multi-energy performance. In: Whiting BR, Hoeschen C, eds. Proceedings of SPIE: medical imaging 2014—physics of medical imaging. Vol 9033. Bellingham, Wash: International Society for Optics and Photonics, 2014; 90331C. [Google Scholar]
- 6.Yu Z, Leng S, Jorgensen SM, et al. Initial results from a prototype whole-body photon-counting computed tomography system. In: Hoeschen C, Kontos D, Flohr TG, eds. Proceedings of SPIE: medical imaging 2015—title. Vol 9412. Bellingham, Wash: International Society for Optics and Photonics, 2015; 94120W. [DOI] [PMC free article] [PubMed] [Google Scholar]
- 7.Tack D, De Maertelaer V, Gevenois PA. Dose reduction in multidetector CT using attenuation-based online tube current modulation. AJR Am J Roentgenol 2003;181(2):331–334. [DOI] [PubMed] [Google Scholar]
- 8.Singh S, Kalra MK, Moore MA, et al. Dose reduction and compliance with pediatric CT protocols adapted to patient size, clinical indication, and number of prior studies. Radiology 2009;252(1):200–208. [DOI] [PubMed] [Google Scholar]
- 9.Bongartz G, Golding SJ, Jurik AG, et al. European guidelines on quality criteria for computed tomography. Luxembourg: Office for Official Publications of the European Communities, 2000. [Google Scholar]
- 10.Friedman SN, Fung GS, Siewerdsen JH, Tsui BM. A simple approach to measure computed tomography (CT) modulation transfer function (MTF) and noise-power spectrum (NPS) using the American College of Radiology (ACR) accreditation phantom. Med Phys 2013;40(5):051907. [DOI] [PMC free article] [PubMed] [Google Scholar]
- 11.Chandarana H, Megibow AJ, Cohen BA, et al. Iodine quantification with dual-energy CT: phantom study and preliminary experience with renal masses. AJR Am J Roentgenol 2011;196(6):W693–W700. [DOI] [PubMed] [Google Scholar]
- 12.Wang X, Meier D, Taguchi K, Wagenaar DJ, Patt BE, Frey EC. Material separation in x-ray CT with energy resolved photon-counting detectors. Med Phys 2011;38(3):1534–1546. [DOI] [PMC free article] [PubMed] [Google Scholar]
- 13.Marin D, Boll DT, Mileto A, Nelson RC. State of the art: dual-energy CT of the abdomen. Radiology 2014;271(2):327–342. [DOI] [PubMed] [Google Scholar]


