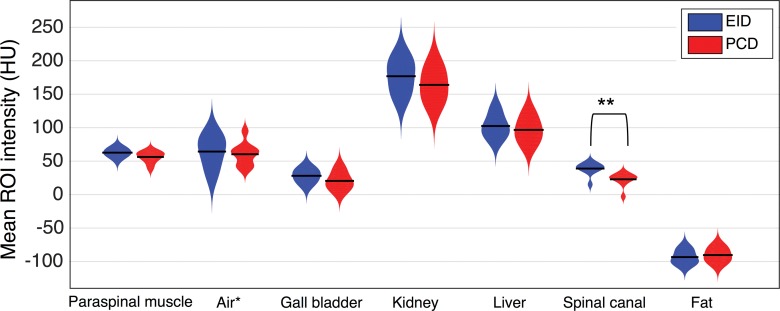
Figure 3:
Distribution plots of the mean Hounsfield unit value of the 1-cm2 circular ROIs selected from the 2-minute delayed contrast-enhanced axial EID and PCD images of 10 patients. Seven paired ROIs were selected in each patient: paraspinal muscle, air in bowel lumen, gallbladder, kidney, liver, spinal canal, and subcutaneous fat. * The air Hounsfield unit values are subtracted from −1000 HU for easier visualization. ** P < .001.

