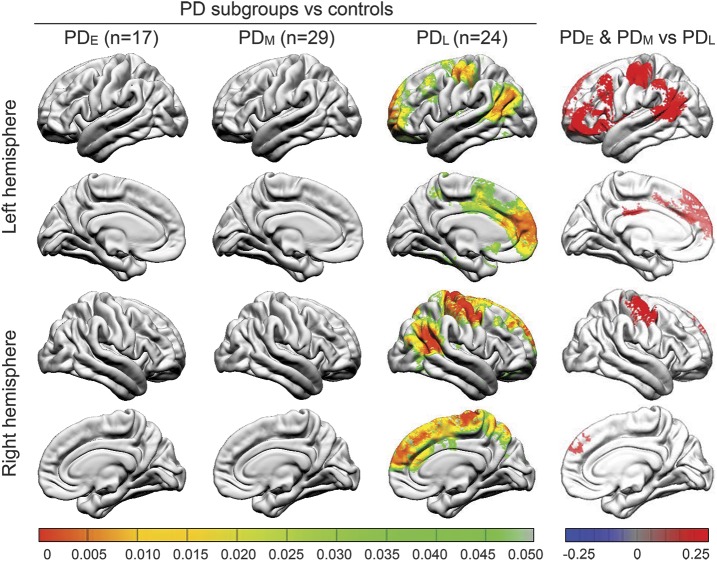
Figure 1. Comparison of local gyrification index between Parkinson disease (PD) subgroups and controls (left) and among PD subgroups (right) at baseline.
PD–late (PDL) participants (duration of illness >5 years) demonstrated significantly reduced gyrification bilaterally in the inferior parietal, precentral and postcentral, and superior frontal areas, compared to controls at baseline visit (left). PD subgroup vs control color maps represent adjusted p values using an expected false discovery rate of 0.05. PDL participants demonstrated significantly reduced gyrification in several neocortical areas, compared to PD–early (PDE) and PD–middle (PDM) participants at baseline (right). Post hoc PD subgroup comparison color maps represent significant β values using a false discovery rate–adjusted p value threshold of 0.05.

