

Abstract
The cornea is a complex tissue composed of different cell types, including corneal epithelial cells and keratocytes. Each of these cell types are directly exposed to rich nanoscale topography from the basement membrane or surrounding extracellular matrix. Nanoscale topography has been shown to influence cell behaviors, including orientation, alignment, differentiation, migration, and proliferation. We investigated whether proliferation of SV40-transformed human corneal epithelial cells (SV40-HCECs), primary human corneal epithelial cells (HCECs), and primary corneal fibroblasts is influenced by the scale of topographic features of the substratum. Using basement membrane feature sizes as our guide and the known dimensions of collagen fibrils of the corneal stroma (20 – 60 nm), we fabricated polyurethane molded substrates, which contain anisotropic feature sizes ranging from 200 –2000 nm on pitches ranging from 400 to 4000 nm (pitch = ridge width + groove width). The planar regions separating each of the six patterned regions served as control surfaces. Primary corneal and SV40-HCEC proliferation decreased in direct response to decreasing nanoscale topographies down to 200 nm. In contrast to corneal epithelial cells, corneal fibroblasts did not exhibit significantly different response to any of the topographies when compared with planar controls at 5 days. However, decreased proliferation was observed on the smallest feature sizes after 14 days in culture. Results from these experiments are relevant in understanding the potential mechanisms involved in the control of proliferation and differentiation of cells within the cornea.
Keywords: corneal epithelial cells, proliferation, nanotopography, contact guidance
INTRODUCTION
The cornea is a complex transparent refractive tissue, which provides an impermeable barrier to the outside environment. Two of the main cellular components of the cornea include the corneal epithelial cells and keratocytes. One universal characteristic of both the corneal epithelial cells and keratocytes is that they are exposed to or surrounded by a rich extracellular matrix topography. Basal corneal epithelial cells attach to their underlying stroma through a unique specialization of the extracellular matrix, the basement membrane.1,2 Keratocytes are located in the underlying stroma and comprise an interconnnected network of cells interspersed between lamellae composed of collagen fibers of uniform size and spatial distribution.3 Keratocytes are typically found at the junction between adjacent lamellae. Although keratocytes are not attached to a basement membrane, they are constantly synthesizing matrix and are surrounded by basal lamina like aggregates.4
We have previously demonstrated that both the anterior and posterior basement membranes of the human cornea exhibit a rich three-dimensional nanoscale topography, with features ranging from 30 –400 nm. The topographic architecture of the anterior corneal basement membrane has been reported to be similar in nonhuman primates, humans, and dogs.5–7 Basement membranes or the surrounding extracellular matrix have been implicated in directing cell shape, growth, migration, differentiation, and proliferation.8 –10 Numerous studies have sought to investigate the interaction between cells and substrate topography with surface features including grooves, ridges, steps, pores, wells, and nodes, with a variety of different cell types.11 Because of constraints in fabrication methods, previous work focused primarily on the effects of surface features with dimensions ≥1 μm. Recent advances in nanofabrication techniques have allowed for the design of surfaces with both nano- and micrometer-scale feature sizes.
Using the topography of the native basement membrane as a guide, we have designed and fabricated silicon surfaces that contain anisotropic features (groove + ridge width = pitch) including 400, 800, 1200, 1600, 2000, and 4000 nm and a depth of 300 nm.12 We have demonstrated that the scale of the native basement membrane features (nanoscale) is an important component in regulating orientation, migration, and adhesion in corneal epithelial cells. Human corneal epithelial cells (HCECs) and corneal fibroblasts exhibit increased alignment on surface features below 1 μm.12,13 In addition, HCECs exposed to a biologically relevant shear fluid force have increased adhesion on the nanoscale topography.14
In our current investigation on the effects of nanotopography on proliferation, we utilized nanomolded optically transparent substrates containing a range of feature sizes that spanned from 200 to 2000 nm. NOA61 polyurethane has historically been used as an optical adhesive and was chosen for our studies based on the limited toxicity to corneal epithelial cells and the material properties, allowing for consistent replication of nanosized features. We have successfully generated polyurethane NOA61 substrates with anisotropic grooves and ridges using soft lithography and composite stamping replication procedures developed by Whitesides and coworkers.15,16 The smaller feature sizes mimic the dimensions of features commonly found in the native basement membrane and the larger scale features provide a connection to the bulk of the literature. Also, by using a range of sizes, it is possible to identify possible transitions in behavior that correlate to the scale of topographic features. These polymeric surfaces have several advantages in comparison to silicon substrates, including their ease and cost of fabrication, defined surface chemistry, as well as the ability to visualize live cells over time. Our results indicate that topographies below 1 μm significantly inhibit proliferation of SV40-transformed human corneal epithelial cells, primary HCECs, and corneal fibroblasts.
MATERIALS AND METHODS
Fabrication of micro- and nanoscale surfaces
Silicon masters
Patterned silicon surfaces were prepared at the Center for Nanotechnology (University of Wisconsin) as previously described.12 Briefly, X-ray lithography was used to pattern micro- and nanosized ridges and grooves. A uniform layer of photosensitive resist was layered onto the silicon wafer and patterned by X-ray lithography, producing alternate bands of exposed and unexposed resist. Exposed regions were sensitive to removal by solvents in the developing process. A plasma ion etcher eroded exposed regions of silicon and the remaining resist was removed, leaving patterned silicon wafers. To ensure uniform surface chemistry, surfaces were coated with silicon oxide using low-pressure chemical vapor deposition. The resulting surface features were characterized and measured using scanning electron microscopy. Measurements indicated a 1:1 ridge-to-groove ratio and a depth of 300 nm for each pitch. Each substrate contains an array of six 2 × 2 mm2 areas (400, 800, 1200, 1600, 2000, and 4000 nm pitch) patterned with grooves and ridges separated by flat control surfaces.12,13
Polydimethylsiloxane stamps
The silicon masters were also used as templates for replication of the patterns in NOA61 polyurethane (Norland Optical Adhesives) through soft lithography. Each master was silanized prior to making polydimethylsiloxane (PDMS) stamps so as to minimize adhesion to the silicon surface. Tridecafluoro-1,1,2,2,-tetrahydrooctyl (trichlorosilane; Gelest) was pipetted in a dropwise fashion around the silicon masters, followed by vacuum desiccation for 30 min. PDMS stamps were generated by mixing 184 prepolymer and 184 curing agent (Dow Chemical) 10:1 by volume. The mixture was degassed in a vacuum desiccator for 15 min. The PDMS mixture was poured over the silanized silicon masters to form a layer that is 3 mm thick. This complex was degassed and cured by incubation at 60°C for 1 h. The hardened PDMS stamp was gently removed from the silicon master.
NOA61 polyurethane surfaces
A small dime sized amount of NOA61 was added to 35-mm tissue culture plates. Plates were placed in a spin coater for 40 s at 4000 rpm. PDMS stamps were placed firmly onto these coated surfaces and cured for 2 h in an XL-1500 UV crosslinker. In preparation for tissue culture, all surfaces (silicon and polyurethane) were rinsed three times for 10 min with distilled water and sterilized by immersion in 70% ethanol, followed by air-drying in a sterile laminar flow hood.
Cell culture
Primary human corneal epithelial cells (HCECs) and fibroblasts were harvested from donated human corneas (Lions Eye Bank of Wisconsin, Madison, WI, or the Missouri Lions Eye Bank, Columbia, MO.) as previously described.12 Briefly, scleral and limbal areas of the corneas were trimmed and immersed in dispase solution (1.2 U/mL, Boehringer, Mannheim, Germany) at 37°C for 4 h. Corneal cells were removed by gentle rubbing of the anterior surface with a pipette tip and the resulting cell suspensions were pooled and collected. Cell suspensions were centrifuged and resuspended in Epilife basal medium (Cascade Biologics) with the following growth supplements: bovine serum albumin, bovine transferrin, hydrocortisone, recombinant human insulin-like growth factor type-1, prostaglandin, and recombinant human epidermal growth factor. Cell suspensions from 2– 4 corneas were plated onto fibronectin- and collagen-coated T25 cell culture flasks. Primary HCECs were expanded and utilized between passages 1–3.
Following the harvest of primary HCECs, the posterior surface of the remaining corneal tissue was scraped gently to remove corneal endothelial cells that line the posterior surface.13 The remaining corneal stroma containing keratocytes were incubated in 6-well plates (1 cornea/well) containing 4 mL of DME supplemented with 10% fetal bovine serum. The presence of serum is known to cause a transition of quiescent keratocytes to a more metabolically active fibroblast phenotype.17–19 Fibroblasts were allowed to migrate from the corneal tissue and expand over a period of several weeks. Corneal fibroblasts were utilized between passages 1–5.
SV40-transformed human corneal epithelial cells (SV40-HCECs) were a generous gift from Dr. Kaouru Araki-Sasaki (Kiniki Central Hospital, Hyogo, Japan). Cells were cultured in a modified supplemented hormonal epithelial medium (SHEM) supplemented with 10% fetal bovine serum. SHEM contains a 1:1 ratio of Ham’s F12/Dulbecco’s modified Eagle’s medium DMEM (Invitrogen), 0.5% dimethyl sulfoxide (Sigma), and 40 μg gentamycin (Sigma)/mL. Cells from passages 18 –35 were utilized. All cells were incubated at 37°C under 5% CO2.
Proliferation
Primary HCECs, SV40-HCECs, and corneal fibroblasts were plated at a density of 10,000 cells/cm2 in 24-well plates containing the patterned silicon chips or patterned polyurethane. Several hours after plating, cells on each pattern 400 – 4000-nm pitch and planar control were imaged at 10× magnification using an inverted Zeiss Axiovert 200M microscope (Carl Zeiss, Germany) equipped with a high-resolution digital camera and counted (day 0). Cells were cultured for 5 days (day 5) at which time the cells were fixed for 20 min in 4% paraformaldehyde in phosphate-buffered saline. Nuclei were stained with 90 nM concentration of DAPI (Molecular Probes) and imaged using an Axiovert 200 inverted microscope. Cell counts were obtained from images using KS300 image analysis software (Carl Zeiss). Five substrates (silicon or polyurethane) were used for each experiment and each experiment was done in triplicate.
Statistics
The mean cell number and standard deviation were generated from day 0 and day 5 timepoints. For corneal fibroblasts, a day 14 timepoint was also generated. From cell counts, we generated a percent cell increase on each of the surface topographies. Data were analyzed using one-way analysis of variance (ANOVA). When variability was determined to be significant (p < 0.05), the unpaired student t test was utilized to determine significance (p < 0.05) between groups.
RESULTS
Proliferation of SV40-HCECs is modulated by the scale of substratum topographic features
We have shown previously that HCECs and corneal fibroblasts exhibit significant differences in orientation and alignment on our silicon substrates containing biologic length scale feature sizes.12,13 Our goal was to investigate the effects of topography alone on proliferation using an alternate substrate material, NOA 61 polyurethane. NOA 61 is an optical adhesive, which was chosen based on the limited toxicity to corneal epithelial cells and the ability to mold and maintain our nanosized features. We used SV40-HCECs, which are commonly used as a replacement for primary HCECs because of their ease of use and availability, in order to compare results with those obtained using primary cells.
We plated 10,000 SV40-HCECs into 6 wells of a 24-well plate. Each well contained one polyurethane substrate containing a range of pitch from 400 – 4000 nm and a control planar surface. Initial observations of cells plated onto topography suggested differences in their proliferative capacity by the colony size observed. SV40-HCECs on planar and 4000 nm pitch patterns displayed large actively proliferating colonies of 50 cells or more [Fig. 1(A,B,D,E)]. Colonies on the 400 nm pitch were small in comparison, 20 –30 cells, to the larger feature sizes [Fig. 1(C,F)]. Our qualitative observations suggested that proliferation of SV40-HCECs is decreased on the smallest scale features.
Figure 1.

Colony size of SV40-HCECs is modulated by nanoscale topography. SV40-HCECs were plated at a density of 10,000 cells/surface in a 24-well plate. Images of cells were taken at day 0 and day 5 in culture. On day 5, cells were fixed in 4% paraformaldehyde and stained with the nuclear dye DAPI. Phase and DAPI images of cells on day 5 were acquired using an inverted Zeiss Axiovert 200 with Axiovision acquisition software (Zeiss). All images were taken at a magnification of 10×. The arrow indicates the direction of the ridges and grooves.
To quantitate our observations, images of DAPI-stained cells were taken and nuclei were counted. Cell counts were performed 4 h and 5 days postplating and a percent increase in cell number was generated. We observed a significant decrease in proliferation on the 400 nm pitch (p < 0.0017), with approximately one third the number of cells present on the planar control surfaces (Fig. 2). Cells on topography ranging from 800 to 4000 nm pitch were not significantly different from those on the planar control. Results also suggest that the proliferative response of the SV40-HCECs on the NOA 61 is similar to that on silicon substrates (data not shown), implying that the inhibition of proliferation is due to the nanosized topographic features and not the underlying surface chemistry of the substrate.
Figure 2.

Proliferation of SV40-HCECs is modulated by nanoscale topography. SV40-HCECs were plated at a density of 10,000/6 pack in a 24-well plate. Cells were counted on day 0 and after 5 days in culture. The percent increase of proliferation from five different surfaces was determined. Significant differences between cells on topography and planar control surfaces were determined using ANOVA. Significant differences (p ≤ 0.05) between cells on topography and planar control cells are marked with stars. This figure is representative of experiments completed in triplicate.
Proliferation of primary HCECs in response to nanoscale topography
In addition to our investigation of SV40-HCECs, we hypothesized that different cell types may vary in their proliferative response on the nanoscale surfaces. Primary HCECs were plated as previously described and counted 4 h and 5 days postplating. We observed a decrease in proliferation of HCECs on the smaller pitches (Fig. 3). Cells on the 400, 800, and 1200 nm pitch patterns exhibited a 45% (p ≤ 0.0001), 57% (p ≤ 0001), and 82% (p ≤ 0.0004) percent increase in proliferation, respectively, which were all significantly less than that found on the planar control (132%). Large feature sizes including 1600 nm (133%), 2000 nm (153%), and 4000 nm (163%) were not significantly different from the planar control.
Figure 3.

Proliferation of primary corneal cells is decreased on nanoscale topography. Primary HCECs were plated at a density of 10,000/6 pack in a 24-well plate. Cells were counted on day 0 and after 5 days in culture and the percent increase in proliferation from five different surfaces was determined. A significant difference among treatment groups (p ≤ 0.05) was determined by ANOVA, and student t tests were done. Significant differences (p ≤ 0.05) between cells on topography and planar control cells are marked with stars. This figure is representative of experiments completed in triplicate.
Proliferation of corneal fibroblasts is not modulated by nanoscale topography after 5 days of incubation
After 5 days of incubation, corneal fibroblast proliferation was unaffected by the scale of substratum topographic features. At this timepoint, all treatment groups exhibited a similar percent increase in proliferation ranging from 235–258%. ANOVA indicated that there was no significant difference in proliferation of corneal fibroblasts plated on planar or any of the topographic patterns (p ≤ 0.387) after 5 days in culture (Fig. 4).
Figure 4.
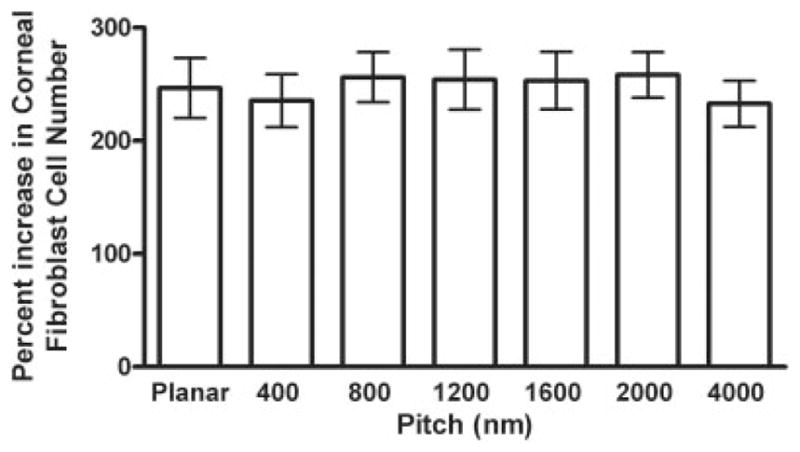
Proliferation of corneal fibroblasts is not modulated by nanoscale topography after 5 days in culture. Corneal fibroblasts were plated at a density of 10,000/6 pack in a 24-well plate. Cells were counted on day 0 and after 5 days in culture. The percent increase of proliferation from five different surfaces was determined. Significant differences between cells on topography and planar control surfaces were determined using ANOVA. Significant differences (p ≤ 0.05) between cells on topography and planar control cells are marked with stars. This figure is representative of experiments completed in triplicate.
Studies on rat dermal fibroblasts have indicated that the effects of nanotopography on proliferation are observed after 7 days in culture.20 To examine whether the effects of nanotopography on proliferation could be observed after longer incubation periods, corneal fibroblasts were plated as previously described and images were acquired at day 0 and day 14. Upon initial observation, corneal fibroblasts on planar surfaces exhibited no particular orientation and there was a heterogenous population of both large and small cell morphology [Fig. 5(A)]. Corneal fibroblasts on the 4000 nm patterns appeared to pack together tightly and orient along the direction of the ridges and grooves [Fig. 5(B)]. In contrast, cellular morphology on the 400 nm pitch was distinctly different from both the planar control and the 4000 nm pitch. Cells were oriented parallel to the long axes of the ridges and grooves; however, they were more spread over the surface and enlarged when compared with those on the 4000 nm pitch.
Figure 5.

Cellular morphology of primary corneal fibroblasts is altered on the nanotopography. Keratocytes were plated at a density of 10,000 cells/surface in a 24-well plate. Images of cells were taken at day 0 and day 14 in culture. On day 14, cells were fixed in 4% paraformaldehyde and stained with the nuclear dye DAPI. DAPI images of cells on day 14 were acquired using an inverted Zeiss Axiovert 200 with Axiovision acquisition software (Zeiss). All images were taken at a magnification of 10×. The arrow indicates the direction of the ridges and grooves.
Our qualitative results suggested that the effects of proliferation on the corneal fibroblasts were only observed after prolonged incubation times on the nanotopographic surfaces. To verify quantitatively, cells from day 0 and day 14 timepoints were counted and a percent increase in proliferation was generated from 400 nm, 4000 nm, and planar control (Fig. 6). Corneal fibroblasts on the smallest feature sizes of 400 nm demonstrated a significant difference (p < 0.0032) in the percent change in proliferation (31%) when compared with 4000 nm (178%) nm and planar control (140%). In summary, we found that SV40-HCECs, primary corneal epithelial cells, and corneal fibroblasts all exhibit a decrease in proliferation on the smallest feature sizes investigated. The modulation of the proliferative response to topography varies temporally between the cell types.
Figure 6.

Proliferation of corneal fibroblasts is modulated by nanoscale topography after 14 days in culture. Corneal fibroblasts were plated at a density of 10,000/6 pack in a 24-well plate. Cells were counted on day 0 and after 14 days in culture. The percent increase of proliferation from five different surfaces was determined. Significant differences between cells on topography and planar control surfaces were determined using ANOVA. Significant differences (p ≤ 0.05) between cells on topography and planar control cells are marked with stars. This figure is representative of experiments completed in triplicate.
DISCUSSION
The cellular components of the cornea, including epithelial cells and keratocytes, need to maintain a balance between proliferation and differentiation for maintenance of homeostasis of the tissue. The underlying signaling pathways involved in mediating the impact of topographic cueing on proliferation have yet to be elucidated. In our study, we investigated the effects of the scale of topographic features of the substratum on the proliferation of HCECs, SV40-HCECs, and corneal fibroblasts. We found that topography alone has an impact in modulating the proliferation of primary HCECs and SV40-HCECs and corneal fibroblasts; however, the timing of the response varies depending on the cell type. Our results may suggest that the nanosized features may be involved in the control of cell fate from a proliferative to a more differentiated state. The smallest features examined (200 nm) lie in the range of the predominant feature sizes found in the native corneal basement membrane.5,11,21
Nanoscale topographic features from the underlying substratum have been documented to directly affect cell differentiation, adhesion, and proliferation.11,22–26 Our results indicating a decrease in proliferation of the corneal epithelial cells and corneal fibroblasts are similar to those of studies with epithelial cells and fibroblasts on nanosized pores ranging in size from 100 nm to 3 μm. Pores with diameters of 100 – 800 nm provided the best surface for tissue migration and differentiation.27–29 Other recent data from our laboratory involving PC12 cells have also demonstrated an increase in neurite outgrowth, a hallmark of PC12 differentiation, on the 400 nm pitch.30 Results from our studies indicate that proliferation is decreased in epithelial cells as a direct effect of nano-sized surface topography. In addition, our proliferation results, combined with observations in orientation, migration, and adhesion, also suggest that there is a distinct feature size or transition point between 1200 –1600 nm pitch-feature sizes at which the behaviors change.
We have reported that the effects of nanotopographic features on proliferation are cell-type dependent. Unlike the SV40-HCECs and primary HCECs, corneal fibroblasts were not influenced by the scale of the underlying surface topography after 5 days. Effects of nanotopographic features on proliferation were not observed until 14 days postplating. Studies involving rat dermal fibroblasts also did not initially demonstrate a change in proliferation on nano-sized topography. A decrease in proliferation rate of these cells was not observed until 7 days postplating.31 Compared with corneal epithelial cells, the corneal fibroblasts do not normally proliferate in vivo and are referred to as keratocytes. Keratocytes are only induced to proliferate and activated to corneal fibroblasts during a wound healing state or when initiated into tissue culture with serum.17,19 Several recent studies have emphasized the importance of soluble factors, serum, and cell density in the determination of the keratocyte to corneal fibroblast to myofibroblast phenotype. The decrease in proliferation on the smallest topography may indicate a return to a more in vivo like keratocyte state and warrants further investigation.
Interestingly, the SV40-HCECs on the nanotopography follow the same trend as the primary corneal epithelial cells in their response to topography. However, only cells on the 400 nm pitch demonstrated significant differences when compared with those on the planar control. SV40-HCECs are well-characterized and have been used as a substitute in studies involving corneal epithelial cells. These transformed cells exhibit similar population doubling time, morphology, proliferation, and express keratin specific markers.32 However, these cells have been transformed and proliferate long-term in culture, indicating that differentiation characteristics may be altered when compared with primary corneal epithelial cells. Variations in the differentiation state of other cell types, including osteoblasts, have been reported to alter the proliferative response to substrate topography.33 MC3T3-E1 cells and immature osteoprogenitor cells demonstrated increased proliferation rates on rough nanoscale topographies of 1–13 nm.34 However mature MG63 cells demonstrated a decrease in proliferation on rough topographies of 1–13 nm after 5 days in culture. The different responses of cells with varying degrees of differentiation to the nanoscale topography may provide a new alternative method for screening of cells with altered proliferative or differentiation states. Differing topographic cues may be necessary to switch transformed cells to a nonproliferative state. It is also interesting to speculate that the loss of responsiveness to certain scales of topographic cues may have relevance to the transformation process.
The question remains as to the mechanism of action responsible for the change in proliferative response from exposure to biologically relevant feature sizes. One of the major factors known to influence proliferation is cell shape. We have previously reported that topography modulates the orientation and alignment of both HCECs and keratocytes, altering cell shape and alignment of stress fibers when compared with cells on planar surfaces.12,13 Cell geometry was able to switch cells from growth (in a more “stretched out” state) to apoptosis (occurs in a more rounded state).35 A report by Chen and coworkers has documented that cell shape can directly affect whether individual vascular endothelial cells live or die.36 Documented changes in cell volume and shape also impact the activities of certain genes. Specifically, in human fibroblasts, substratum surface topography has been reported to regulate fibronectin production and secretion.37 Taken together, these data document dramatic effects of the scale of topographic features similar to that found in the native basement membrane on cell behaviors and suggest several mechanisms that may be involved in transducing biophysical events at the cell membrane.
To further investigate the differences in proliferative response to topography, we are initiating experiments to more thoroughly analyze the cell cycle profile of corneal epithelial cells and corneal fibroblasts on topography, to determine whether there are shifts from proliferation (S phase) to a growth or differentiation phase (G0 or G1) on our nanosized features. In addition, future experiments will more thoroughly investigate the differentiation state of both HCECs and corneal fibroblasts on our substrates. The impact of topographic cues on the proliferative response of cells has relevance to evolving strategies in tissue engineering, the development of prosthetic devices, and the conduction of in vitro assays.
Acknowledgments
Contract grant sponsors: NSF-MRSEC and NEI12253–01.
References
- 1.Timpl R. Macromolecular organization of basement membranes. Curr Opin Cell Biol. 1996;8:618–624. doi: 10.1016/s0955-0674(96)80102-5. [DOI] [PubMed] [Google Scholar]
- 2.Ekblom E, Timpl R. Cell to cell contact and extracellular matrix, a multifaceted approach emerging. Curr Opin Cell Biol. 1996;8:599–601. doi: 10.1016/s0955-0674(96)80099-8. [DOI] [PubMed] [Google Scholar]
- 3.Snyder MC, Bergmanson JP, Doughty MJ. Keratocytes: No more the quiet cells. J Am Optom Assoc. 1998;69:180–187. [PubMed] [Google Scholar]
- 4.Kuwabara T. Current concepts in anatomy and histology of the cornea. Contact Intraocul Lens Med J. 1976;4:101. [Google Scholar]
- 5.Abrams GA, Schaus SS, Goodman SL, Nealy PF, Murphy CJ. Nanoscale topography of the corneal epithelial basement membrane and descemet’s membrane of the human. Cornea. 2000;19:57–64. doi: 10.1097/00003226-200001000-00012. [DOI] [PubMed] [Google Scholar]
- 6.Abrams GA, Goodman SL, Nealey PF, Murphy CJ. Nanoscale topography of the anterior and posterior basement membranes of the human cornea. Invest Ophthal Vis Sci. 1998;39:S760. [Google Scholar]
- 7.Abrams GA, Bentley E, Nealey PF, Murphy CJ. Electron microscopy of the canine corneal basement membranes. Cells Tissues Organs. doi: 10.1159/000047929. Forthcoming. [DOI] [PubMed] [Google Scholar]
- 8.Trinkaus-Randall V, Newton AW, Franzblau C. The synthesis and role of integrins in corneal epithelial cells in culture. Invest Ophthalmol Vis Sci. 1990;31:440–447. [PubMed] [Google Scholar]
- 9.Streuli C, Bissel MJ. Expression of extracellular matrix components is regulated by substratum. J Cell Biol. 1990;110:1405–1415. doi: 10.1083/jcb.110.4.1405. [DOI] [PMC free article] [PubMed] [Google Scholar]
- 10.Blake DA, Yu H, Young DL, Caldwell DR. Matrix stimulates the proliferation of human corneal endothelial cells in culture. Invest Opthalmol Vis Sci. 1997;38:1119–1129. [PubMed] [Google Scholar]
- 11.Abrams G, Teixeria A, Nealey P, Murphy C. The effects of substratum topography on cell behavior. In: Dillow A, Lowman A, editors. Biomimetic Materials and Design: Interactive Biointerfacial Strategies, Tissue Engineering, and Drug Delivery. New York: Marcel Dekker; 2002. pp. 91–136. [Google Scholar]
- 12.Teixeira AI, Abrams GA, Bertics PJ, Murphy CJ, Nealey PF. Epithelial contact guidance on well-defined micro- and nanostructured substrates. J Cell Sci. 2003;116(Part 10):1881–1892. doi: 10.1242/jcs.00383. [DOI] [PMC free article] [PubMed] [Google Scholar]
- 13.Teixeira AI, Nealey PF, Murphy CJ. Responses of human keratocytes to micro- and nanostructured substrates. J Biomed Mater Res A. 2004;71:369–376. doi: 10.1002/jbm.a.30089. [DOI] [PubMed] [Google Scholar]
- 14.Karuri NW, Liliensiek S, Teixeira AI, Abrams G, Campbell S, Nealey PF, Murphy CJ. Biological length scale topography enhances cell-substratum adhesion of human corneal epithelial cells. J Cell Sci. 2004;117:3153–3164. doi: 10.1242/jcs.01146. [DOI] [PMC free article] [PubMed] [Google Scholar]
- 15.Endler EE, Duca KA, Nealey PF, Whitesides GM, Yin J. Propagation of viruses on micropatterned host cells. Biotechnol Bioeng. 2003;81:719–725. doi: 10.1002/bit.10516. [DOI] [PubMed] [Google Scholar]
- 16.Whitesides GM, Ostuni E, Takayama S, Jiang X, Ingber DE. Soft lithography in biology and biochemistry. Annu Rev Biomed Eng. 2001;3:335–373. doi: 10.1146/annurev.bioeng.3.1.335. [DOI] [PubMed] [Google Scholar]
- 17.Jester JV, Ho-Chang J. Modulation of cultured corneal keratocyte phenotype by growth factors/cytokines control in vitro contractility and extracellular matrix contraction. Exp Eye Res. 2003;77:581–592. doi: 10.1016/s0014-4835(03)00188-x. [DOI] [PubMed] [Google Scholar]
- 18.Masur SK, Dewal HS, Dinh TT, Erenburg I, Petridou S. Myofibroblasts differentiate from fibroblasts when plated at low density. Proc Natl Acad Sci USA. 1996;93:4219–4223. doi: 10.1073/pnas.93.9.4219. [DOI] [PMC free article] [PubMed] [Google Scholar]
- 19.Maltseva O, Folger P, Zekaria D, Petridou S, Masur SK. Fibroblast growth factor reversal of the corneal myofibroblast phenotype. Invest Ophthalmol Vis Sci. 2001;42:2490–2495. [PubMed] [Google Scholar]
- 20.den Braber ET, de Ruijter JE, Smits HTJ, Ginsel LA, von Recum AF, Jansen JA. Quantitative analysis of cell proliferation and orientation on substrata with uniform parallel surface microgrooves. Biomaterials. 1996;17:1093–1099. doi: 10.1016/0142-9612(96)85910-2. [DOI] [PubMed] [Google Scholar]
- 21.Abrams GA, Goodman SL, Nealey PF, Franco M, Murphy CJ. Nanoscale topography of the basement membrane underlying the corneal epithelium of the rhesus macaque. Cell Tissue Res. 2000;299:39–46. doi: 10.1007/s004419900074. [DOI] [PubMed] [Google Scholar]
- 22.Martin JY, Schwartz Z, Hummert TW, Schraub DM, Simpson J, Lankford J, Jr, Dean DD, Cochran DL, Boyan BD. Effect of titanium surface roughness on proliferation, differentiation, and protein synthesis of human osteoblast-like cells (MG63) J Biomed Mater Res. 1995;29:389–401. doi: 10.1002/jbm.820290314. [DOI] [PubMed] [Google Scholar]
- 23.Hohn H, Steih U, Denker H. A new artificial substrate for cell culture: Effects of substrate flexibility/malleability on cell growth and morphology. In Vitro Cell Dev Biol. 1995;31A:37–44. doi: 10.1007/BF02631336. [DOI] [PubMed] [Google Scholar]
- 24.Wilkinson CDW, Riehle M, Wood MA, Gallagher J, Curtis ASG. The use of materials patterned on a nano- and micrometric scale in cellular engineering. Mater Sci Eng. 2002;19:263–269. [Google Scholar]
- 25.Curtis ASG, Wilkinson CDW. Reactions of cells to topography. J Biomater Sci Polym Ed. 1998;9:1313–1329. doi: 10.1163/156856298x00415. [DOI] [PubMed] [Google Scholar]
- 26.Dalby MJ, Riehle M, Johnstone H, Affrossman S, Curtis ASG. In vitro reaction of endothelial cells to polymer demixed nanotopography. Biomaterials. 2002;23:2945–2954. doi: 10.1016/s0142-9612(01)00424-0. [DOI] [PubMed] [Google Scholar]
- 27.Fitton JH, Dalton BA, Beumer G, Johnson G, Griesser HJ, Steele JG. Surface topography can interfere with epithelial tissue migration. J Biomed Mater Res. 1998;42:245–257. doi: 10.1002/(sici)1097-4636(199811)42:2<245::aid-jbm9>3.0.co;2-p. [DOI] [PubMed] [Google Scholar]
- 28.Steele JG, Johnson G, McLean KM, Beumer GJ, Griesser HJ. Effect of porosity and surface hydrophilicity on migration of epithelial tissue over synthetic polymer. J Biomed Mater Res. 2000;50:475–482. doi: 10.1002/(sici)1097-4636(20000615)50:4<475::aid-jbm2>3.0.co;2-g. [DOI] [PubMed] [Google Scholar]
- 29.Lee JH, Lee SH, Khang G, Lee HB. Interaction of fibroblasts on polycarbonate membrane surfaces with different micropore sizes and hydrophilicity. Biomater Sci Polym Ed. 1999;10:283–294. doi: 10.1163/156856299x00351. [DOI] [PubMed] [Google Scholar]
- 30.Foley JD, Grunwald EW, Nealey PF, Murphy CJ. Cooperative modulation of neuritogenesis by PC12 cells by topography and nerve growth factor. Biomaterials. 2005;26:3639–3644. doi: 10.1016/j.biomaterials.2004.09.048. [DOI] [PubMed] [Google Scholar]
- 31.den Braber ET, de Ruijter JE, Smits HTJ, Ginsel LA, von Recum AF, Jansen JA. Quantitative analysis of fibroblast morphology on microgrooved surfaces with various groove and ridge dimensions. Biomaterials. 1996;17:2037–2044. doi: 10.1016/0142-9612(96)00032-4. [DOI] [PubMed] [Google Scholar]
- 32.Araki-Sasaki K, Ohashi Y, Sasabe T, Hayashi K, Watanabe H, Tano Y, Handa H. An SV40-immortalized human corneal epithelial cell line and its characterization. Invest Opthalmol Vis Sci. 1995;36:614–621. [PubMed] [Google Scholar]
- 33.Washburn NR, Yamada KM, Simon CG, Kennedy SB, Amis EJ. High-throughput investigation of osteoblast response to polymer crystallinity: Influence of nanometer-scale roughness on proliferation. Biomaterials. 2004;25:1215–1224. doi: 10.1016/j.biomaterials.2003.08.043. [DOI] [PubMed] [Google Scholar]
- 34.Hatano K, Inoue M, Matsunaga T, Tsujisawa C, Uchiyama C, Uchida Y. Effect of surface roughness on proliferation and alkaline phosphatase expression of rat calvarial cells cultured on polystyrene. Bone. 1999;25:439–445. doi: 10.1016/s8756-3282(99)00192-1. [DOI] [PubMed] [Google Scholar]
- 35.Ruoslahti E. Stretching is good for a cell. Science. 1997;276:1345–1346. doi: 10.1126/science.276.5317.1345. [DOI] [PubMed] [Google Scholar]
- 36.Chen CS, Mrksich M, Huang S, Whitesides G, Ingber DE. Geometric control of cell life and death. Science. 1997;276:1425–1428. doi: 10.1126/science.276.5317.1425. [DOI] [PubMed] [Google Scholar]
- 37.Chou L, Firth JD, Uitto V-J, Brunette DM. Substratum surface topography alters cell shape and regulates fibronectin mRNA level, mRNA stability, secretion and assembly in human fibroblasts. J Cell Sci. 1995;108:1563–1573. doi: 10.1242/jcs.108.4.1563. [DOI] [PubMed] [Google Scholar]