Abstract
We have previously shown that human corneal epithelial cells sense and react to nanoscale substrate topographic stimuli [Teixeira AI, Abrams GA, Bertics PJ, Murphy CJ, Nealey PF. Epithelial contact guidance on well-defined micro- and nanostructured substrates. J Cell Sci 2003;116(10):1881–92; Karuri NW, Liliensiek S, Teixeira AI, Abrams G, Campbell S, Nealey PF, et al. Biological length scale topography enhances cell-substratum adhesion of human corneal epithelial cells. J Cell Sci 2004;117(15):3153–64]. Here we demonstrate that cellular responses to nanoscale substrate topographies are modulated by the context in which these stimuli are presented to cells. In Epilife medium, cells aligned preferentially in the direction perpendicular to nanoscale grooves and ridges. This is in contrast to a previous study where cells cultured in DMEM/F12 medium aligned in the direction parallel to nanoscale topographic features [Teixeira AI, Abrams GA, Bertics PJ, Murphy CJ, Nealey PF. Epithelial contact guidance on well-defined micro- and nanostructured substrates. J Cell Sci 2003;116(10):1881–92]. Additionally, cell alignment in Epilife medium was dependent on pattern pitch. Cells switched from perpendicular to parallel alignment when the pitch was increased from 400 to 4000 nm. There was a transition region (between 800 and 1600 nm pitch) where both parallel and perpendicular alignments were favored compared to all other cellular orientations. Cells formed focal adhesions parallel to the substrate topographies in this transition region. On the nano- and microscale patterns, 400 and 4000 nm pitch, focal adhesions were almost exclusively oriented obliquely to the topographic patterns.
Keywords: Nanotopography, Grooves and ridges, Alignment, Focal adhesions, Corneal epithelial cells
1. Introduction
Controlling cell behavior is of critical importance for tissue engineering, toxicology screening, the production of pharmaceuticals, and the design of prosthetic devices. In general, experiments are performed varying one parameter and controlling all other cellular inputs to identify and determine the relative importance of factors that elicit different cellular responses. Here, we underscore the importance of the context in which inputs are presented to cells in shaping cellular responses. In vivo, epithelial cells adhere to the underlying stroma through a basement membrane that possesses a complex felt-like topography with feature dimensions in the nanometer and submicron length scales [1–5]. Many cell types have been shown to respond to substratum features [6,7]. Due to historical constraints in fabrication technology, the majority of these studies investigated the impact of larger sized (⩾1 μm) features that greatly exceed the dimensional values of features of the extracellular matrix that cells interact with in vivo [6]. Hypothesizing the importance of the biologic length scale of topographic features in the design of substrates that support cell function, we have previously shown that well-defined synthetic substrate topographies of nanoscale and sub-micron dimensions modulate human corneal epithelial cell (HCEC) behaviors such as morphology and cell orientation [1]. This work and that of others suggests that the physical topographic environment should be considered a fundamental cell stimulus [6].
Synthetic substrates with well-defined anisotropic topographies and chemistries have proven to be very effective in determining whether cells sense and react to topographic inputs [1]. HCECs elongated and aligned along patterns of 400 nm pitch (70 nm wide ridges), whereas cells cultured on smooth substrates were mostly round [1]. This response could be easily detected and quantified using optical microscopy and image analysis of cells. The finding that substratum nanotopography can modulate cell orientation and shape is significant because it is well documented that cell shape can be predictive of cell fate [8].
Of critical biological relevance is information concerning how numerous individual inputs such as topographic cues act in the context of all of the stimuli being simultaneously integrated by cells that ultimately result in specific behaviors. Several reports in the literature illustrate the importance of context on cellular responses to individual stimuli. We have previously shown that nanoscale topography can cooperate with sub-optimal growth factor signaling to promote neuritogenesis in PC12 cells [9]. In addition, the in vivo cellular response to many growth factors can be spatially and temporally controlled through their association with extracellular matrix molecules [10].
In this study, we demonstrate that the lateral dimensions of the substrate features dictate the alignment responses of primary HCECs in Epilife culture medium. Specifically, we find that the orientation preference of HCECs shifts from parallel to perpendicular alignment as feature sizes decrease from micron to nanoscale dimensions. This differs from our previous work, in which HCECs cultured in DMEM/F12 medium aligned parallel to grooves and ridges regardless of feature size [1]. These findings suggest that soluble factors within the culture medium can cooperate with the scale of the substratum features to alter cellular behaviors. Further, they underscore the importance of the design and use of synthetic substrates that provide biomimetic, nanoscale to submicron topographic features. These findings have relevance to our fundamental understanding of topographic control of cell behavior and have application in the development of novel strategies in tissue engineering and the development of prosthetic devices.
2. Materials and methods
2.1. Fabrication of microstructured and nanostructured substrates
Patterns of grooves and ridges of micrometer and nanometer scale dimensions were fabricated by the sequential use of electron-beam lithography, reactive ion etching and low-pressure chemical vapor deposition (LPCVD) as previously described [1]. The patterned wafers were cut with a diamond saw into chips containing patterned fields separated by smooth areas. Each chip consisted of an array of six 4 mm2 patterned fields with pitches ranging from 400 to 4000 nm (Table 1). The depth of the topographic features was 600 nm. These chips were placed in the bottom of 24 well tissue culture polystyrene (TCPS) plates, rinsed with deionized water and sterilized in ethanol prior to use.
Table 1.
Dimensions of the topographic features of the substrates
| Pitch (nm) | Ridge width (nm) | Groove width (nm) |
|---|---|---|
| 400 | 70 | 330 |
| 800 | 250 | 550 |
| 1200 | 400 | 800 |
| 1600 | 650 | 950 |
| 2000 | 850 | 1150 |
| 4000 | 1900 | 2100 |
Groove depth: 600 nm.
2.2. Cell culture
Primary human corneal epithelial cells were harvested as previously described [1]. The resulting cell suspension was centrifuged and the cells were re-suspended in Epilife® basal medium (Cascade Biologics, Portland, OR) with a growth supplement of defined composition. The growth supplement contained purified bovine serum albumin, purified bovine transferrin, hydrocortisone, recombinant human insulin-like growth factor type-1, prostaglandin E2 and recombinant human epidermal growth factor (EDGS, Cascade Biologics). Cells were expanded in T25 culture cultures flasks (Becton Dickinson) and were harvested using 0.025% Trypsin/0.01% EDTA (Cascade Biologics), after reaching approximately 80% confluency. Trypsin neutralization was done with a phosphate buffered saline solution containing 0.025% purified soybean trypsin inhibitor (Cascade Biologics). Cells were centrifuged and re-suspended in Epilife medium supplemented with EDGS. Next, cells were plated at a density of 8500 cells/cm2 in 24 well plates containing the patterned silicon chips (except for focal adhesion analysis experiments where the density used was 50,000 cells/cm2).
After 12h of incubation at 37 °C and 5% CO2, the medium was removed and the cells were rinsed with DPBS and fixed with 4% paraformaldehyde, 5% sucrose for 20 min. Next, the cells were permeabilised with 0.1% Triton X-100 for 5 min, immersed in 1% bovine serum albumin for 20 min and incubated with 5 μg/ml of TRITC-phalloidin (Sigma Chemical Co.) for 30 min. TRITC-Phalloidin stains filamentous actin and we found that we could obtain an accurate representation of the cell outline with this stain, as confirmed by simultaneously staining the cell membrane with thiosemicarbazide (Molecular Probes, Eugene, OR). Cell nuclei were stained using 90 nM of DAPI (Molecular Probes) in DPBS for 10 min. Finally, the substrates were glued onto glass slides and Prolong (Molecular Probes) mounting medium was added to the cell side of the substrates before covering them with glass coverslips.
Vinculin staining was used as a marker for focal adhesions. After staining F-actin as described above, cells were incubated with mouse antihuman vinculin antibody (Sigma Chemical Co.) for 45 min at 37 °C. The secondary antibody used was donkey anti-mouse IgG (Jackson ImmunoResearch Laboratories Inc., West Grove, PA).
2.3. Quantification of cell shape and orientation
We analyzed the shape and orientation of all cells adhering to 1.03 × 1.30 mm2 regions in the center of each of the patterned fields in each chip. Similar regions were also analyzed on a smooth area of the same chip and on the TCPS well containing the chip. Images of the stained cells were obtained from an epifluorescence microscope (Nikon TE300, Melville, NY) with an objective magnification of 20 × and montages of 2×2 images were created. All images were converted to binary images using Metamorph™ software (Universal Imaging Corporation, Downingtown, PA). The area of all cells in the images was then automatically measured. The length of the cells, defined as their longest cord, and the cell breadth, the longest chord perpendicular to the length, were also obtained from Methamorph™. Cell elongation was defined as the ratio between the length and breadth of each cell. Cell orientation angle was calculated as the angle between the direction of the longest chord in the cell and the direction of the patterns. The cells were considered to be aligned parallel to the grooves when this angle was less than 10°. When the cell orientation angle was between 80 and 90° cells were considered aligned perpendicular to the pattern direction. On a population of randomly oriented cells, the distribution of orientation angles is uniform and the percentage of cells with orientation angles within any 10° interval with a range of 90° is 11%. The DAPI images assisted in determining if cells formed clumps or were isolated. All cells in contact with other cells were manually removed from the data sets. All experiments were repeated and ten samples were used in each trial. This resulted in the analysis of over 600 cells for each of the pattern dimensions and culture conditions.
2.4. Quantification of focal adhesion period and orientation
The cells were seeded at a density of 50,000 cells/cm2 and were incubated for 12 h at 37 °C and 5% CO2. Next, cells were stained with anti-vinculin antibody (green), TRITC-phalloidin (red), and DAPI (blue), as described above. All cells that formed focal adhesions, in each of the patterned fields, were imaged at a magnification of 100 ×, (about 25 cells/field). Reflection images of the underlying substrate were also obtained, for each cell. Of the cells that formed focal adhesions, we computed the percentage of cells with focal adhesions aligned parallel to the patterns. The percentage of cells with oblique focal adhesions was further divided into cells with focal adhesions confined to one ridge or extending over multiple ridges. These percentages do not add up to 100 because many cells had both aligned and oblique focal adhesions. Similarly, we calculated the percentages of cells where the focal adhesions and stress fibers were not co-aligned (“angled focal adhesion and stress fibers”). The center-to-center distance of adjacent focal adhesions was determined for all cells presenting focal adhesions. The fluorescence intensity profiles in the direction perpendicular to the long axes of the focal adhesions were determined using Image J software. These profiles were fitted with Gaussian curves using Origin software (OriginLab Corporation, Northampton, MA). The distance between the centers of adjacent curves provided a measure of the focal adhesion pitch.
2.5. Imaging cell morphology using scanning electron microscopy
Substrates with adherent human corneal epithelial cells were rinsed in 0.1M cacodylate buffer and fixed in 3% glutaraldehyde in cacodylate buffer (Tousimis Co.) for 2.5 h. The cells were then sequentially post-fixed in 1% osmium tetroxide (Tousimis Co.) and in 1% tannic acid. Finally, cells were dehydrated in graded ethanols, immersed in hexamethyldisilazane for 10 min, air-dried and coated with 2 nm of platinum. A Leo 1530 field emission scanning electron microscope was used to acquire the images (Leo Electron Microscopy Inc.) Cells were qualitatively examined for overall cell shape and for the presence and orientation of filopodia.
3. Results
3.1. In Epilife culture medium, cells aligned perpendicularly to nanoscale and parallel to microscale ridges
We used X-ray lithography to pattern silicon surfaces with grooves and ridges of varying dimensions. Each chip contained six patterned areas with pitches (ridge width + groove width) from 400 to 4000 nm and ridge widths of 70–1900 nm, respectively (Table 1). The depth of the grooves was 600 nm. Cells cultured on surfaces patterned with 400 nm pitch features (70 nm ridge widths) aligned preferentially in the direction perpendicular to the topographic patterns (Figs. 1(A) and 2(A)). In contrast, on patterns with pitches in the micrometer range, 2000 and 4000 nm (850 and 1900 nm ridges), cells aligned parallel to patterns (Figs. 1(B), 2(E) and (F)). On substrate topographies of intermediate pitch (ridge widths of 250, 400 and 650 nm), the percentages of cells aligned perpendicularly and parallel to the grooves and ridges were equivalent (Figs. 1(C) and 2(B)–(D)). The distribution of orientation angles was, nonetheless, not uniform and the parallel and perpendicular directions were favored compared to all other orientations. On the smooth substrates, both on silicon oxide and TCPS, cells were randomly oriented and the distributions of cell orientation angles were uniform (Figs. 1(D), 2(G) and (H)). Cellular alignment was therefore different in three distinct regions of pattern pitches; perpendicular alignment on 400 nm pitch, co-existence of parallel and perpendicular alignment on patterns with pitches of intermediate dimensions and parallel alignment on microscale patterns (Fig. 3). We have previously shown that HCECs cultured in DMEM/F12 medium aligned parallel to the grooves and ridges at all feature sizes [1]. To rule out the possibility that the differences in cell alignment observed between the two studies were due to variations between specific primary cell cultures, we repeated the DMEM/F12 experiments in parallel with experiments using Epilife medium, with the same batch of cells. We found that the cells again aligned with all feature sizes on DMEM/F12 (data not shown). This indicates that the different alignment responses are due to differences in the culture medium and not to different cell populations (Figs. 1–3).
Fig. 1.
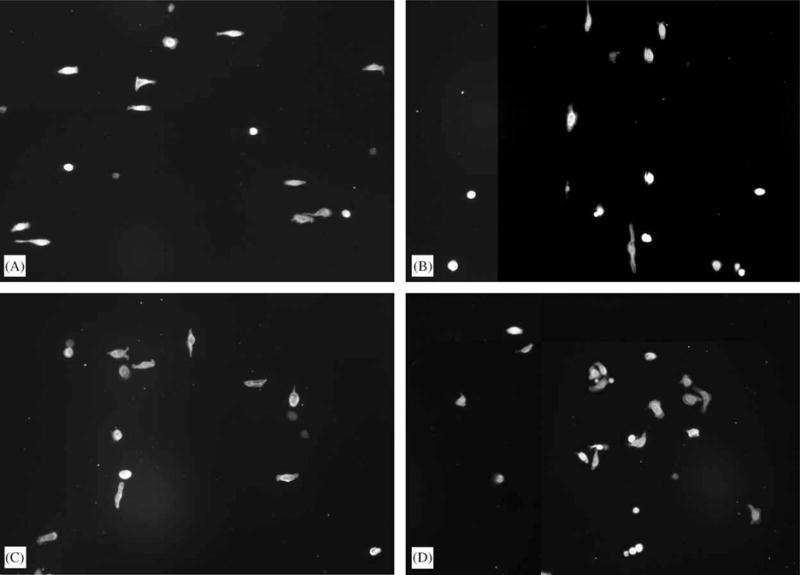
Fluorescence images of cells stained for actin. The patterns were oriented in the vertical direction. (A) On 70 nm ridges on a 400 nm pitch, cells aligned preferentially in the direction perpendicular to the patterns. (B) Cells aligned in the direction of the patterns on 1900 nm ridges on a 4000 nm pitch. (C) On 400 nm ridges on a 1200 nm pitch, cells aligned both parallel and perpendicularly to the patterns. (D) On smooth substrates cells were randomly oriented.
Fig. 2.
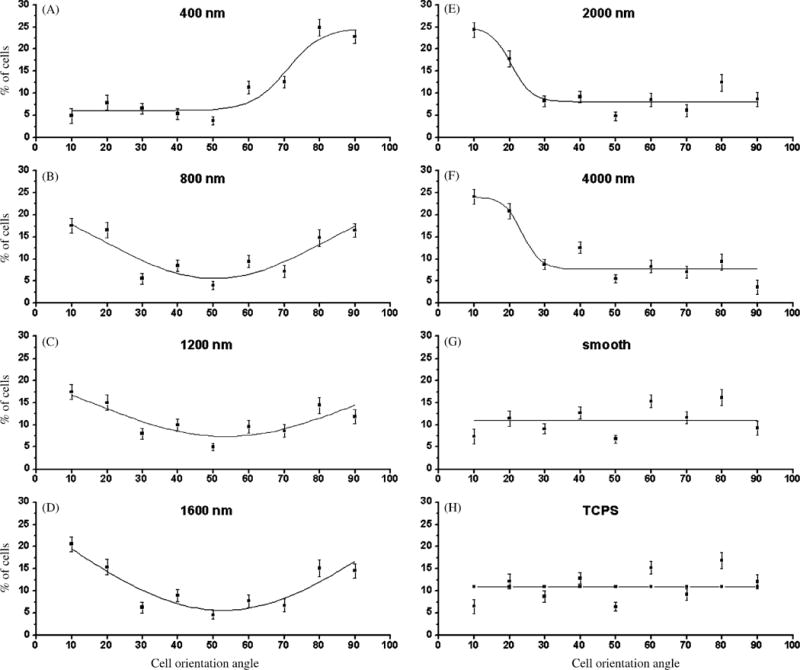
The orientation angle distributions on all patterned substrates deviated significantly from a uniform distribution. The orientation angle of a cell is the angle between the longest chord in the cell and the direction of the patterns. The plots show the percentage of cells with orientation angles within the 10-degree angle intervals indicated in the x-axis. (A) Cells oriented perpendicularly to 400 nm pitch patterns. (B–D) On patterns with 800, 1200, and 1600 nm pitches, cells aligned both parallel and perpendicularly to the grooves and ridges. (E, F) On 2000 and 4000 nm pitch substrates, cells oriented parallel to the substrate patterns. (G, H) On smooth silicon oxide and TCPS cells were randomly oriented and the distribution of cell orientation angles was uniform.
Fig. 3.
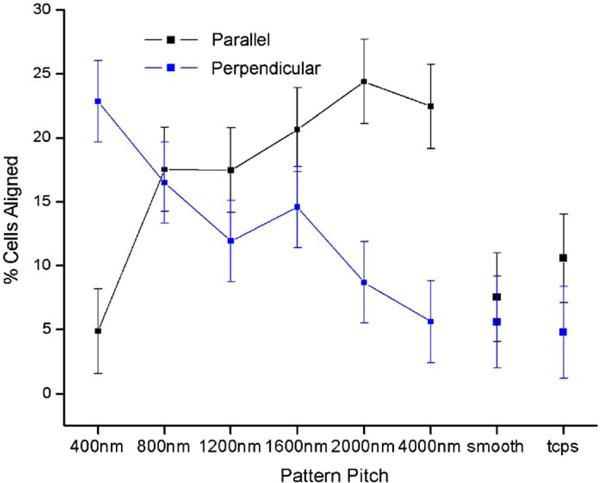
Cells aligned perpendicular to nanoscale ridges and parallel to microscale patterns. Parallel and perpendicular alignments co-existed on patterns with pitches of intermediate dimensions.
3.2. On patterned surfaces, aligned cells were more elongated on average than non-aligned cells or cells on smooth surfaces
On all patterned substrates, at a population level, preference for parallel and/or perpendicular alignment was associated with larger average elongations for cells with these orientations compared to non-aligned cells or cells on smooth substrates. Cells aligned perpendicular to 400, 800, 1200, and 1600 nm pitch patterns (70–650 nm ridges) were significantly more elongated than non-aligned cells on patterned surfaces or cells on smooth silicon oxide or on TCPS. On the large-scale patterns (2000 and 4000 nm pitch), where perpendicular alignment is not favored, cells that had orientation angles perpendicular to the patterns showed average elongations similar to those of cells cultured on the smooth substrates (SiOx and TCPS). Cells that aligned parallel to all of the patterned substrates were significantly more elongated on average than cells cultured on the smooth substrates (data not shown). On 400 nm pitch patterns, cells did not favor the parallel direction but the average elongation of cells that did orient parallel to the patterns was slightly higher than that of cells on smooth substrates. There were no differences between the average elongations of non-aligned cells on all patterned substrates and those of cells on the smooth surfaces.
On all surfaces, all elongated cells (major axis/minor axis ⩾1.3) were well spread (cell areas ⩾600 μm2). On the patterned substrates, regardless of pitch, the great majority of well spread cells were elongated with fewer than 10% of the cells being round. The remaining cells were not elongated or spread having the typical appearance of being “rounded up” when viewed by phase contrast microscopy or SEM (data not shown). By analyzing all cells on all surfaces it was found that average cell areas were larger on TCPS than on silicon oxide coated substrates. Conversely, the percentage of rounded up cells was larger on smooth and patterned silicon oxide than on TCPS.
3.3. Perpendicularly aligned cells on 400 nm pitch (70 nm ridges) extended filopodia both parallel and perpendicular to the patterns
Cells oriented perpendicular to 400 nm pitch patterns (70 nm ridges) extended filopodia in a crown-like fashion with individual filopodia having orientations that were perpendicular, oblique or parallel to the underlying pattern (Figs. 4(A) and (B)). In contrast, in cells that were aligned parallel to larger scale patterns (4000 nm pitch, 1900 nm ridges), filopodia were generally guided by the substrate topographies resulting in most filopodia extending parallel to the underlying features (Figs. 4(C) and (D)).
Fig. 4.
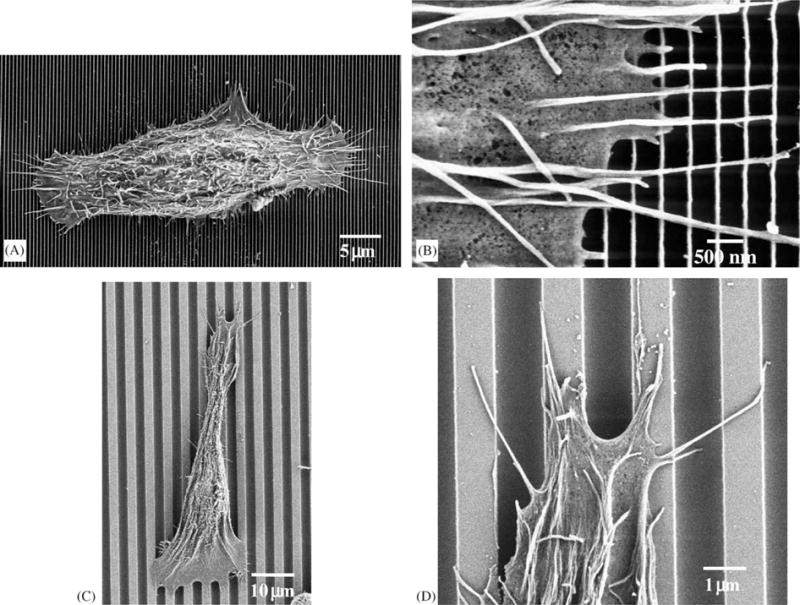
SEM images of cells cultured on patterned substrates. (A) Perpendicularly aligned cell on 70 nm wide ridges on a 400 nm pitch. (B) Detail of previous cell. Filopodia were aligned perpendicularly to the patterns. We also observed filopodia aligned along the patterns. (C) Parallel aligned cell on 1900 nm ridges on a 4000 nm pitch. (D) Filopodia were guided by the topographic pattern.
3.4. Focal adhesions did not align parallel to patterns with pitches below 800 nm or above 2000 nm
Focal adhesions were observed only sporadically in cells cultured on both patterned and smooth silicon oxide as well as smooth TCPS substrates. Because relatively few focal adhesions were observed, no attempt was made to correlate cell alignment with the orientation of focal adhesions. Of interest was the finding that cellular alignment (parallel or perpendicular) was not contingent upon the presence of focal adhesions.
On substrates where the pitch was 400 nm (70 nm ridges), cells were aligned predominantly perpendicular to the underlying pattern (see Fig. 3) and the dominant focal adhesion orientation was oblique. All focal adhesions were observed to extend over multiple grooves and ridges (Figs. 5(A) and 6).
Fig. 5.

Overlay of fluorescence images of aligned and oblique focal adhesions and reflection images of the underlying substrates. (A) 400 nm pitch. Focal adhesions were primarily obliquely orientated relative to the pattern direction. (B) 1200 nm pitch. Parallel focal adhesions were predominant. (C) 4000 nm pitch. Focal adhesions were obliquely oriented relative to the patterns.
Fig. 6.
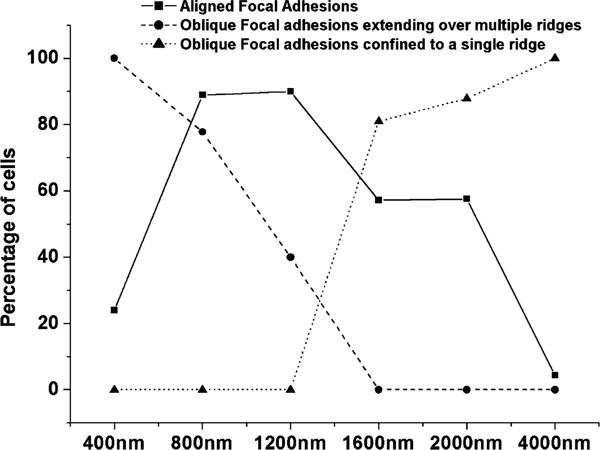
Pattern dimensions determined the preferred focal adhesion orientations. Parallel focal adhesions were present on substrates with pitches of 800, 1200, 1600, and 2000 nm but not on 400 and 4000 nm pitch substrates. Obliquely oriented focal adhesions extended over multiple grooves on 400, 800, and 1200 nm pitch but were confined to single ridges on 1600, 2000, and 4000 nm pitch substrates. Percentages are relative to the total number of cells that formed focal adhesions.
On ubstrates of 800 nm pitch (250 nm ridges), where the transition in cell alignment from perpendicular to parallel is first observed, focal adhesion alignment was observed to be approximately equally distributed between the parallel and oblique directions. Many individual cells contained focal adhesions of both orientations.
For 1200 nm pitch patterns (400 nm ridges), in which cells were aligned both perpendicular and parallel to the pattern (see Fig. 3), focal adhesions were aligned largely parallel to the underlying pattern (Figs. 5(B) and 6).
On substrates with pattern pitches of 1600 and 2000 nm (650 and 850 nm ridges, respectively), where a greater percentage of cells became aligned parallel to the underlying pattern, focal adhesions were predominantly obliquely oriented relative to the substrate topographies. On these features, focal adhesions were confined to single ridges regardless of their orientation.
On 4000 nm pitch patterns, upon which cells were oriented primarily parallel to the underlying pattern, focal adhesions were almost exclusively obliquely oriented relative to the topographic patterns (Figs. 5(C) and 6). Oblique focal adhesions differed from those found on patterns with smaller ridges in that they were confined to a single 1900 nm ridge rather than extending over multiple ridges.
3.5. Parallel focal adhesions had the same pitch as the underlying pattern, but the pitch of oblique focal adhesions was similar on all surfaces irrespective of pattern pitch
We defined focal adhesion pitch as the peak-to-peak distance of the intensity profiles associated with the fluorescently labeled focal adhesions. Focal adhesion pitch and surface pattern pitch were similar for focal adhesions aligned parallel to the patterns (with pitches of 800, 1200, 1600, and 2000 nm) (Fig. 7). In contrast, obliquely oriented focal adhesions possessed similar pitches irrespective of the pitch of the underlying patterned substrate. Therefore, the pitch of oblique focal adhesions did not depend on whether focal adhesions extended over multiple ridges or were confined to a single ridge. Moreover, the pitch of oblique focal adhesions on the patterned surfaces was similar to the pitch of focal adhesions on smooth silicon oxide.
Fig. 7.
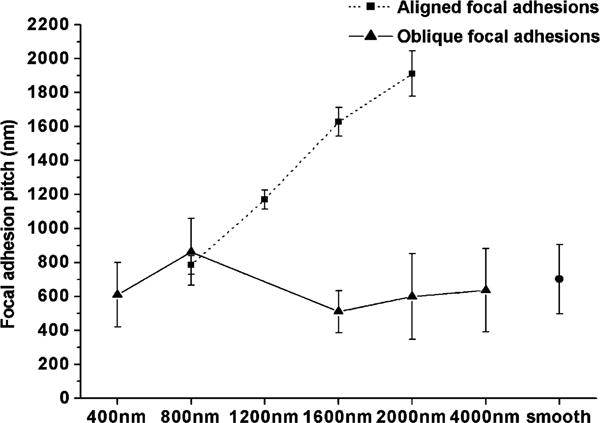
The pitch of focal adhesions (center to center distance of adjacent focal adhesions) was similar on all patterned substrates for obliquely oriented focal adhesions. Focal adhesions aligned parallel to the grooves and ridges had the same pitch as the underlying substrate patterns.
3.6. The orientation of stress fibers relative to focal adhesions varies with pattern pitch
On the smooth substrates, stress fibers were found to be always aligned parallel to focal adhesions. Though difficult to visualize in all cases, on the patterned substrates, stress fibers were also largely co-aligned with focal adhesions that, themselves, were obliquely oriented relative to the underlying patterns (spanning one or multiple ridges). In contrast, a range of stress fiber orientations relative to focal adhesions were found for focal adhesions that were oriented parallel to substrate patterns (800, 1200, 1600, and 2000 nm pitch) (Figs. 8 and 9).
Fig. 8.
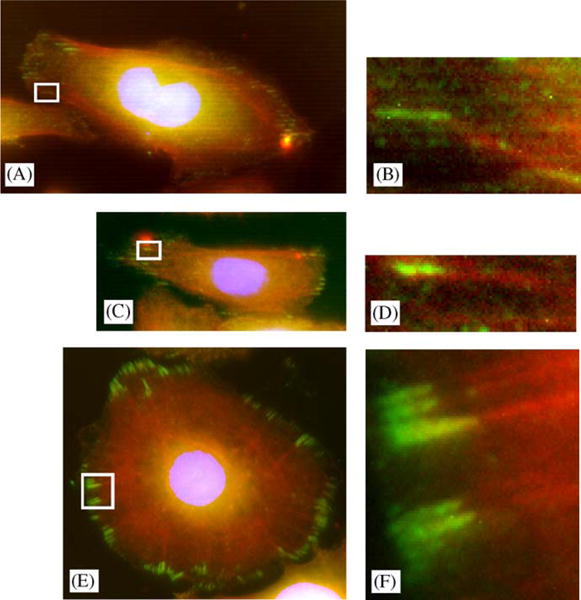
Stress fibers were sometimes angled relative to focal adhesions that were aligned parallel to the substrate topographies. (A, B) Cell on 400 nm ridges on a 1200 nm pitch. Focal adhesion (green) and stress fiber (red) were oriented at an angle. (C, D) 1200 nm pitch. Focal adhesion co-aligned with stress fiber. (E, F) Focal adhesion co-aligned with stress fibers in a cells cultured on smooth silicon oxide.
Fig. 9.
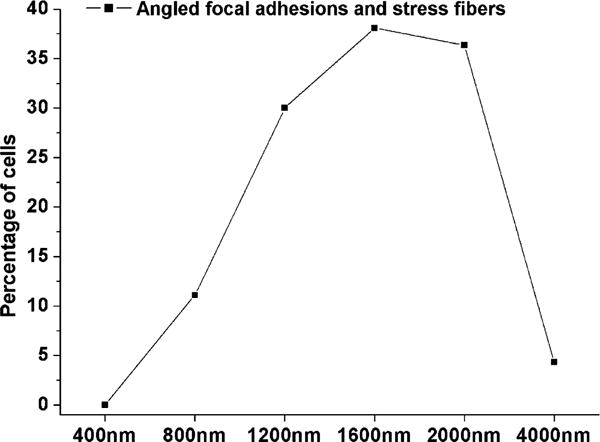
Percentage of cells with angled focal adhesions and stress fibers, relative to the total number of cells with focal adhesions. Focal adhesions and stress fibers were angled only on substrates that supported parallel aligned focal adhesions.
4. Discussion
We have shown that the scale of the substratum features dictates HCEC alignment responses in Epilife cell culture medium. This stands in sharp contrast to our previous study in which primary HCECs cultured in a different medium, DMEM/F12, aligned parallel to grooves and ridges regardless of feature size [1]. Together, these data show that HCEC alignment responses are context dependent for cells on nanoscale topographic stimuli, but not for those on micron scale.
How topographic cues and soluble factors in the culture medium cooperate to bring about differential cellular responses remains undefined. Soluble factors could directly promote a given orientation in response to topographic cues or could turn off inhibitory mechanisms thus allowing cells to alter their responsiveness. We compared the composition of DMEM/F12 and Epilife basal mediums using mass spectrometry and material data sheets (provided by Cascade Biologics). We identified seventeen differences in composition between the two mediums (Supplementary materials, Table S1). Among the differing components of the basal mediums are buffering agents, trace metals (Supplementary materials, Table S2), nucleotide bases, components of metabolic pathways, a vitamin and an essential fatty acid. Epilife was used in combination with Epilife defined growth supplement (EGDS), which contains six components (see Section 2), including two growth factors (IGF and EGF) that are known to affect HCEC behaviors [11,12]. However, these are also likely to be found in FBS which, when added to DMEM/F12, did not alter alignment responses. Buffering agents do not appear to be a factor, as cell culture pH remained constant regardless of medium (data not shown). Of particular interest for future analyses are: (1) the role of inorganic compounds in the medium that could alter matrix-receptor binding activities and (2) components of lipid biosynthetic pathways which could alter the composition of lipid sub-domains that affect cell-substrate interactions and signal transduction pathways [13,14]. Combinatorial analysis with these factors should shed light on which component(s) results in the differences between the two mediums in cellular behaviors on nanoscale features.
Ultimately, we would like to determine how nanoscale topography and medium components affect intracellular processes resulting in scale-dependent alignment responses. Obvious candidates would include biomechanical and/or biochemical affects. The ability of cells to sense and respond to topography may be mediated partly by filopodia. We found that the orientations of filopodia relative to the patterns were dependent on the cell culture medium on nanoscale but not on microscale patterns. In Epilife, cells cultured on 400 nm pitch patterns (70 nm ridges) extended numerous filopodia perpendicular to the patterns, along the cells’ major axes. In many cases the filopodia were observed to extend across several ridges and were not contact guided by features they encountered (i.e. they did not assume a course parallel to the substrate). In DMEM/F12, filopodia were typically aligned parallel to the patterns. In these cases, filopodia that extended out perpendicular to the long axis of the cell would subsequently assume a course parallel to surface features they encountered. Cells cultured on ridges that exceeded 1 μm, produced filopodia that were guided by the topographic patterns in both Epilife and DMEM/F12 mediums. Filopodial alignment along the topographic patterns may be involved in the generation of anisotropic traction forces that lead to cellular elongation and alignment parallel to the patterns [1]. Therefore, on submicron topographic features the presence of filopodia that bridge the grooves and ridges and are not guided along the features may play a role in the ability of cells to align perpendicular to nanoscale grooves and ridges. HCECs, as other epithelia, exist in vivo as sheets and not as individual cells. However, both colonies of corneal epithelial cells [15] and corneal explants [16,17] have been shown to respond to anisotropic substrate topographies, albeit less strongly than individual cells.
Scale-dependent transitions have been observed in other studies where it was suggested that these effects may be mediated by modulation of signal transduction pathways. We have reported that PC12 cell neurite formation is enhanced on nanoscale features [9]. However, this only occurred when the concentrations of nerve growth factor used to induce neurite formation were reduced below the normal induction concentration of 50 ng/ml. These findings suggested that nanoscale cueing could augment subthreshold levels by growth factors. Rajnicek et al. [18] reported hippocampal neurons transition from parallel to perpendicular alignment with decreasing pattern pitch, albeit on topographies with dimensions about an order of magnitude larger than the ones used in the present study. It was later shown that the shift to perpendicular alignment required the influx of calcium through voltage gated channels and protein kinase C activity [19]. Interestingly, these signaling events were found to be necessary for perpendicular but not for parallel alignment. Therefore, different signaling pathways were proposed to be involved in the transduction of the topographic signals into the parallel or perpendicular alignment responses.
Focal adhesions function not only as adhesion sites but also as mediators of adhesion-dependent signaling [20] and growth control [21]. In addition, the shape and size of focal adhesions have been correlated with the force exerted on the underlying substrate [22]. Therefore, scale-dependent effects of substrate topography on focal adhesion orientation, pitch, and possibly ultrastructure may have an impact on cell adhesion and on signal transduction through focal adhesions. We found that focal adhesions formed by cells cultured on patterns with lateral dimensions in the transition region between the nano- and micron length scales had unique properties. On substrates with pitches between 800 and 2000 nm (ridge widths of 250 and 850 nm, respectively), focal adhesions were aligned either parallel or oblique to the substrate topographic patterns and both orientations were sometimes observed in the same cell. On patterns with narrower or wider ridges (70 and 1900 nm, respectively), focal adhesions were almost exclusively oriented oblique to the topographic patterns. Because of their size relative to the substratum features, the ultrastructure of the obliquely oriented focal adhesions may differ. Oblique focal adhesions extended over multiple ridges in cells cultured on substrates with ridge widths of 400 nm or less, but were confined to single ridges on substrates with ridge widths larger than 650 nm. We have previously shown [1] that cells bridge the grooves, on all patterns, limiting integrin binding to substrate-adsorbed proteins to the top of the ridges. Therefore, on the nanoscale patterns, integrin occupancy within a focal adhesion may be spatially segregated whereas on microscale ridges there are no constraints on integrin-ligand binding within individual focal adhesions.
The sub-population of parallel-aligned focal adhesions had pitches that closely matched those of the underlying substrate topographies. In contrast, the pitches of oblique focal adhesions were similar on all the patterned substrates and were equivalent to the pitch of focal adhesions on the smooth substrates. Additionally, stress fibers were often not co-aligned with focal adhesions parallel to the patterned topographies. On smooth substrates focal adhesions and stress fibers were always oriented in the same direction. Stress fibers exert tension forces on the underlying substrate through focal adhesions [23]. The angled geometry between focal adhesions and parallel-aligned stress fibers conceivably alters the magnitude of the applied forces.
5. Conclusions
We conclude that cellular responses to nanoscale and submicron topographic cues are context dependent. Here we show that HCECs, cultured in Epilife medium, elongate and align perpendicular to patterns of grooves and ridges of nanoscale dimensions. In contrast, we have previously shown that HCECs cultured on similar substrates but in a different medium, DMEM/F12, align parallel to the topographic features [1]. In addition, responses to nanoscale substrate topography are fundamentally different from responses to microscale features or to smooth substrates. HCECs cultured in Epilife medium change from parallel to perpendicular alignment as the feature sizes decrease from micron to nanoscale dimensions. This shift in alignment is accompanied by changes in focal adhesion structure. These findings have relevance to the interpretation of in vitro investigations, typically carried out on smooth substrates. Additionally, the incorporation of nanoscale topographic features similar to those found in the native basement membrane, should be considered in the development of prosthetic devices that require biointegration and in the engineering of cellular environments that contain appropriate cues to obtain desired cellular responses.
Supplementary Material
Acknowledgments
This work was supported by Grants from the National Eye Institute (RO1 EY 012253-01) and NSF MRSEC (DMR-9632527). A.I.T. gratefully acknowledges a predoctoral fellowship from the Portuguese Foundation for Science and Technology. Facilities at the Center for Nanotechnology at the University of Wisconsin–Madison are supported in part by DARPA/ONR Grant number N00014-97-1-0460. The authors thank the Wisconsin and Missouri Lions Eye Banks for providing corneas.
Appendix A. Supplementary materials
Supplementary data associated with this article can be found in the online version at doi:10.1016/j.biomaterials.2006.01.044.
References
- 1.Teixeira AI, Abrams GA, Bertics PJ, Murphy CJ, Nealey PF. Epithelial contact guidance on well-defined micro- and nanostructured substrates. J Cell Sci. 2003;116(10):1881–92. doi: 10.1242/jcs.00383. [DOI] [PMC free article] [PubMed] [Google Scholar]
- 2.Karuri NW, Liliensiek S, Teixeira AI, Abrams G, Campbell S, Nealey PF, et al. Biological length scale topography enhances cell-substratum adhesion of human corneal epithelial cells. J Cell Sci. 2004;117(15):3153–64. doi: 10.1242/jcs.01146. [DOI] [PMC free article] [PubMed] [Google Scholar]
- 3.Abrams GA, Bentley E, Nealey PF, Murphy CJ. Electron microscopy of the canine corneal basement membranes. Cells Tissues Organs. 2002;170(4):251–7. doi: 10.1159/000047929. [DOI] [PubMed] [Google Scholar]
- 4.Abrams GA, Goodman SL, Nealey PF, Franco M, Murphy CJ. Nanoscale topography of the basement membrane underlying the corneal epithelium of the rhesus macaque. Cell Tissue Res. 2000;299(1):39–46. doi: 10.1007/s004419900074. [DOI] [PubMed] [Google Scholar]
- 5.Abrams GA, Schaus SS, Goodman SL, Nealey PF, Murphy CJ. Nanoscale topography of the corneal epithelial basement membrane and Descemet’s membrane of the human. Cornea. 2000;19(1):57–64. doi: 10.1097/00003226-200001000-00012. [DOI] [PubMed] [Google Scholar]
- 6.Abrams GA, Teixeira AI, Murphy CJ, Nealey PF. Effects of substratum topography on cell behavior. In: Dillow AK, Lowman AM, editors. Biomimetic materials and design: biointerfacial strategies, tissue engineering and targeted drug delivery. New York: Marcel Dekker; 2002. pp. 91–138. [Google Scholar]
- 7.Flemming RG, Murphy CJ, Abrams GA, Goodman SL, Nealey PF. Effects of synthetic micro- and nano-structured surfaces on cell behavior. Biomaterials. 1999;20:573–88. doi: 10.1016/s0142-9612(98)00209-9. [DOI] [PubMed] [Google Scholar]
- 8.Chen CS, Mrksich M, Huang S, Whitesides G, Ingber DE. Geometric control of cell life and death. Science. 1997;276:1425–8. doi: 10.1126/science.276.5317.1425. [DOI] [PubMed] [Google Scholar]
- 9.Foley JD, Grunwald EW, Nealey PF, Murphy CJ. Cooperative modulation of neuritogenesis by PC12 cells by topography and nerve growth factor. Biomaterials. 2005;26(17):3639–44. doi: 10.1016/j.biomaterials.2004.09.048. [DOI] [PubMed] [Google Scholar]
- 10.Zisch AH, Schenk U, Schense JC, Sakiyama-Elbert SE, Hubbell JA. Covalently conjugated VEGF–fibrin matrices for endothelialization. J Controlled Release. 2001;72(1–3):101–13. doi: 10.1016/s0168-3659(01)00266-8. [DOI] [PubMed] [Google Scholar]
- 11.Watanabe K, Nakagawa S, Nishida T. Stimulatory effects of fibronectin and EGF on migration of corneal epithelial cells. Invest Ophthalmol Vis Sci. 1987;28:205–11. [PubMed] [Google Scholar]
- 12.Nishida T, Nakamura M, Ofuji K, Reid TW, Mannis MJ, Murphy CJ. Synergistic effects of substance P with insulin-like growth factor-1 on epithelial migration of the cornea. J Cell Physiol. 1996;169:473–89. doi: 10.1002/(SICI)1097-4652(199610)169:1<159::AID-JCP16>3.0.CO;2-8. [DOI] [PubMed] [Google Scholar]
- 13.Golub T, Pico C. Spatial control of actin-based motility through plasmalemmal PtdIns(4,5)P2-rich raft assemblies. Biochem Soc Symp. 2005;(72):119–27. doi: 10.1042/bss0720119. [DOI] [PubMed] [Google Scholar]
- 14.Leitinger B, Hogg N. The involvement of lipid rafts in the regulation of integrin function. J Cell Sci. 2002;115(Pt 5):963–72. doi: 10.1242/jcs.115.5.963. [DOI] [PubMed] [Google Scholar]
- 15.Diehl KA, Foley JD, Nealey PF, Murphy CJ. Nanoscale topography modulates corneal epithelial cell migration. J Biomed Mater Res A. 2005;75(3):603–11. doi: 10.1002/jbm.a.30467. [DOI] [PubMed] [Google Scholar]
- 16.Walboomers XF, Dalton BA, Evans MD, Steele JG, Jansen JA. Transforming growth factor-beta 1, 2, and 3 can inhibit epithelial tissue outgrowth on smooth and microgrooved substrates. J Biomed Mater Res. 2002;60(3):445–51. doi: 10.1002/jbm.1290. [DOI] [PubMed] [Google Scholar]
- 17.Dalton BA, Walboomers XF, Dziegielewski M, Evans MD, Taylor S, Jansen JA, et al. Modulation of epithelial tissue and cell migration by microgrooves. J Biomed Mater Res. 2001;56(2):195–207. doi: 10.1002/1097-4636(200108)56:2<195::aid-jbm1084>3.0.co;2-7. [DOI] [PubMed] [Google Scholar]
- 18.Rajnicek AM, Britland S, McCraig CD. Contact guidance of CNS neurites on grooved quartz: influence of groove dimensions, neuronal age and cell type. J Cell Sci. 1997;110:2905–13. doi: 10.1242/jcs.110.23.2905. [DOI] [PubMed] [Google Scholar]
- 19.Rajnicek AM, McCraig CD. Guidance of CNS growth cones by substratum grooves and ridges: effects of inhibitors of the cytoskeleton, calcium channels and signal transduction pathways. J Cell Sci. 1997;110:2915–24. doi: 10.1242/jcs.110.23.2915. [DOI] [PubMed] [Google Scholar]
- 20.Schoenwaelder SM, Burridge K. Bidrectional signaling between the cytoskeleton and integrins. Curr Opin Cell Biol. 1999;11:274–86. doi: 10.1016/s0955-0674(99)80037-4. [DOI] [PubMed] [Google Scholar]
- 21.Burridge K, Chrzanowska-Wodnicka M. Focal adhesions, contractility, and signaling. Annu Rev Cell Dev Biol. 1996;12:463–518. doi: 10.1146/annurev.cellbio.12.1.463. [DOI] [PubMed] [Google Scholar]
- 22.Balaban NQ, Schwarz US, Riveline D, Goichberg P, Tzur G, Sabanay I, et al. Force and focal adhesion assembly: a close relationship studied using elastic micropatterned substrates [comment] Nat Cell Biol. 2001;3(5):466–72. doi: 10.1038/35074532. [DOI] [PubMed] [Google Scholar]
- 23.Burridge K, Chrzanowska-Wodnicka M. Focal adhesions, contractility, and signaling. Annu Rev Cell Dev Biol. 1996;12:463–519. doi: 10.1146/annurev.cellbio.12.1.463. [DOI] [PubMed] [Google Scholar]
Associated Data
This section collects any data citations, data availability statements, or supplementary materials included in this article.


