

Summary
Selecting the Phase II design and endpoint to achieve the best possible chance of success for a confirmatory Phase III study in a particular disease and treatment setting is challenging but critical. Simulating from existing clinical trial data sets, and mathematical models, can be useful tools for evaluating statistical properties.
In this issue of Clinical Cancer Research, Sharma and colleagues (1) study the properties of alternative endpoints to progression-free survival (PFS) and clinical response to evaluate inhibitory agents where high levels of tumor regression are not anticipated. Data sets representing hypothetical Phase II studies are simulated (or sampled) from two prior Phase III trials: A positive study (sorafenib vs. placebo) (2) and a negative study (AE941 vs. placebo) (3) in metastatic renal cancer. Sharma et al. conclude that in this particular setting, a randomized Phase II design with an endpoint based on continuous measures of tumor size yields the greatest power but at the cost of a higher false positive rate than the other design options they consider.
The authors demonstrate re-sampling, often called bootstrap sampling(4), from existing data sets to study the properties of new designs, and they are careful to limit their design/endpoint conclusions to Phase II evaluations of the growth inhibitory agent sorafenib. However, good designs will depend on the true associations between specific treatments and patient outcomes, and it is difficult to assess their impact from only two clinical trials in one advanced disease setting. To make more general recommendations, we believe it is prudent to extend the assessment to evaluate the impact of a range of different assumptions on design choices, such as the number of arms (one arm versus randomized), the primary end point and even sample size. While simple mathematical formulae provide statistical insights, because Phase II sample sizes are limited and include complexities such as futility monitoring, there is also value in the use of realistic simulations. Motivated by the Sharma et al. manuscript, we comment on three aspects which could influence the details of a design choice and also suggest how simulations could be used to explore statistical properties:
The magnitude or size of the therapeutic effect
The positive study chosen for simulation (sorafenib vs. placebo) demonstrated a very large difference in PFS over the first several months. Based on visual inspection of the plots in (2), the 3 month PFS for both arms were approximately 68% vs. 42%; assuming exponentially distributed PFS, this corresponds to a hazard ratio of approximately 2.25. There was also an impressive difference in log tumor size, which is somewhat striking for a supposed cystostatic agent. For cases where the therapeutic effect is still clinically important, but more modest in magnitude, a randomized Phase II study with good power would need to have a significantly larger sample size for testing new agents. For instance, for an effect size of only 60% on the log scale seen in this study (hazard ratio = 1.6), it would transform the 25 patient per arm Phase II study, to an approximately similarly powered study of 70 patients per arm. In addition, even if only very large effect sizes are of clinical interest, one would still want adverse event data on a sufficiently large number of patients prior to undertaking a Phase III study. While the rough sample size calculations above didn’t require simulation, for a more complete assessment (potentially including futility monitoring) one could use sampling to study the impact of the varying effect size, by drawing samples from a model that approximates the Phase III outcome data, but with a parameter that ranges across interesting therapeutic effect sizes.
The statistical relationships between Phase II and Phase III endpoints
The authors show that there is a potential gain in power by using a continuous endpoint over the discrete endpoint of 90 day PFS (yes vs. no). The statistical associations between this endpoint and the endpoint used for the subsequent Phase III study are critical for determining the performance of the Phase II study. For instance, suppose small changes in tumor size are related to treatment, but not related to overall PFS (primary objective of the Phase III). Such an association can lead to false positives with respect to selecting promising agents for a Phase III study; this may be the situation described by the authors for the null AE941 study. More generally, the class of agents under consideration may influence the nature of association of tumor size with other endpoints such as PFS and survival, and may even impact measurement error properties imaging methods. While it is important to study these issues based on realistic historical data, it is very difficult to sort out the sensitivity of these assumptions without additional modeling. Mathematical study including simulating or sampling from models which probabilistically link tumor size, PFS and OS, and how those relationships may vary with respect to the actions of specific agents, are needed to appreciate the impact of using a novel endpoint prior to implementation of that endpoint in clinical trials.
The probability of generating a positive Phase III study
The authors note that for this example, the randomized Phase II design and log tumor ratio endpoint leads to declaring a regimen promising when ultimately the Phase III study will be negative (false positive rate) of approximately 25%. A goal is to achieve a high probability of identifying regimens at Phase II that will be effective in Phase III trials in the presence of a potentially relatively low prevalence of truly effective regimens. Rubinstein et al. (5) note that it isn’t just high power, but rather the balance between power and false positive rates that guides the chance that a Phase II trial will ultimately lead to a positive Phase III study. For instance, one could generate hypothetically effective and non-effective drugs from each of the studies (say 10% effective), sample as before, and tabulate the fraction of treatments declared positive at Phase II that are truly effective (denote this as the trial positive predictive value; PPV). In this case, one can use arithmetic rather than simulations and see that for a design with 92% power and false positive rate of .25 leads to a positive predictive value (PPV) of 29% for an effective agent. However, another design, with a lower 75% power and false positive rate of .08 (corresponding to the randomized Phase II on 90 day PFS in (1)), leads to a higher chance of effective treatment for a Phase III study, PPV=51%. Interestingly, a single arm study with 55% power but a false positive rate of .01 would have substantially higher PPV – but with the downside of missing substantially more good agents. Figure 1 gives more general results. While we aren’t suggesting the one arm response design is the best choice in this setting, it emphasizes that not just power, but also type 1 error for Phase II studies is important. Furthermore, it highlights the need for increasing the fraction of promising agents for improving the positive predictive value of Phase II studies. For instance, some single arm testing, where appropriate historical data is available, could be an effective filter prior to undertaking a randomized Phase II trial.
Figure 1.
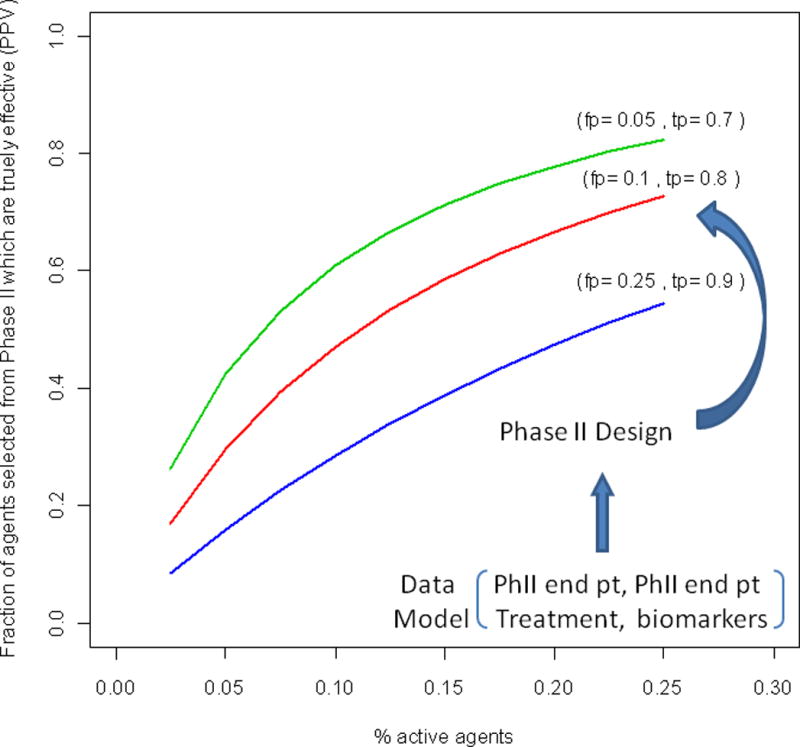
The fraction of agents selected for Phase III study which are effective as a function of the % of active agents undergoing Phase II testing, the false positive rate (fp) and the true positive rate (tp) of the design.
The properties fp and tp depend on the chosen Phase II design and how the Phase II endpoint and Phase III endpoint models jointly depend on the treatment assignment for the specific disease.
The manuscript of Sharma and colleagues provide further motivation for statistical modeling and simulations to assess Phase II designs. Ultimately, the optimal design for a particular disease and treatment setting, including whether it is single arm or randomized or the use of alternative endpoints depends on many assumptions, which can be evaluated with the appropriate statistical strategies.
Acknowledgments
This work was supported, in part, by US NIH through R01-CA90998 and P01 CA53996.
References
- 1.Sharma MR, Karrison TG, Jin Y, Bies RR, Maitland ML, Stadler WM, Ratain MJ. Resampling phase III data to assess phase II trial designs and endpoints. CCR. 2012 doi: 10.1158/1078-0432.CCR-11-1815. [DOI] [PMC free article] [PubMed] [Google Scholar]
- 2.Escudier B, Eisen T, Stadler WM, Szczylik C, Oudard S, Siebels M, et al. TARGET StudyGroup Sorafenib in advanced clear-cell renal-cell carcinoma. N Engl J Med. 2007;356:125–34. doi: 10.1056/NEJMoa060655. [DOI] [PubMed] [Google Scholar]
- 3.Escudier B, Choueiri TK, Oudard S, Szczylik C, Négrier S, Ravaud A, et al. Prognostic factors of metastatic renal cell carcinoma after failure of immunotherapy: new paradigm from a large phase III trial with shark cartilage extract AE 941. J Urol. 2007;178:1901–05. doi: 10.1016/j.juro.2007.07.035. [DOI] [PubMed] [Google Scholar]
- 4.Efron B, Tibshirani T. An Introduction to the Bootstrap. Chapman & Hall/CRC Monographs on Statistics & Applied Probability; 1993. [Google Scholar]
- 5.Rubinstein L, LeBlanc M, Malcolm AS. More Randomization in Phase II Trials: Necessary but not Sufficient. JNCI J Natl Cancer Inst. 2011;10314:1075–77. doi: 10.1093/jnci/djr238. [DOI] [PMC free article] [PubMed] [Google Scholar]