

Native American population history is reexamined using a large data set of pre-Columbian mitochondrial genomes.
Keywords: Ancient DNA, Native America, colonization, Beringia
Abstract
The exact timing, route, and process of the initial peopling of the Americas remains uncertain despite much research. Archaeological evidence indicates the presence of humans as far as southern Chile by 14.6 thousand years ago (ka), shortly after the Pleistocene ice sheets blocking access from eastern Beringia began to retreat. Genetic estimates of the timing and route of entry have been constrained by the lack of suitable calibration points and low genetic diversity of Native Americans. We sequenced 92 whole mitochondrial genomes from pre-Columbian South American skeletons dating from 8.6 to 0.5 ka, allowing a detailed, temporally calibrated reconstruction of the peopling of the Americas in a Bayesian coalescent analysis. The data suggest that a small population entered the Americas via a coastal route around 16.0 ka, following previous isolation in eastern Beringia for ~2.4 to 9 thousand years after separation from eastern Siberian populations. Following a rapid movement throughout the Americas, limited gene flow in South America resulted in a marked phylogeographic structure of populations, which persisted through time. All of the ancient mitochondrial lineages detected in this study were absent from modern data sets, suggesting a high extinction rate. To investigate this further, we applied a novel principal components multiple logistic regression test to Bayesian serial coalescent simulations. The analysis supported a scenario in which European colonization caused a substantial loss of pre-Columbian lineages.
INTRODUCTION
The geographic isolation of the Americas delayed human settlement until the end of the Pleistocene [20 to 10 thousand years ago (ka)]; however, despite this relatively recent date, the specific time, place, and route of entry remain uncertain. It is likely that the first peoples moved from Asia across the Bering Land Bridge (1, 2), the landmass between Eurasia and America exposed by lowered sea levels during the Last Glacial Maximum (LGM). However, at this time, much of northern North America was covered by the Cordilleran and Laurentide ice sheets, which blocked access from eastern Beringia (Bering Land Bridge and Alaska/Yukon) southward to the rest of the Americas (Fig. 1A). Shortly after the Cordilleran ice sheet began to retreat ~17 ka (3), a potential Pacific coastal route became available ~15 ka (Fig. 1B) (3, 4), whereas an alternative route through an inland ice-free corridor along the eastern side of the Rocky Mountains opened around ~11.5 to 11 ka (4–6). The timing and route used in the migration event are important in understanding the size, number, and speed of the first migratory wave(s). Timing and route are also pivotal in resolving contentious issues such as the nature of peoples before Clovis—the first widespread archaeologically recognized culture in North America (13.2 to 12.8 ka) (1).
Fig. 1. Eastern Beringia during the LGM and retreat of the ice sheets.
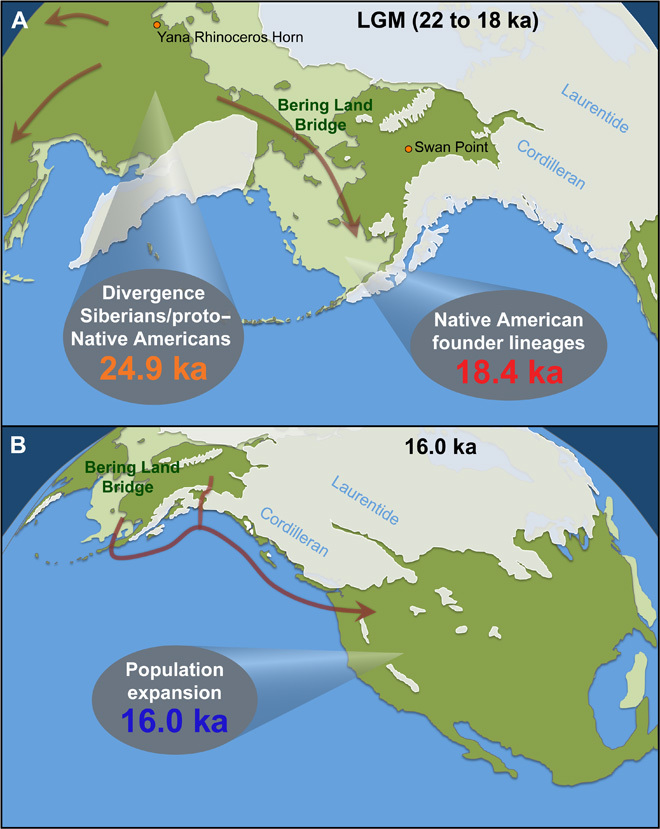
(A) Exposed land when sea levels were lowest (light green), modern-day landmass (dark green), and ice sheets (white). At the height of the LGM, the Laurentide and Cordilleran ice sheets blocked access to the Americas from eastern Beringia (that is, the Bering Land Bridge and Alaska/Yukon) (30). Populations west of the Bering Land Bridge were able to migrate southward during the LGM, but those on the Bering Land Bridge were unable to retreat farther than the Aleutian ice belt (arrows). The last point of detectable gene flow between Siberian and Native American ancestral populations (24.9 ka) and the geographic isolation marked by the formation of Native American founder lineages (18.4 ka) are shown (see Fig. 2B for details). The Yana Rhinoceros Horn site (32 ka) and the Swan Point site (14 ka) illustrate the temporal and geographic gaps in the Beringian archaeological record. (B) The ice sheets that began to retreat ~17 ka, opening a potential Pacific coastal route by ~15 ka (arrow). The rapid population expansion (16.0 ka) likely marks the movement south of the ice (see Fig. 3C for details).
Genetic studies of Native American populations are complicated by the demographic collapse and presumed major loss of genetic diversity following European colonization at the end of the 15th century (7). However, geographically widespread signals of low diversity and shared ancestry (8–13)—particularly striking in maternally inherited mitochondrial and paternally inherited Y-chromosome sequence data—suggest that small founding groups possibly initially entered the Americas in a single migration event that gave rise to most of the ancestry of Native Americans today (9, 12, 14). In contrast, the distribution of some of the rare founding mitochondrial haplogroups (D4h3a along the Pacific coast of North and South America, and X2a in northwestern North America) suggests that distinct migrations along the coastal route and the ice-free corridor occurred within less than 2000 years (15). Recent studies have identified a weak Australasian genomic signature in several Native American groups from the Amazon, compatible with two founding migrations (16), although the Australasian gene flow may have occurred after the initial peopling (17). Irrespective of the number of migration waves, the founding population appears to have rapidly grown and expanded southward (8, 14, 18), with low levels of gene flow between areas following initial dispersion (12, 14).
Unfortunately, the precision of molecular clock studies in the Americas to date has been limited by the low genetic diversity and lack of appropriate calibration points to accurately estimate rates of molecular evolution. As a result, current mitochondrial molecular clock estimates of the initial entry into the Americas, which assume that the event corresponds to the initial diversification of Native American genetic lineages, range from 26.3 to 9.7 ka (Fig. 2A). This broad range spans most of the time frame over which the Bering Land Bridge route was feasible. Given the narrow temporal span of the actual diversification and migration into the Americas, much greater precision is needed to distinguish between different migration routes and hypotheses.
Fig. 2. Comparison of Bayesian estimates of the TMRCA of the Native American founder haplogroups and of the divergence from Siberian lineages.
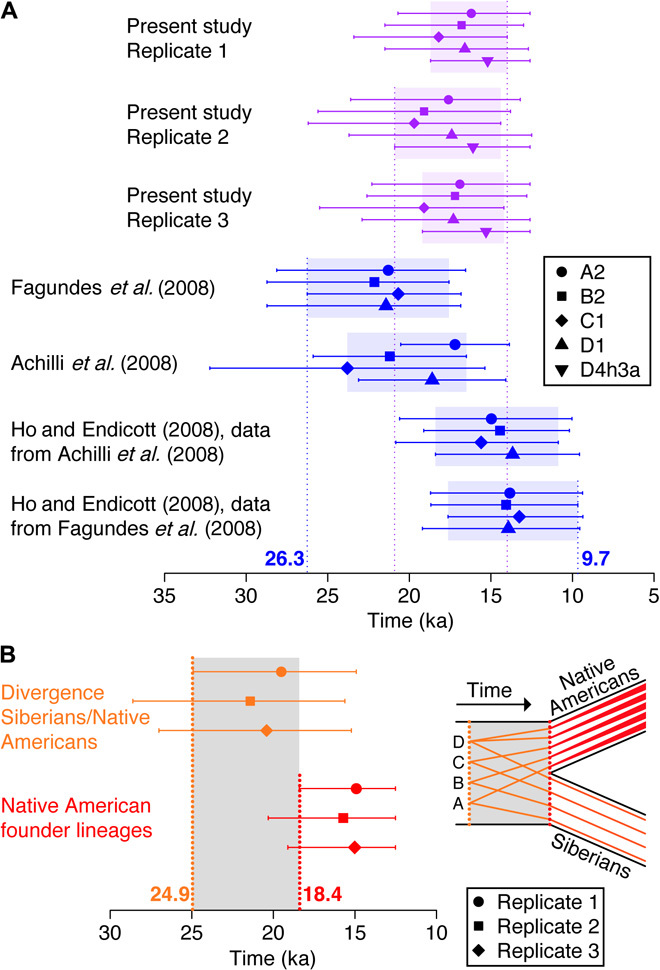
(A) Mean age (symbols) and 95% highest posterior density (HPD) (error bars) for the TMRCA of each of the Native American haplogroups. Shading indicates the period between the oldest lower bound of any 95% HPD and the youngest upper bound of any 95% HPD for each data set. The purple dotted lines show the TMRCA bounds based on tip calibration; the blue dotted lines show the extreme TMRCA bounds from previous publications (26.3 to 9.7 ka) (20, 25). (B) The isolation of Native American populations estimated to have occurred after the last observable divergence between Siberian and Native American lineages (24.9 ka based on the lowest 95% HPD upper bound) and before the oldest date at which all Native American founder haplogroups formed (18.4 ka based on the lowest 95% HPD upper bound). See section S5 for detailed methods.
Molecular clocks highly depend on the quality of calibration points to accurately estimate rates of molecular evolution (19). In the Americas, the scarce evidence of early human occupation and the absence of sites in eastern Beringia for most of the late Pleistocene hinder reliable calibration. An additional major challenge is the temporal dependence of molecular rate estimates, whereby molecular evolution appears more rapid when measured over short time intervals (19). In humans, this problem is most apparent when recent time scales (for example, the human settlement of the Americas) are analyzed using deep fossil calibrations such as the human-chimpanzee split ~6 to 7 million years ago (20). Accurate molecular rate estimates require a distribution of calibration points close to the age of events under study (21, 22); in this regard, ancient DNA sequences from dated skeletons provide suitable tip calibrations for studying recent evolutionary events (23).
To generate a detailed view of human matrilineal genetic diversity in the Americas through time, with multiple calibration points, we sequenced the complete mitochondrial genome (mitogenome) of 92 pre-Columbian individuals, ranging in age from ~8.6 to 0.5 ka (table S2). We then used Bayesian approaches to estimate coalescence times, reconstruct a demographic history, and simulate and test population scenarios.
RESULTS AND DISCUSSION
Novel genetic diversity in pre-Columbian times
The 92 pre-Columbian mitogenomes were sequenced to an average coverage depth of 112× (5.6× to 854.2×; table S2). Sequences were assigned to 84 distinct haplotypes, which fell within the expected overall mitochondrial diversity of Native South Americans (13), that is, haplogroups A2, B2, C1b, C1c, C1d, and D1 (figs. S2 to S5). The Native South American haplogroup D4h3a was not observed in our ancient data set, although we sampled the South American southern cone (Arroyo Seco 2, Argentina) where this lineage is common today (15). None of the 84 haplotypes identified from ancient samples are represented in the existing genealogy of global human mitochondrial diversity [that is, PhyloTree mt; (24)] (figs. S2 to S5) or in the literature (fig. S6). Although modern Native American genetic diversity is not well characterized, this result clearly illustrates the importance of sampling pre-Columbian specimens to fully measure the past genetic diversity and to reconstruct the process of the peopling of the Americas.
Marked synchronicity of the Native South American haplogroup times to most recent common ancestor
The estimated times to most recent common ancestor (TMRCA) for haplogroups A2, B2, C1, D1, and D4h3a were highly synchronous (Fig. 3 and fig. S8), confirming previous interpretations that all five haplogroups were part of one initial population (25). The TMRCA fell within the range of previous molecular date estimates, although the narrower 95% credible intervals considerably increased the precision (Fig. 2A). Older dates for the initial diversification within each haplogroup have been previously calculated using the human-chimpanzee calibration (25, 26), whereas much younger dates resulted from calibrations using non–Native American mitochondrial lineages associated with biogeographic events (20). This clearly illustrates the impact of time-dependent rate estimates and the critical influence of the calibration framework (27). Our use of a large number of temporally and phylogenetically distributed tip dates provides an accurate calibration of the molecular rates relevant to Native American early history (28), allowing a uniquely precise timeline for the peopling of the Americas.
Fig. 3. Dated Bayesian mitogenomic tree and reconstruction of past effective female population size.

The mitogenomic tree and the demographic plot are based on replicate data set 1, which is representative of the three replicate data sets (fig. S7). (A) Complete tree showing the relationships between the main Native American haplogroups A, B, C, and D, as well as their TMRCA (colored circles). Black circles show the divergences between Siberian and Native American lineages. Siberian clades are shown in black and Native American clades are shown in gray. (B) Detailed tree with Siberian clades (black), modern Native Americans (blue), and ancient Native Americans (red). Colored and black circles as in (A). Gray shadings and empty black circles highlight shared ancestry for individuals from the same geographic location or from the same cultural background. The filled black triangle (haplogroup A2) is the most recent common ancestor between an ancient haplotype and a modern haplotype at ~9 ka. (C) Extended Bayesian skyline plot of female effective population size, based on a generation time of 25 years.
Separation from Siberian populations during the LGM
The most recent genetic divergence observed between the ancestors of Siberians and Native Americans (24.9 ka; section S5 and Fig. 2B) is the last point at which we can detect apparent gene flow (that is, a shared lineage) between the Siberian population and the ancestral Native American population. We can assume that the real population divergence occurred after this point. In addition, if we accept that the estimated TMRCA of each of the five Native American haplogroups provides an independent estimate of the timing of the same small population’s isolation, we can use the 95% credible intervals to constrain the lower bound (section S5). The resulting estimate that the two populations became fully isolated between 24.9 and 18.4 ka is in accordance with calculations from modern complete genomes which indicate that Siberians and Native Americans split no later than ~23 ka (17). Gene flow to and from east Siberia certainly appears to have ceased by the height of the LGM (18.4 ka; Fig. 2B).
Eastern Beringia as a sustainable refugium for ancestral Native Americans
Our data cannot determine whether the separation between Siberian and Native American ancestral populations occurred in Siberia or Beringia. However, the start of isolation (24.9 to 18.4 ka) closely coincides with the LGM. We hypothesize that cold arid conditions drove populations on the western (that is, Siberian) margins of the Bering Land Bridge to migrate to southern refugia (Fig. 1A), as suggested by the absence of megafauna kill sites younger than the far north Yana Rhinoceros Horn site 32 ka (1). In contrast, any populations east of the Kamchatka and Chukotka Peninsulas would not have been able to retreat farther south than the Aleutian ice belt and would thus remain isolated in eastern Beringia (Fig. 1A). We cannot accurately estimate the size of this founding population, but the effective female population that subsequently entered the Americas appears to be ~2000, which accords well with previous studies (9, 10, 25). Although this number cannot be directly translated into census population size, it suggests that the human population isolated in eastern Beringia was relatively small, probably not exceeding a few tens of thousands of people (section S6). The presence of large numbers of megafauna in eastern Beringia during the late Pleistocene, including the LGM, indicates an ice-free region dominated by shrub tundra (29), which would have been more than capable of sustaining such a population size (section S6). Thus, our observations are consistent with the idea that the founding Native American population used the exposed Bering Land Bridge and adjacent regions in Alaska/Yukon as a refugium during the height of the LGM, before climatic change and the retreat of the ice sheets allowed access to the remainder of the Americas. Unfortunately, the large temporal and geographic gaps in the archaeological record between the Yana Rhinoceros Horn site (~32 ka, western Beringia) and the Swan Point site (~14 ka, eastern Beringia) provide little additional information about this process (Fig. 1A) (1) or how the ancestral Native Americans were isolated from their Asian counterparts.
The Beringian Standstill (~2.4 to 9 thousand years)
The scenario of an Eastern Beringia refugium is consistent with the Beringian standstill hypothesis, which suggests that the ancestral Native Americans were isolated in the area for up to 15 thousand years (ky) (9, 10, 29). Our large data set of dated mitogenomes provides tight estimates for the duration of the standstill and the subsequent movement out of the area. The mitogenomic tree shows a sudden burst of lineage diversification starting ~16.0 to 13.0 ka (Fig. 3B). This is followed by a steep increase in the mean female effective population size (>10%) between adjacent time bins starting 16.0 ka (Fig. 3C). Overall, the population underwent a 60-fold increase between 16.0 and 13.0 ka, suggesting that 16.0 ka represents the initial entry into the Americas, where population size significantly increased in a more favorable environment. Considering the time between isolation (24.9 to 18.4 ka) and entry (16.0 ka), the improved temporal resolution provided by our data suggests that the Beringian Standstill could have been as short as ~2.4 ky, and no longer than ~9 ky, consistent with recent estimates based on autosomal data from complete modern-day genomes (17).
A coastal entry route
The population burst at 16.0 ka is contemporaneous with the rapid retreat of coastal glaciers along the northwest Pacific coast associated with a phase of stepwise ocean warming (2° to 3°C) in the region (3). This date considerably predates the opening of the inland ice-free corridor ~11.5 to 11.0 ka (4–6) and indicates that the initial entry into the Americas took place via a southward expansion along recently emerged northwest Pacific coastal land (Fig. 1B) (3, 17, 28, 30, 31). Given the early archaeological sites in Monte Verde in southern Chile at 14.6 ka (32), the mitogenome data indicate that the transit of the full length of the Americas took around 1.4 ky.
Early geographic structure after entry into the Americas
The phylogenetic trees feature multiple long branches stemming from the initial expansion period (Fig. 3B), irrespective of whether the lineages lead to pre-Columbian (ancient) or modern-day individuals. This topology appears to reflect the swift migration and expansion of a population, which contained each major haplogroup, into and throughout the Americas (8, 14, 18). Subsequent lineage diversification within each haplogroup appears to be constrained to within specific geographic regions or shared cultural backgrounds (Fig. 3B, gray shadings), which is consistent with suggestions that geographic structure was rapidly established after colonization and was thereafter followed by limited gene flow between populations from diverse regions (14, 33).
Extinction of ancient lineages after European colonization
It has been suggested that European colonization resulted in a bottleneck in Native American genetic diversity (34, 35). In the present data set, it is notable that no ancient haplotype (Fig. 3B, red lineages) shared a common ancestor with a modern haplotype (Fig. 3B, blue lineages) more recently than ~9.0 ka (Fig. 3B, black triangle in haplogroup A2), despite the number of samples examined from both populations. Our ancient samples were principally derived from large population centers along the western coast of South America, which experienced high extinction rates following European colonization. Historic accounts have reported that the population decline was more rapid and intense in the Gulf of Mexico and the Pacific coast of Peru than in other areas such as the Mesoamerican plateau or the Andean highlands (7). The pronounced phylogeographic structure observed in Native American mitogenomes suggests that such demographic events could have removed major portions of genetic diversity in certain areas. As a result, it is possible that the lack of overlap between ancient and modern haplotypes is influenced by the undersampling of modern-day diversity in the source regions of the archaeological material.
To further examine the issue of local extinction, we used BayeSSC (36) to simulate 15,000 coalescence trees for each of seven potential population scenarios (section S7; Fig. 4 and fig. S10). The Akaike information criterion for model selection, which is included in the BayeSSC package, informs about the relative fit of the models but does not inform about their absolute quality. As an alternative, we applied a principal components multiple logistic regression (PCMLR) model (37) to the BayeSSC summary statistics to predict which of the population scenarios best fits the observed data. We introduce this novel approach in approximate Bayesian computation as a powerful way to estimate both the relative [graphical representation of principal components analysis (PCA)] (Fig. 4 and fig. S10) and the absolute (Bayesian model verification; table S6) qualities of the tested models (section S7).
Fig. 4. Effects of population structure and European colonization on South American mitochondrial diversity.
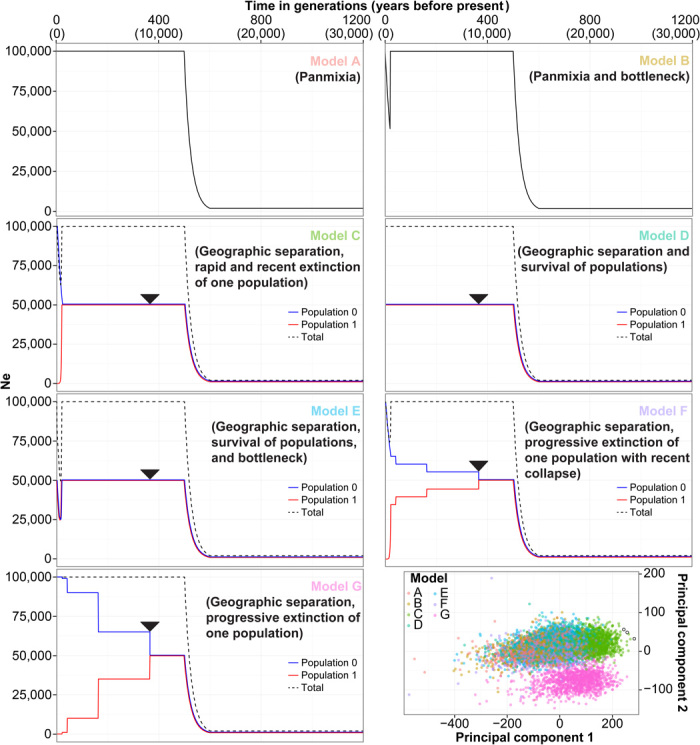
Seven population scenarios simulated with BayeSSC are represented (models A to G). The arrowheads in demographic models C to G represent the time of separation (9 ka) between the population carrying modern haplotypes (Population 0) and the population carrying ancient haplotypes (Population 1) (that is, meta-demes with a pattern of localized small-scale separation across the continent). The bottom-right panel is a PCA plot of summary statistics for the 15,000 simulations for each of the seven models (25% of simulated data are reported; see fig. S10 for the full data set). Observed data from the three replicates are shown as black circles and fall closest to results from model C (green points).
We found that demographic models with one panmictic population (model A in Fig. 4 and fig. S10) or with a simple geographic separation of populations harboring the ancient and modern lineages (that is, a localized small-scale separation across the continent; model D) were poor fits for the data (table S6). The addition of a post-European bottleneck with survival of both ancient and modern lineages (models B and E) did not improve the goodness of fit. More complex models combined geographic separation and early and ongoing loss of ancient lineages—accelerated (model F) or not (model G) by the European landfall—to account for demographic processes such as serial founder effects and drift, or population turnover and elimination during the expansion of Central Andean empires. Such models were also poor fits for the data (table S6). Only a model that combined both the geographic separation of populations harboring modern and ancient haplotypes and the subsequent rapid extinction of the ancient lineages following European colonization fit our empirical observations (model C, minimum probability of 0.995; table S6). As a further test, when the demographic model C was removed from the analysis, the principal components remained mostly unchanged (fig. S11). This observation supports the robustness of the PCMLR model in correctly discriminating between the different demographic alternatives (38). However, none of the remaining demographic models (model A, B, D, E, F, or G) strongly fit all empirical observations (table S8), showing that model C is the only strong fit for the empirical data.
As a result, our ancient mitochondrial data suggest that European colonization was followed by local mass mortality and extinction of lineages associated with major population centers of the pre-Columbian past. Our results contrast with previous observations that Native American genetic diversity has been temporally and geographically stable for at least the past 2000 years (33). However, the apparent contradiction between our study and earlier work is likely attributable to a significant improvement of sequence resolution. We also caution that the demographic models tested in this study are likely too simple to encompass the particulars of the colonization of the Americas—despite exploring scenarios with early emergence of geographic structure, as well as ongoing haplotype loss resulting from either serial founder effects and drift, or population displacement and elimination during the expansion of major Central Andean imperial states. Finally, more complete mitochondrial sequence data from early and modern-day populations will be needed to further refine the demographic models. In particular, it will be critical to ensure a strong spatial overlap between archaeological sites and present-day population locations (for example, Peru).
CONCLUSION
The additional resolving power gained from widespread temporal calibrations makes ancient mitochondrial DNA data from South America a very cost-effective approach to examining the precise timing, route, and sequence of events that led to the peopling of the Americas. In addition, this data set provides a genetic view of the possible role played by European colonization in reducing the overall Native American genetic diversity to the low levels observed today. In the absence of archaeological evidence in southern and eastern Beringia that is relevant to the peopling of the Americas, further resolution of the entry and routes of dispersal of the early settlers will be possible with ancient genomic data from South America.
MATERIALS AND METHODS
Archaeological samples
Most of the archaeological samples were collected in the Central Andes from sites in Peru (n = 70), western Bolivia (n = 9), and northern Chile (n = 6), whereas the remaining samples came from northern Mexico (n = 5) and the Argentinian Pampas (n = 2) (fig. S1 and table S2). Permissions from respective National Heritage organizations were obtained for all archaeological material analyzed in the study (section S1) and are available upon request. Radiocarbon dates were either published previously (39, 40) or obtained from the Oxford Radiocarbon Unit to confirm the archaeological assignation based on stratification and examination of artefacts (table S1).
Ancient DNA analysis
All ancient DNA work was conducted in clean-room facilities of the Australian Centre for Ancient DNA (ACAD) at the University of Adelaide, the Human Paleogenomics laboratory at the University of California at Santa Cruz (UCSC), and the Reich laboratory at Harvard Medical School (HMS). DNA contamination control measures are detailed in section S1. DNA was extracted using silica in solution (22, 41) and converted into double-stranded libraries with truncated Illumina adapters (42). RNA or DNA baits were used for hybridization capture, followed by Illumina high-throughput sequencing (sections S1 to S4). Automated variant calls were confirmed by eye directly from the read pileups to avoid errors attributable to DNA damage (sections S2 and S4).
BEAST analysis
We used a Bayesian approach to estimate mitogenome coalescence times from the complete data using BEAST 1.8.0 (43) and reconstructed a demographic history via the extended Bayesian skyline method (44), which infers effective population size. Three random subsets of 87 modern South American and Mexican mitogenomes were used with the ancient data in replicate analyses. To estimate the date of separation from Old World populations, we also added 20 of the most closely related east Siberian mitogenomes. The previously published 12.6-ky Anzick-1 genome from Montana, United States (45), was included to provide genetic diversity for haplogroup D4h3a and to increase the depth of calibration points. We combined modern and dated ancient mitogenomes and analyzed three replicate data sets of 200 sequences. The 93 ancient samples (including 12 sequences older than 3.5 ky) ensured temporal (12.6 to 0.5 ka) and phylogenetic coverage (Fig. 3B), allowing internal calibration of the substitution rate for each South American haplogroup (fig. S9). Details are provided in section S5.
BayeSSC and model testing
We used BayeSSC (36) to simulate data for seven population scenarios (Fig. 4): one panmictic population without (model A) or with a post-European bottleneck (model B), or geographic separation (9 ka) of parallel populations featuring modern or ancient haplotypes (model D); geographic separation can be followed by either a post-European bottleneck for both populations (model E), a complete extinction of ancient lineages after contact with Europeans (model C), an early and progressive loss of lineages leading to extinction of ancient lineages (model G), or an early and progressive loss of ancient lineages followed by a rapid post-European extinction (model F). We calculated within-deme (Tajima’s D, haplotype diversity, number of haplotypes, etc.) and between-deme [Fixation index (FST), average pairwise distances] statistics for the observed and simulated data. We then performed a PCA to remove colinearity between the summary statistics, because they are likely to be correlated (37, 46), using the princomp function in R (47). Finally, we fit a multiple logistic regression model (37) in which the response variable was the model under which the data were simulated and the explanatory variables were the first five principal components. This approach predicted which scenario was the most likely to have produced data like those that we observed. Details are provided in section S7.
Supplementary Material
Acknowledgments
We thank the anonymous reviewers for providing helpful comments. We thank K. Mitchell, J. Tuke, N. Bean, and M. S. Y. Lee for helpful discussions and critical comments on the manuscript. We are grateful to B. O’Fallon for providing the Java program for the demography plot and to ACAD members for general assistance. We thank J. Quilter and S. Leblanc for providing the sample from Huaca Prieta. We also thank the following National Heritage organisations that delivered permits to collect, export, and analyze ancient specimens: the Ministry of Culture (the former National Institute of Cultural Heritage–INC) in Peru; the National Institute of Archaeology, a specialized agency of the Deputy Minister of Culture in Bolivia; the Universidad de Chile and the Museo Arqueológico, Universidad de Tarapacá, San Miguel de Azapa, Arica, in Chile; the Consejo Arqueológico and Consejo Jurídico committees of the National Institute of Anthropology and History (INAH) in Mexico; and the Cultural Patrimony Office of the Ministry of Education in Argentina. Funding: B.L., L.F.-S., C.S., D.R., A.C., and W.H. acknowledge funding from the Australian Research Council (DP1095782, DP130102158), the University of Adelaide Environment Institute, the Wenner-Gren Foundation (SC-14-62), the U.S. National Science Foundation (HOMINID BCS-1032255), the U.S. National Institutes of Health (GM100233), and the Howard Hughes Medical Institute for the generation of genetic data. Author contributions: B.L., L.F.-S., A.C., and W.H. designed the experiments and analyses. B.L. and S.M.R. designed the mitochondrial capture method at ACAD. B.L., L.F.-S., G.V., N.R., S.N., C.V., and W.H. generated the genetic data. B.L., L.F.-S., J.S., S.M., A.R., S.Y.W.H., and W.H. analyzed the data. M.I.B.R., I.F.E., E.T.C., L.W.J., K.M., I.S.L.R., J.M.L., J.A.B.T., M.A.R., R.L.B., M.C.C., J.R., R.S.W., G.P., C.M.S., and V.G.S. provided archaeological samples. B.L., L.F.-S., A.C., and W.H. wrote the manuscript, with contributions from all co-authors during extensive revisions. Competing interests: The authors declare that they have no competing interests. Data and materials availability: All ancient genetic data used to obtain the conclusions in the paper are available at the National Center for Biotechnology Information (accession numbers KU523264 to KU523350 and KP300790 to KP300794). Additional data related to this paper may be requested from the authors.
SUPPLEMENTARY MATERIALS
Supplementary material for this article is available at http://advances.sciencemag.org/cgi/content/full/2/4/e1501385/DC1
Supplementary Materials and Methods
Section S1. Archaeological samples, radiocarbon dating, and DNA contamination control
Section S2. DNA extraction, library preparation, and mitochondrial capture (ACAD)
Section S3. DNA extraction and library preparation (UCSC Human Paleogenomics laboratory and HMS Reich laboratory)
Section S4. Mitochondrial DNA capture (HMS Reich laboratory)
Section S5. Bayesian phylogenetic analysis of mitochondrial data
Section S6. Ecological assessment of population sustainability in Beringia
Section S7. Bayesian coalescent simulations and evaluation of demographic scenarios
Table S1. Date calibrations for ancient mitogenome sequences.
Table S2. List of ancient samples, associated metadata, and sequencing results (separate Excel document).
Table S3. Complete list of accession numbers for modern mitogenome sequences.
Table S4. Polymerase chain reaction (PCR) primers used for mitochondrial long-range PCR.
Table S5. Predictive accuracy of the PCMLR model.
Table S6. Prediction of the population structure model that fits the observed data.
Table S7. Highest predictive accuracy of the PCMLR model for each population structure model when model C is removed from the analysis.
Table S8. Prediction of the population structure model that fits the observed data when model C is removed from the analysis.
Fig. S1. Location of archaeological sites (see table S2 for detailed information about sites and samples).
Fig. S2. Phylogenetic tree of newly sequenced ancient mitogenomes (haplogroup A).
Fig. S3. Phylogenetic tree of newly sequenced ancient mitogenomes (haplogroup B).
Fig. S4. Phylogenetic tree of newly sequenced ancient mitogenomes (haplogroup C).
Fig. S5. Phylogenetic tree of newly sequenced ancient mitogenomes (haplogroup D).
Fig. S6. Maximum parsimony phylogenetic trees of the 93 ancient mitogenomes and three replicate data sets of the 87 modern Native American mitogenomes (see table S3).
Fig. S7. Extended Bayesian skyline plots of female effective population size for the three replicate data sets.
Fig. S8. Bayesian estimates of node ages for haplogroups A2, B2, C1, D1, and D4h3a.
Fig. S9. Results of the date-randomization test for temporal sampling structure.
Fig. S10. PCA plot of summary statistics for the 15,000 simulations for each of the seven models simulated with BayeSSC (see Fig. 4).
Fig. S11. PCA plot of summary statistics for the 15,000 simulations for each of the models simulated with BayeSSC, when model C is removed from the PCA.
REFERENCES AND NOTES
- 1.Goebel T., Waters M. R., O’Rourke D. H., The late Pleistocene dispersal of modern humans in the Americas. Science 319, 1497–1502 (2008). [DOI] [PubMed] [Google Scholar]
- 2.Greenberg J. H., Turner C. G. II, Zegura S. L., Campbell L., Fox J. A., Laughlin W. S., Szathmary E. J. E., Weiss K. M., Woolford E., The settlement of the Americas: A comparison of the linguistic, dental, and genetic evidence. Curr. Anthropol. 27, 477–497 (1986). [Google Scholar]
- 3.Taylor M. A., Hendy I. L., Pak D. K., Deglacial ocean warming and marine margin retreat of the Cordilleran Ice Sheet in the North Pacific Ocean. Earth Planet. Sci. Lett. 403, 89–98 (2014). [Google Scholar]
- 4.Mandryk C. A. S., Josenhans H., Fedje D. W., Mathewes R. W., Late quaternary paleoenvironments of Northwestern North America: Implications for inland versus coastal migration routes. Quat. Sci. Rev. 20, 301–314 (2001). [Google Scholar]
- 5.Gowan E. J., An assessment of the minimum timing of ice free conditions of the western Laurentide Ice Sheet. Quat. Sci. Rev. 75, 100–113 (2013). [Google Scholar]
- 6.Arnold T. G., Radiocarbon dates from the ice-free corridor. Radiocarbon 44, 437–454 (2002). [Google Scholar]
- 7.Livi-Bacci M., The depopulation of Hispanic America after the conquest. Popul. Dev. Rev. 32, 199–232 (2006). [Google Scholar]
- 8.Battaglia V., Grugni V., Perego U. A., Angerhofer N., Gomez-Palmieri J. E., Woodward S. R., Achilli A., Myres N., Torroni A., Semino O., The first peopling of South America: New evidence from Y-chromosome haplogroup Q. PLOS One 8, e71390 (2013). [DOI] [PMC free article] [PubMed] [Google Scholar]
- 9.Tamm E., Kivisild T., Reidla M., Metspalu M., Smith D. G., Mulligan C. J., Bravi C. M., Rickards O., Martinez-Labarga C., Khusnutdinova E. K., Fedorova S. A., Golubenko M. V., Stepanov V. A., Gubina M. A., Zhadanov S. I., Ossipova L. P., Damba L., Voevoda M. I., Dipierri J. E., Villems R., Malhi R. S., Beringian standstill and spread of Native American founders. PLOS One 2, e829 (2007). [DOI] [PMC free article] [PubMed] [Google Scholar]
- 10.Mulligan C. J., Kitchen A., Miyamoto M. M., Updated three-stage model for the peopling of the Americas. PLOS One 3, e3199 (2008). [DOI] [PMC free article] [PubMed] [Google Scholar]
- 11.Schroeder K. B., Schurr T. G., Long J. C., Rosenberg N. A., Crawford M. H., Tarskaia L. A., Osipova L. P., Zhadanov S. I., Smith D. G., A private allele ubiquitous in the Americas. Biol. Lett. 3, 218–223 (2007). [DOI] [PMC free article] [PubMed] [Google Scholar]
- 12.Wang S., Lewis C. M. Jr, Jakobsson M., Ramachandran S., Ray N., Bedoya G., Rojas W., Parra M. V., Molina J. A., Gallo C., Mazzotti G., Poletti G., Hill K., Hurtado A. M., Labuda D., Klitz W., Barrantes R., Bortolini M. C., Salzano F. M., Petzl-Erler M. L., Tsuneto L. T., Llop E., Rothhammer F., Excoffier L., Feldman M. W., Rosenberg N. A., Ruiz-Linares A., Genetic variation and population structure in Native Americans. PLOS Genet. 3, e185 (2007). [DOI] [PMC free article] [PubMed] [Google Scholar]
- 13.Perego U. A., Angerhofer N., Pala M., Olivieri A., Lancioni H., Kashani B. H., Carossa V., Ekins J. E., Gómez-Carballa A., Huber G., Zimmermann B., Corach D., Babudri N., Panara F., Myres N. M., Parson W., Semino O., Salas A., Woodward S. R., Achilli A., Torroni A., The initial peopling of the Americas: A growing number of founding mitochondrial genomes from Beringia. Genome Res. 20, 1174–1179 (2010). [DOI] [PMC free article] [PubMed] [Google Scholar]
- 14.Reich D., Patterson N., Campbell D., Tandon A., Mazieres S., Ray N., Parra M. V., Rojas W., Duque C., Mesa N., García L. F., Triana O., Blair S., Maestre A., Dib J. C., Bravi C. M., Bailliet G., Corach D., Hünemeier T., Cátira Bortolini M., Salzano F. M., Petzl-Erler M. L., Acuña-Alonzo V., Aguilar-Salinas C., Canizales-Quinteros S., Tusié-Luna T., Riba L., Rodríguez-Cruz M., Lopez-Alarcón M., Coral-Vazquez R., Canto-Cetina T., Silva-Zolezzi I., Fernandez-Lopez J. C., Contreras A. V., Jimenez-Sanchez G., Gómez-Vázquez M. J., Molina J., Carracedo Á., Salas A., Gallo C., Poletti G., Witonsky D. B., Alkorta-Aranburu G., Sukernik R. I., Osipova L., Fedorova S. A., Vasquez R., Villena M., Moreau C., Barrantes R., Pauls D., Excoffier L., Bedoya G., Rothhammer F., Dugoujon J.-M., Larrouy G., Klitz W., Labuda D., Kidd J., Kidd K., Di Rienzo A., Freimer N. B., Price A. L., Ruiz-Linares A., Reconstructing Native American population history. Nature 488, 370–374 (2012). [DOI] [PMC free article] [PubMed] [Google Scholar]
- 15.Perego U. A., Achilli A., Angerhofer N., Accetturo M., Pala M., Olivieri A., Kashani B. H., Ritchie K. H., Scozzari R., Kong Q.-P., Myres N. M., Salas A., Semino O., Bandelt H.-J., Woodward S. R., Torroni A., Distinctive Paleo-Indian migration routes from Beringia marked by two rare mtDNA haplogroups. Curr. Biol. 19, 1–8 (2009). [DOI] [PubMed] [Google Scholar]
- 16.Skoglund P., Mallick S., Bortolini M. C., Chennagiri N., Hünemeier T., Petzl-Erler M. L., Salzano F. M., Patterson N., Reich D., Genetic evidence for two founding populations of the Americas. Nature 525, 104–108 (2015). [DOI] [PMC free article] [PubMed] [Google Scholar]
- 17.Raghavan M., Steinrücken M., Harris K., Schiffels S., Rasmussen S., DeGiorgio M., Albrechtsen A., Valdiosera C., Ávila-Arcos M. C., Malaspinas A.-S., Eriksson A., Moltke I., Metspalu M., Homburger J. R., Wall J., Cornejo O. E., Moreno-Mayar J. V., Korneliussen T. S., Pierre T., Rasmussen M., Campos P. F., de Barros Damgaard P., Allentoft M. E., Lindo J., Metspalu E., Rodríguez-Varela R., Mansilla J., Henrickson C., Seguin-Orlando A., Malmström H., Stafford T. Jr, Shringarpure S. S., Moreno-Estrada A., Karmin M., Tambets K., Bergström A., Xue Y., Warmuth V., Friend A. D., Singarayer J., Valdes P., Balloux F., Leboreiro I., Vera J. L., Rangel-Villalobos H., Pettener D., Luiselli D., Davis L. G., Heyer E., Zollikofer C. P. E., de León M. S. P., Smith C. I., Grimes V., Pike K.-A., Deal M., Fuller B. T., Arriaza B., Standen V., Luz M. F., Ricaut F., Guidon N., Osipova L., Voevoda M. I., Posukh O. L., Balanovsky O., Lavryashina M., Bogunov Y., Khusnutdinova E., Gubina M., Balanovska E., Fedorova S., Litvinov S., Malyarchuk B., Derenko M., Mosher M. J., Archer D., Cybulski J., Petzelt B., Mitchell J., Worl R., Norman P. J., Parham P., Kemp B. M., Kivisild T., Tyler-Smith C., Sandhu M. S., Crawford M., Villems R., Smith D. G., Waters M. R., Goebel T., Johnson J. R., Malhi R. S., Jakobsson M., Meltzer D. J., Manica A., Durbin R., Bustamante C. D., Song Y. S., Nielsen R., Willerslev E., Genomic evidence for the Pleistocene and recent population history of Native Americans. Science 349, aab3884 (2015). [DOI] [PMC free article] [PubMed] [Google Scholar]
- 18.Bodner M., Perego U. A., Huber G., Fendt L., Röck A. W., Zimmermann B., Olivieri A., Gómez-Carballa A., Lancioni H., Angerhofer N., Bobillo M. C., Corach D., Woodward S. R., Salas A., Achilli A., Torroni A., Bandelt H.-J., Parson W., Rapid coastal spread of first Americans: Novel insights from South America’s Southern Cone mitochondrial genomes. Genome Res. 22, 811–820 (2012). [DOI] [PMC free article] [PubMed] [Google Scholar]
- 19.Ho S. Y. W., Lanfear R., Bromham L., Phillips M. J., Soubrier J., Rodrigo A. G., Cooper A., Time-dependent rates of molecular evolution. Mol. Ecol. 20, 3087–3101 (2011). [DOI] [PubMed] [Google Scholar]
- 20.Ho S. Y. W., Endicott P., The crucial role of calibration in molecular date estimates for the peopling of the Americas. Am. J. Hum. Genet. 83, 142–146 (2008). [DOI] [PMC free article] [PubMed] [Google Scholar]
- 21.Fu Q., Mittnik A., Johnson P. L. F., Bos K., Lari M., Bollongino R., Sun C., Giemsch L., Schmitz R., Burger J., Ronchitelli A. M., Martini F., Cremonesi R. G., Svoboda J., Bauer P., Caramelli D., Castellano S., Reich D., Pääbo S., Krause J., A revised timescale for human evolution based on ancient mitochondrial genomes. Curr. Biol. 23, 553–559 (2013). [DOI] [PMC free article] [PubMed] [Google Scholar]
- 22.Brotherton P., Haak W., Templeton J., Brandt G., Soubrier J., Adler C. J., Richards S. M., Der Sarkissian C., Ganslmeier R., Friederich S., Dresely V., van Oven M., Kenyon R., Van der Hoek M. B., Korlach J., Luong K., Ho S. Y. W., Quintana-Murci L., Behar D. M., Meller H., Alt K. W., Cooper A., Adhikarla S., Prasad A. K. G., Pitchappan R., Santhakumari A. V., Balanovska E., Balanovsky O., Bertranpetit J., Comas D., Martínez-Cruz B., Melé M., Clarke A. C., Matisoo-Smith E. A., Dulik M. C., Gaieski J. B., Owings A. C., Schurr T. G., Vilar M. G., Hobbs A., Soodyall H., Javed A., Parida L., Platt D. E., Royyuru A. K., Jin L., Li S., Kaplan M. E., Merchant N. C., Mitchell R. J., Renfrew C., Lacerda D. R., Santos F. R., Hernanz D. F. S., Wells R. S., Swamikrishnan P., Tyler-Smith C., Vieira P. P., Ziegle J. S. for The Genographic Consortium , Neolithic mitochondrial haplogroup H genomes and the genetic origins of Europeans. Nat. Commun. 4, 1764 (2013). [DOI] [PMC free article] [PubMed] [Google Scholar]
- 23.Ho S. Y. W., Duchêne S., Molecular-clock methods for estimating evolutionary rates and timescales. Mol. Ecol. 23, 5947–5965 (2014). [DOI] [PubMed] [Google Scholar]
- 24.van Oven M., Kayser M., Updated comprehensive phylogenetic tree of global human mitochondrial DNA variation. Hum. Mutat. 30, E386–E394 (2009). [DOI] [PubMed] [Google Scholar]
- 25.Fagundes N. J. R., Kanitz R., Eckert R., Valls A. C. S., Bogo M. R., Salzano F. M., Smith D. G., Silva W. A. Jr, Zago M. A., Ribeiro-dos-Santos A. K., Santos S. E. B., Petzl-Erler M. L., Bonatto S. L., Mitochondrial population genomics supports a single pre-Clovis origin with a coastal route for the peopling of the Americas. Am. J. Hum. Genet. 82, 583–592 (2008). [DOI] [PMC free article] [PubMed] [Google Scholar]
- 26.Achilli A., Perego U. A., Bravi C. M., Coble M. D., Kong Q.-P., Woodward S. R., Salas A., Torroni A., Bandelt H.-J., The phylogeny of the four pan-American mtDNA haplogroups: Implications for evolutionary and disease studies. PLOS One 3, e1764 (2008). [DOI] [PMC free article] [PubMed] [Google Scholar]
- 27.Fagundes N. J. R., Kanitz R., Bonatto S. L., Reply to Ho and Endicott. Am. J. Hum. Genet. 83, 146–147 (2008). [Google Scholar]
- 28.O’Rourke D. H., Raff J. A., The human genetic history of the Americas: The final frontier. Curr. Biol. 20, R202–R207 (2010). [DOI] [PubMed] [Google Scholar]
- 29.Hoffecker J. F., Elias S. A., O’Rourke D. H., Out of Beringia? Science 343, 979–980 (2014). [DOI] [PubMed] [Google Scholar]
- 30.Dixon E. J., Late Pleistocene colonization of North America from Northeast Asia: New insights from large-scale paleogeographic reconstructions. Quat. Int. 285, 57–67 (2013). [Google Scholar]
- 31.Schurr T. G., Sherry S. T., Mitochondrial DNA and Y chromosome diversity and the peopling of the Americas: Evolutionary and demographic evidence. Am. J. Hum. Biol. 16, 420–439 (2004). [DOI] [PubMed] [Google Scholar]
- 32.Dillehay T. D., Ramírez C., Pino M., Collins M. B., Rossen J., Pino-Navarro J. D., Monte Verde: Seaweed, food, medicine, and the peopling of South America. Science 320, 784–786 (2008). [DOI] [PubMed] [Google Scholar]
- 33.O’Rourke D. H., Hayes M. G., Carlyle S. W., Spatial and temporal stability of mtDNA haplogroup frequencies in Native North America. Hum. Biol. 72, 15–34 (2000). [PubMed] [Google Scholar]
- 34.Bolnick D. A., Smith D. G., Unexpected patterns of mitochondrial DNA variation among Native Americans from the Southeastern United States. Am. J. Phys. Anthropol. 122, 336–354 (2003). [DOI] [PubMed] [Google Scholar]
- 35.O’Fallon B. D., Fehren-Schmitz L., Native Americans experienced a strong population bottleneck coincident with European contact. Proc. Natl. Acad. Sci. U.S.A. 108, 20444–20448 (2011). [DOI] [PMC free article] [PubMed] [Google Scholar]
- 36.Anderson C. N. K., Ramakrishnan U., Chan Y. L., Hadly E. A., Serial SimCoal: A population genetics model for data from multiple populations and points in time. Bioinformatics 21, 1733–1734 (2004). [DOI] [PubMed] [Google Scholar]
- 37.Escabias M., Aguilera A. M., Valderrama M. J., Principal component estimation of functional logistic regression: Discussion of two different approaches. J. Nonparametr. Stat. 16, 365–384 (2004). [Google Scholar]
- 38.Camminatie I., Lucadamo A., Estimating multinomial logit model with multicollinear data. Asian J. Math. Stat. 3, 93–101 (2010). [Google Scholar]
- 39.Fehren-Schmitz L., Llamas B., Lindauer S., Tomasto-Cagigao E., Kuzminsky S., Rohland N., Santos F. R., Kaulicke P., Valverde G., Richards S. M., Nordenfelt S., Seidenberg V., Mallick S., Cooper A., Reich D., Haak W., A re-appraisal of the early Andean human remains from Lauricocha in Peru. PLOS One 10, e0127141 (2015). [DOI] [PMC free article] [PubMed] [Google Scholar]
- 40.G. G. Politis, M. A. Gutiérrez, C. Scabuzzo, Eds., Estado actual de las investigaciones en el sitio arqueológico Arroyo Seco 2 (partido de Tres Arroyos, provincia de Buenos Aires, Argentina), Serie monográfica (INCUAPA, Olavarría, 2014). [Google Scholar]
- 41.Haak W., Lazaridis I., Patterson N., Rohland N., Mallick S., Llamas B., Brandt G., Nordenfelt S., Harney E., Stewardson K., Fu Q., Mittnik A., Bánffy E., Economou C., Francken M., Friederich S., Pena R. G., Hallgren F., Khartanovich V., Khokhlov A., Kunst M., Kuznetsov P., Meller H., Mochalov O., Moiseyev V., Nicklisch N., Pichler S. L., Risch R., Guerra M. A. R., Roth C., Szécsényi-Nagy A., Wahl J., Meyer M., Krause J., Brown D., Anthony D., Cooper A., Alt K. W., Reich D., Massive migration from the steppe was a source for Indo-European languages in Europe. Nature 522, 207–211 (2015). [DOI] [PMC free article] [PubMed] [Google Scholar]
- 42.Meyer M., Kircher M., Illumina sequencing library preparation for highly multiplexed target capture and sequencing. Cold Spring Harb. Protoc. 2010, 1–10 (2010). [DOI] [PubMed] [Google Scholar]
- 43.Drummond A. J., Suchard M. A., Xie D., Rambaut A., Bayesian phylogenetics with BEAUti and the BEAST 1.7. Mol. Biol. Evol. 29, 1969–1973 (2012). [DOI] [PMC free article] [PubMed] [Google Scholar]
- 44.Heled J., Drummond A. J., Bayesian inference of population size history from multiple loci. BMC Evol. Biol. 8, 289 (2008). [DOI] [PMC free article] [PubMed] [Google Scholar]
- 45.Rasmussen M., Anzick S. L., Waters M. R., Skoglund P., DeGiorgio M., Stafford T. W. Jr, Rasmussen S., Moltke I., Albrechtsen A., Doyle S. M., Poznik G. D., Gudmundsdottir V., Yadav R., Malaspinas A.-S., White S. S. V, Allentoft M. E., Cornejo O. E., Tambets K., Eriksson A., Heintzman P. D., Karmin M., Korneliussen T. S., Meltzer D. J., Pierre T. L., Stenderup J., Saag L., Warmuth V. M., Lopes M. C., Malhi R. S., Brunak S., Sicheritz-Ponten T., Barnes I., Collins M., Orlando L., Balloux F., Manica A., Gupta R., Metspalu M., Bustamante C. D., Jakobsson M., Nielsen R., Willerslev E., The genome of a late Pleistocene human from a Clovis burial site in western Montana. Nature 506, 225–229 (2014). [DOI] [PMC free article] [PubMed] [Google Scholar]
- 46.M. A. Beaumont, in Simulation, Genetics and Human Prehistory, S. Matsumura, P. Forster, C. Renfrew, Eds. (McDonald Institute for Archaeological Research, Cambridge, 2008), pp. 135–154. [Google Scholar]
- 47.R Development Core Team, R: A Language and Environment for Statistical Computing (R Foundation for Statistical Computing, Vienna, 2010).
- 48.Lindgreen S., AdapterRemoval: Easy cleaning of next-generation sequencing reads. BMC Res. Notes 5, 337 (2012). [DOI] [PMC free article] [PubMed] [Google Scholar]
- 49.Behar D. M., van Oven M., Rosset S., Metspalu M., Loogväli E.-L., Silva N. M., Kivisild T., Torroni A., Villems R., A “Copernican” reassessment of the human mitochondrial DNA tree from its root. Am. J. Hum. Genet. 90, 675–684 (2012). [DOI] [PMC free article] [PubMed] [Google Scholar]
- 50.Li H., Durbin R., Fast and accurate short read alignment with Burrows–Wheeler transform. Bioinformatics 25, 1754–1760 (2009). [DOI] [PMC free article] [PubMed] [Google Scholar]
- 51.Schubert M., Ginolhac A., Lindgreen S., Thompson J. F., Al-Rasheid K. A., Willerslev E., Krogh A., Orlando L., Improving ancient DNA read mapping against modern reference genomes. BMC Genomics 13, 178 (2012). [DOI] [PMC free article] [PubMed] [Google Scholar]
- 52.Kircher M., Analysis of high-throughput ancient DNA sequencing data. Methods Mol. Biol. 840, 197–228 (2012). [DOI] [PubMed] [Google Scholar]
- 53.Ginolhac A., Rasmussen M., Gilbert M. T. P., Willerslev E., Orlando L., mapDamage: Testing for damage patterns in ancient DNA sequences. Bioinformatics 27, 2153–2155 (2011). [DOI] [PubMed] [Google Scholar]
- 54.Templeton J. E. L., Brotherton M., Llamas B., Soubrier J., Haak W., Cooper A., Austin J. J., DNA capture and next-generation sequencing can recover whole mitochondrial genomes from highly degraded samples for human identification. Invest. Genet. 4, 26 (2013). [DOI] [PMC free article] [PubMed] [Google Scholar]
- 55.Dabney J., Knapp M., Glocke I., Gansauge M.-T., Weihmann A., Nickel B., Valdiosera C., García N., Pääbo S., Arsuaga J.-L., Meyer M., Complete mitochondrial genome sequence of a Middle Pleistocene cave bear reconstructed from ultrashort DNA fragments. Proc. Natl. Acad. Sci. U.S.A. 110, 15758–15763 (2013). [DOI] [PMC free article] [PubMed] [Google Scholar]
- 56.Rohland N., Harney E., Mallick S., Nordenfelt S., Reich D., Partial uracil–DNA–glycosylase treatment for screening of ancient DNA. Philos. Trans. R. Soc. Lond. B Biol. Sci. 370, 20130624 (2014). [DOI] [PMC free article] [PubMed] [Google Scholar]
- 57.Fu Q., Meyer M., Gao X., Stenzel U., Burbano H. A., Kelso J., Pääbo S., DNA analysis of an early modern human from Tianyuan Cave, China. Proc. Natl. Acad. Sci. U.S.A. 110, 2223–2227 (2013). [DOI] [PMC free article] [PubMed] [Google Scholar]
- 58.Meyer M., Fu Q., Aximu-Petri A., Glocke I., Nickel B., Arsuaga J.-L., Martínez I., Gracia A., de Castro J. M. B., Carbonell E., Pääbo S., A mitochondrial genome sequence of a hominin from Sima de los Huesos. Nature 505, 403–406 (2014). [DOI] [PubMed] [Google Scholar]
- 59.Quinlan A. R., Hall I. M., BEDTools: A flexible suite of utilities for comparing genomic features. Bioinformatics 26, 841–842 (2010). [DOI] [PMC free article] [PubMed] [Google Scholar]
- 60.Jonsson H., Ginolhac A., Schubert M., Johnson P. L. F., Orlando L., mapDamage2.0: Fast approximate Bayesian estimates of ancient DNA damage parameters. Bioinformatics 29, 1682–1684 (2013). [DOI] [PMC free article] [PubMed] [Google Scholar]
- 61.Kumar S., Bellis C., Zlojutro M., Melton P. E., Blangero J., Curran J. E., Large scale mitochondrial sequencing in Mexican Americans suggests a reappraisal of Native American origins. BMC Evol. Biol. 11, 293 (2011). [DOI] [PMC free article] [PubMed] [Google Scholar]
- 62.Lanfear R., Calcott B., Ho S. Y. W., Guindon S., Partitionfinder: Combined selection of partitioning schemes and substitution models for phylogenetic analyses. Mol. Biol. Evol. 29, 1695–1701 (2012). [DOI] [PubMed] [Google Scholar]
- 63.Molak M., Lorenzen E. D., Shapiro B., Ho S. Y. W., Phylogenetic estimation of timescales using ancient DNA: The effects of temporal sampling scheme and uncertainty in sample ages. Mol. Biol. Evol. 30, 253–262 (2013). [DOI] [PubMed] [Google Scholar]
- 64.Molak M., Suchard M. A., Ho S. Y. W., Beilman D. W., Shapiro B., Empirical calibrated radiocarbon sampler: A tool for incorporating radiocarbon-date and calibration error into Bayesian phylogenetic analyses of ancient DNA. Mol. Ecol. Resour. 15, 81–86 (2015). [DOI] [PMC free article] [PubMed] [Google Scholar]
- 65.Drummond A. J., Ho S. Y. W., Phillips M. J., Rambaut A., Relaxed phylogenetics and dating with confidence. PLOS Biol. 4, e88 (2006). [DOI] [PMC free article] [PubMed] [Google Scholar]
- 66.Ho S. Y. W., Lanfear R., Phillips M. J., Barnes I., Thomas J. A., Kolokotronis S.-O., Shapiro B., Bayesian estimation of substitution rates from ancient DNA sequences with low information content. Syst. Biol. 60, 366–375 (2011). [DOI] [PubMed] [Google Scholar]
- 67.Duchêne S., Duchêne D., Holmes E. C., Ho S. Y. W., The performance of the date-randomization test in phylogenetic analyses of time-structured virus data. Mol. Biol. Evol. 32, 1895–1906 (2015). [DOI] [PubMed] [Google Scholar]
- 68.Gould W. A., Raynolds M., Walker D. A., Vegetation, plant biomass, and net primary productivity patterns in the Canadian Arctic. J. Geophys. Res. 108, 1–14 (2003). [Google Scholar]
- 69.H. Lieth, R. H. Whittaker, Eds., Primary Productivity of the Biosphere (Springer-Verlag, Berlin, 1975). [Google Scholar]
- 70.C. Smith, Late Stone Age Hunters of the British Isles (Routledge, New York, 1992). [Google Scholar]
- 71.Rowley-Conwy P., Layton R., Foraging and farming as niche construction: Stable and unstable adaptations. Philos. Trans. R. Soc. Lond. B Biol. Sci. 366, 849–862 (2011). [DOI] [PMC free article] [PubMed] [Google Scholar]
- 72.H. Schutkowski, Human Ecology: Biocultural Adaptations in Human Communities (Springer-Verlag, Berlin, 2006). [Google Scholar]
- 73.Frankham R., Effective population size/adult population size ratios in wildlife: A review. Genet. Res. 89, 491–503 (2007). [DOI] [PubMed] [Google Scholar]
- 74.Palstra F. P., Fraser D. J., Effective/census population size ratio estimation: A compendium and appraisal. Ecol. Evol. 2, 2357–2365 (2012). [DOI] [PMC free article] [PubMed] [Google Scholar]
- 75.Ingman M., Kaessmann H., Pääbo S., Gyllensten U., Mitochondrial genome variation and the origin of modern humans. Nature 408, 708–713 (2000). [DOI] [PubMed] [Google Scholar]
- 76.Starikovskaya E. B., Sukernik R. I., Derbeneva O. A., Volodko N. V., Ruiz-Pesini E., Torroni A., Brown M. D., Lott M. T., Hosseini S. H., Huoponen K., Wallace D. C., Mitochondrial DNA diversity in indigenous populations of the southern extent of Siberia, and the origins of Native American haplogroups. Ann. Hum. Genet. 69, 67–89 (2005). [DOI] [PMC free article] [PubMed] [Google Scholar]
- 77.Just R. S., Diegoli T. M., Saunier J. L., Irwin J. A., Parsons T. J., Complete mitochondrial genome sequences for 265 African American and U.S. “Hispanic” individuals. Forensic Sci. Int. Genet. 2, e45–e48 (2008). [DOI] [PubMed] [Google Scholar]
- 78.Derenko M., Malyarchuk B., Grzybowski T., Denisova G., Dambueva I., Perkova M., Dorzhu C., Luzina F., Lee H. K., Vanecek T., Villems R., Zakharov I., Phylogeographic analysis of mitochondrial DNA in northern Asian populations. Am. J. Hum. Genet. 81, 1025–1041 (2007). [DOI] [PMC free article] [PubMed] [Google Scholar]
- 79.Ingman M., Gyllensten U., Rate variation between mitochondrial domains and adaptive evolution in humans. Hum. Mol. Genet. 16, 2281–2287 (2007). [DOI] [PubMed] [Google Scholar]
- 80.Volodko N. V., Starikovskaya E. B., Mazunin I. O., Eltsov N. P., Naidenko P. V., Wallace D. C., Sukernik R. I., Mitochondrial genome diversity in arctic Siberians, with particular reference to the evolutionary history of Beringia and Pleistocenic peopling of the Americas. Am. J. Hum. Genet. 82, 1084–1100 (2008). [DOI] [PMC free article] [PubMed] [Google Scholar]
- 81.Hartmann A., Thieme M., Nanduri L. K., Stempfl T., Moehle C., Kivisild T., Oefner P. J., Validation of microarray-based resequencing of 93 worldwide mitochondrial genomes. Hum. Mutat. 30, 115–122 (2009). [DOI] [PubMed] [Google Scholar]
- 82.Derenko M., Malyarchuk B., Grzybowski T., Denisova G., Rogalla U., Perkova M., Dambueva I., Zakharov I., Origin and post-glacial dispersal of mitochondrial DNA haplogroups C and D in northern Asia. PLOS One 5, e15214 (2010). [DOI] [PMC free article] [PubMed] [Google Scholar]
- 83.Cardoso S., Alfonso-Sánchez M. A., Valverde L., Sánchez D., Zarrabeitia M. T., Odriozola A., Martínez-Jarreta B., de Pancorbo M. M., Genetic uniqueness of the Waorani tribe from the Ecuadorian Amazon. Heredity 108, 609–615 (2012). [DOI] [PMC free article] [PubMed] [Google Scholar]
- 84.Derenko M., Malyarchuk B., Denisova G., Perkova M., Rogalla U., Grzybowski T., Khusnutdinova E., Dambueva I., Zakharov I., Complete mitochondrial DNA analysis of eastern Eurasian haplogroups rarely found in populations of northern Asia and eastern Europe. PLOS One 7, e32179 (2012). [DOI] [PMC free article] [PubMed] [Google Scholar]
- 85.de Saint Pierre M., Bravi C. M., Motti J. M. B., Fuku N., Tanaka M., Llop E., Bonatto S. L., Moraga M., An alternative model for the early peopling of southern South America revealed by analyses of three mitochondrial DNA haplogroups. PLOS One 7, e43486 (2012). [DOI] [PMC free article] [PubMed] [Google Scholar]
- 86.Achilli A., Perego U. A., Lancioni H., Olivieri A., Gandini F., Kashani B. H., Battaglia V., Grugni V., Angerhofer N., Rogers M. P., Herrera R. J., Woodward S. R., Labuda D., Smith D. G., Cybulski J. S., Semino O., Malhi R. S., Torroni A., Reconciling migration models to the Americas with the variation of North American native mitogenomes. Proc. Natl. Acad. Sci. U.S.A. 110, 14308–14313 (2013). [DOI] [PMC free article] [PubMed] [Google Scholar]
Associated Data
This section collects any data citations, data availability statements, or supplementary materials included in this article.
Supplementary Materials
Supplementary material for this article is available at http://advances.sciencemag.org/cgi/content/full/2/4/e1501385/DC1
Supplementary Materials and Methods
Section S1. Archaeological samples, radiocarbon dating, and DNA contamination control
Section S2. DNA extraction, library preparation, and mitochondrial capture (ACAD)
Section S3. DNA extraction and library preparation (UCSC Human Paleogenomics laboratory and HMS Reich laboratory)
Section S4. Mitochondrial DNA capture (HMS Reich laboratory)
Section S5. Bayesian phylogenetic analysis of mitochondrial data
Section S6. Ecological assessment of population sustainability in Beringia
Section S7. Bayesian coalescent simulations and evaluation of demographic scenarios
Table S1. Date calibrations for ancient mitogenome sequences.
Table S2. List of ancient samples, associated metadata, and sequencing results (separate Excel document).
Table S3. Complete list of accession numbers for modern mitogenome sequences.
Table S4. Polymerase chain reaction (PCR) primers used for mitochondrial long-range PCR.
Table S5. Predictive accuracy of the PCMLR model.
Table S6. Prediction of the population structure model that fits the observed data.
Table S7. Highest predictive accuracy of the PCMLR model for each population structure model when model C is removed from the analysis.
Table S8. Prediction of the population structure model that fits the observed data when model C is removed from the analysis.
Fig. S1. Location of archaeological sites (see table S2 for detailed information about sites and samples).
Fig. S2. Phylogenetic tree of newly sequenced ancient mitogenomes (haplogroup A).
Fig. S3. Phylogenetic tree of newly sequenced ancient mitogenomes (haplogroup B).
Fig. S4. Phylogenetic tree of newly sequenced ancient mitogenomes (haplogroup C).
Fig. S5. Phylogenetic tree of newly sequenced ancient mitogenomes (haplogroup D).
Fig. S6. Maximum parsimony phylogenetic trees of the 93 ancient mitogenomes and three replicate data sets of the 87 modern Native American mitogenomes (see table S3).
Fig. S7. Extended Bayesian skyline plots of female effective population size for the three replicate data sets.
Fig. S8. Bayesian estimates of node ages for haplogroups A2, B2, C1, D1, and D4h3a.
Fig. S9. Results of the date-randomization test for temporal sampling structure.
Fig. S10. PCA plot of summary statistics for the 15,000 simulations for each of the seven models simulated with BayeSSC (see Fig. 4).
Fig. S11. PCA plot of summary statistics for the 15,000 simulations for each of the models simulated with BayeSSC, when model C is removed from the PCA.