

DNA released from obesity-induced degenerated adipocytes stimulates inflammation in adipose tissue and insulin resistance.
Keywords: cell-free DNA, inflammation, adipose tissue, insulin resistance, macrophage, Toll-like receptor-9
Abstract
Obesity stimulates chronic inflammation in adipose tissue, which is associated with insulin resistance, although the underlying mechanism remains largely unknown. Here we showed that obesity-related adipocyte degeneration causes release of cell-free DNA (cfDNA), which promotes macrophage accumulation in adipose tissue via Toll-like receptor 9 (TLR9), originally known as a sensor of exogenous DNA fragments. Fat-fed obese wild-type mice showed increased release of cfDNA, as determined by the concentrations of single-stranded DNA (ssDNA) and double-stranded DNA (dsDNA) in plasma. cfDNA released from degenerated adipocytes promoted monocyte chemoattractant protein-1 (MCP-1) expression in wild-type macrophages, but not in TLR9-deficient (Tlr9−/−) macrophages. Fat-fed Tlr9−/− mice demonstrated reduced macrophage accumulation and inflammation in adipose tissue and better insulin sensitivity compared with wild-type mice, whereas bone marrow reconstitution with wild-type bone marrow restored the attenuation of insulin resistance observed in fat-fed Tlr9−/− mice. Administration of a TLR9 inhibitory oligonucleotide to fat-fed wild-type mice reduced the accumulation of macrophages in adipose tissue and improved insulin resistance. Furthermore, in humans, plasma ssDNA level was significantly higher in patients with computed tomography–determined visceral obesity and was associated with homeostasis model assessment of insulin resistance (HOMA-IR), which is the index of insulin resistance. Our study may provide a novel mechanism for the development of sterile inflammation in adipose tissue and a potential therapeutic target for insulin resistance.
INTRODUCTION
Cell-free DNA (cfDNA) circulating in the blood has recently received much attention as a potential biomarker for monitoring both physiological and pathological conditions (1). Apoptosis and/or necrosis are considered to be the main source of cfDNA (1–3). Several studies have reported a link between cfDNA and inflammatory diseases (2–5). Some of these studies suggested the contribution of Toll-like receptor 9 (TLR9), originally known as a sensor of exogenous DNA fragments, to cfDNA-mediated inflammatory processes (4, 6–9).
Chronic sterile inflammation is central to the pathobiology of obesity and obesity-related complications. Obesity stimulates chronic inflammation in adipose tissue, which strongly associates with the development of insulin resistance (10), although the underlying mechanism remains largely unknown (10–14). Adipose tissue is an energy-storing organ. However, obesity-related conditions, such as higher oxidative stress (15), lower oxygen pressure (16), and enhanced inflammation (11) induce cellular degeneration and cause cellular turnover in adipose tissue (17, 18). A previous study demonstrated the contribution of local adipocyte-derived factors to multiple pathological states, including adipose tissue inflammation (19). Furthermore, several studies have demonstrated that TLR2 and TLR4 mediate adipose tissue inflammation through the recognition of fatty acids released from damaged adipocytes as an internal ligand (20, 21). However, the effects of obesity on cfDNA release and the role of cfDNA-TLR9 signaling in adipose tissue inflammation remain unknown. Here, we assessed the hypothesis that cfDNA released by obesity-related adipocyte degeneration causes adipose tissue inflammation through recognition by TLR9, contributing to the development of insulin resistance. We examined the association between obesity and the release of cfDNA, and investigated the role of cfDNA in macrophage activation and in the development of adipose tissue inflammation and insulin resistance by using a diet-induced obesity model, a bone marrow transplantation (BMT) model, and an in vivo TLR9 inhibition study involving wild-type and TLR9-deficient (Tlr9−/−) mice. Furthermore, we examined cfDNA level in human plasma to show clinically translatable evidence. Our study may provide a novel mechanism for the development of adipose tissue inflammation and a potential therapeutic target for insulin resistance.
RESULTS
Obesity increases circulating levels of cfDNA
Degeneration of adipocytes occurs in the adipose tissue of obese subjects (22, 23). Therefore, we examined whether obesity increases the circulating level of cfDNA in plasma. Fat-fed C57BL/6 (wild-type) mice showed higher plasma levels of single-stranded DNA (ssDNA) and double-stranded DNA (dsDNA) compared with those fed normal chow (NC) (Fig. 1, A and B). Plasma level of nucleosomes, a protein-bound form of circulating cfDNA that is released by the activation of endonucleases from dead cells (24), was also higher in fat-fed animals (Fig. 1C). An organ culture experiment showed that epididymal fat obtained from obese wild-type mice fed a high-fat diet released more cfDNA compared with that obtained from NC-fed animals (Fig. 1, D and E). High-fat diet increased plasma ssDNA level, which was associated with an increase in visceral adipose tissue (VAT) weight, but not liver weight (fig. S1, A and B). Plasma ssDNA level had a positive correlation with blood glucose level (Fig. 1F and fig. S1C). A high-fat diet enhanced adipocyte degeneration, as determined by perilipin expression (22), the number of crown-like structures (23), and electron micrographic analysis of VAT in this study (Fig. 1G and fig. S2, A to C).
Fig. 1. Obesity-related adipocyte degeneration and cfDNA release.
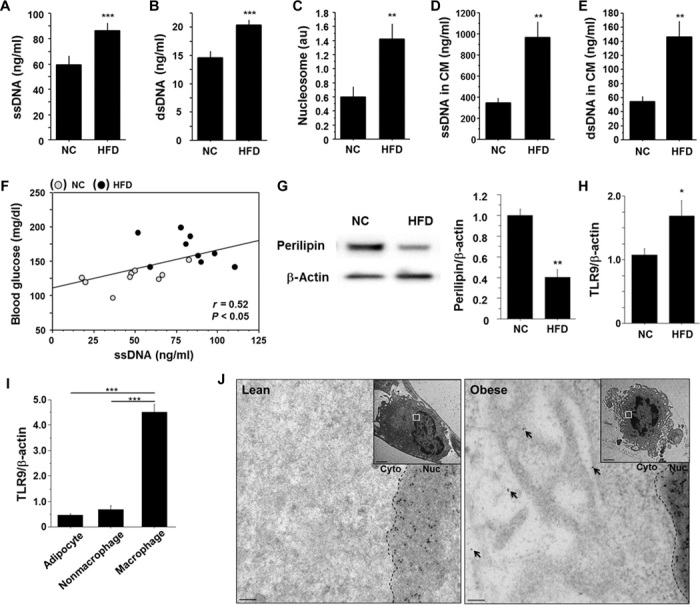
(A to C) Plasma levels of ssDNA (A), dsDNA (B), and nucleosomes (C) (n = 9). au, arbitrary units. (D and E) Levels of ssDNA (D) and dsDNA (E) in CM obtained from an organ culture experiment using epididymal fat (n = 5). (F) Correlation between plasma level of ssDNA and blood glucose level (n = 18). (G) Representative figure of Western blot analysis of perilipin expression in epididymal fat. Expression of perilipin was quantified by densitometry and normalized to the corresponding signal for β-actin (n = 5). (H) Quantitative RT-PCR analysis of TLR9 expression in epididymal fat (n = 5). (I) Cell-type–specific expression of TLR9 in epididymal fat obtained from fat-fed mice (n = 5). (J) Representative immunogold staining against ssDNA revealing accumulation of gold particles (10 nm) in the cytoplasm of macrophages (arrows) in epididymal fat obtained from fat-fed obese mice. The accumulation of gold particles was not observed in adipose tissue macrophages in lean mice (n = 4). Scale bar, 100 nm. Inset: lower magnification (scale bar, 2 μm). Cyto, cytoplasm; Nuc, nucleus. All samples were obtained from wild-type (WT) mice fed a high-fat diet (HFD) or NC for 12 weeks. *P < 0.05, **P < 0.01, and ***P < 0.001. All values are means ± SEM.
Obesity increases TLR9 expression in adipose tissue
Increasing evidence suggests that cfDNA serves as an endogenous ligand for TLR9, contributing to the pathogenesis of several inflammatory diseases (4, 6–9, 25), although the role of TLR9 in adipose tissue inflammation remains unknown. We found that a high-fat diet increased Tlr9 expression in VAT and that the expression of Tlr9 was dominant in the macrophage population (Fig. 1, H and I). Electron microscopic analysis using visceral fat of obese mice showed the presence of secondary lysosomes or autolysosomes in the cytoplasm of macrophages, which are often observed in the vicinity of degenerated fat cells (fig. S2D). Furthermore, immunoelectron microscopic analysis demonstrated accumulation of ssDNA in the cytoplasm of macrophages accumulated in obese VAT, but not in lean VAT (Fig. 1J). Adipocyte death initiates and accelerates adipose tissue inflammation, contributing to the development of insulin resistance (18, 22). Therefore, we hypothesized that TLR9 in macrophages recognizes cfDNA released from degenerated adipocytes and promotes inflammation in adipose tissue.
TLR9 signaling mediates the interaction of adipocytes and macrophages
First, we examined the roles of TLR9 in the activation of macrophages, a key player in adipose tissue inflammation. Treatment with CpG-ODN1826 (CpG1826), a TLR9-specific ligand (26), stimulated the expression of monocyte chemoattractant protein-1 (MCP-1) in peritoneal macrophages obtained from wild-type mice, but not in macrophages obtained from Tlr9−/− mice (Fig. 2A and fig. S3). iODN2088, a specific antagonist of TLR9 (7, 26–29), successfully inhibited MCP-1 expression induced by CpG1826 in wild-type macrophages (Fig. 2B). As reported in previous studies (7), CpG1826 ligation to TLR9 activates the nuclear factor κB (NF-κB) pathway, as determined by the phosphorylation of IκBα in this cell type (Fig. 2, C and D, and fig. S4).
Fig. 2. Role of TLR9 in macrophage activation.
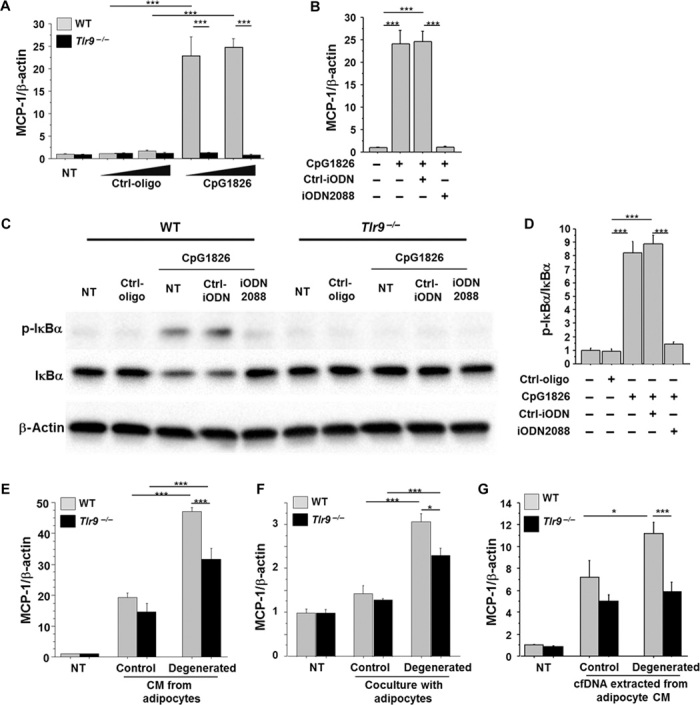
(A) CpG-ODN1826 (CpG1826) (0.1 to 1.0 μM), a TLR9-specific ligand, increased the expression of MCP-1 in peritoneal macrophages obtained from WT mice, but not in macrophages obtained from Tlr9−/− mice (n = 6). NT, non-treatment. (B) iODN2088 (0.1 μM), a specific antagonist of TLR9, inhibited the MCP-1 expression induced by CpG1826 (0.1 μM) in WT macrophages (n = 6). (C and D) Ligation of CpG1826 (0.1 μM) to TLR9 activated the NF-κB pathways determined by the phosphorylation of IκBα in WT macrophages, which was abolished by iODN2088. Neither CpG nor iODN2088 influenced the phosphorylation of IκBα in Tlr9−/− macrophages. Representative figure of Western blot analysis of IκBα phosphorylation (C) and the result of the quantification of phosphorylated IκBα normalized to the corresponding signal for total IκBα by densitometry (D) are shown (n = 4). (E) CM from control 3T3-L1 adipocytes increased MCP-1 expression in WT and Tlr9−/− macrophages. CM from degenerated adipocytes further promoted MCP-1 expression in WT macrophages, although this response was attenuated in Tlr9−/− macrophages (n = 5). After a 24-hour pretreatment with or without TNF-α, adipocytes were cultured in a starvation medium without TNF-α for another 24 hours. Culture media were then collected as CM of degenerated or control adipocytes, respectively, and used in the experiments. (F) Coculture of macrophages and 3T3-L1 adipocytes using a Transwell membrane slightly increased MCP-1 expression in WT and Tlr9−/− macrophages. Coculture with degenerated adipocytes increased MCP-1 expression in WT macrophages more efficiently, although this response was attenuated in Tlr9−/− macrophages (n = 6). (G) cfDNA extracted from degenerated adipocyte CM promoted MCP-1 expression in WT macrophages, but not in Tlr9−/− macrophages (n = 6 to 8). cfDNA extracted from 130 μl of CM was used to stimulate each well. CM from degenerated adipocytes were collected as shown in (E). *P < 0.05 and ***P < 0.001. All values are means ± SEM.
Next, to investigate whether TLR9 mediates the interaction of macrophages and adipocytes, we cultured peritoneal macrophages using conditioned media (CM) obtained from differentiated 3T3-L1 adipocytes pretreated with or without tumor necrosis factor–α (TNF-α). Previous studies demonstrated that TNF-α induces adipocyte degeneration (30–32). TNF-α increased the release of cfDNA from adipocytes into CM in the present study (fig. S5). CM from nontreated adipocytes increased MCP-1 expression in both wild-type and Tlr9−/− macrophages. CM from degenerated adipocytes further promoted MCP-1 expression in wild-type macrophages, although this response was attenuated in Tlr9−/− macrophages (Fig. 2E). Coculture of macrophages and 3T3-L1 adipocytes using a Transwell membrane showed similar results (Fig. 2F). CM from degenerated adipocytes or coculture with degenerated adipocytes effectively promoted MCP-1 expression in wild-type macrophages. Meanwhile, Tlr9−/− macrophages also responded to these culture conditions. Recognition of other cell debris, such as fatty acids, released by degenerated adipocytes through other Toll-like receptors might be involved in this response. The expression of Tlr2, Tlr4, and Tlr7 did not differ between wild-type and Tlr9−/− macrophages (fig. S6). To further investigate whether cfDNA in CM activates macrophages through TLR9, we stimulated macrophages with cfDNA extracted from adipocyte CM. cfDNA extracted from degenerated adipocyte CM increased MCP-1 expression only in wild-type macrophages, which was blocked in the presence of iODN2088 (Fig. 2G and fig. S7). These results suggested that TLR9 activation by cfDNA released from degenerated adipocytes increased MCP-1 expression in macrophages, which may promote further inflammatory responses.
Genetic deletion of TLR9 reduces adipose tissue inflammation and insulin resistance
To examine the in vivo role of TLR9 in adipose tissue inflammation, we used a mouse model of diet-induced obesity. After 12 weeks of fat-feeding, VAT weight was similar between wild-type mice and Tlr9−/− mice (table S1). Moreover, there was no difference in the level of obesity between the two strains of mice, compared with their NC-fed counterparts (fig. S8), although VAT of Tlr9−/− mice demonstrated reduced macrophage accumulation and expression of inflammatory molecules, including MCP-1 and TNF-α, both of which play a pivotal role in the pathogenesis of insulin resistance, compared with that of wild-type mice (Fig. 3, A and B). The expression of the proinflammatory activated macrophage marker CD11c was lower in Tlr9−/− mice. On the other hand, the expression of CD206, an alternatively activated macrophage marker, was higher in Tlr9−/− mice. In addition, VAT of Tlr9−/− mice showed less NF-κB signal activation, as observed in an in vitro experiment using macrophages (Fig. 3C). On the basis of less inflammation in VAT, Tlr9−/− mice showed better insulin sensitivity compared with wild-type mice, as determined by blood glucose level, serum insulin level, and insulin tolerance test results (Fig. 3D and fig. S9). Plasma lipid levels, food intake, and indirect calorimetric measurements were similar between the two strains of mice (table S1 and fig. S10). The expression of adiponectin, peroxisome proliferator–activated receptor γ (PPARγ), and insulin receptor substrate-1 (IRS-1), each of which correlates with insulin sensitivity, was higher in VAT in Tlr9−/− mice (Fig. 3E). Genetic deletion of TLR9 improved insulin signaling, as determined by phosphorylation of IRS-1Ser307 (fig. S11A). Comparison between NC-fed animals indicated the tendency for Tlr9−/− mice to have better insulin sensitivity compared with wild-type mice; however, the difference was not as markedly observed in fat-fed animals (fig. S12A). Moreover, the expression of genes associated with insulin sensitivity was similar between the two strains of mice, whereas TNF-α expression in VAT in NC-fed Tlr9−/− mice was higher than that in NC-fed wild-type mice (fig. S12B). These results indicated some baseline differences between Tlr9−/− mice and wild-type mice fed NC; however, our study clearly demonstrated that TLR9 promotes adipose tissue inflammation by accelerating macrophage accumulation and activation, contributing to the development of insulin resistance under a high-fat diet.
Fig. 3. Effects of genetic deletion of TLR9 on adipose tissue inflammation and insulin resistance.
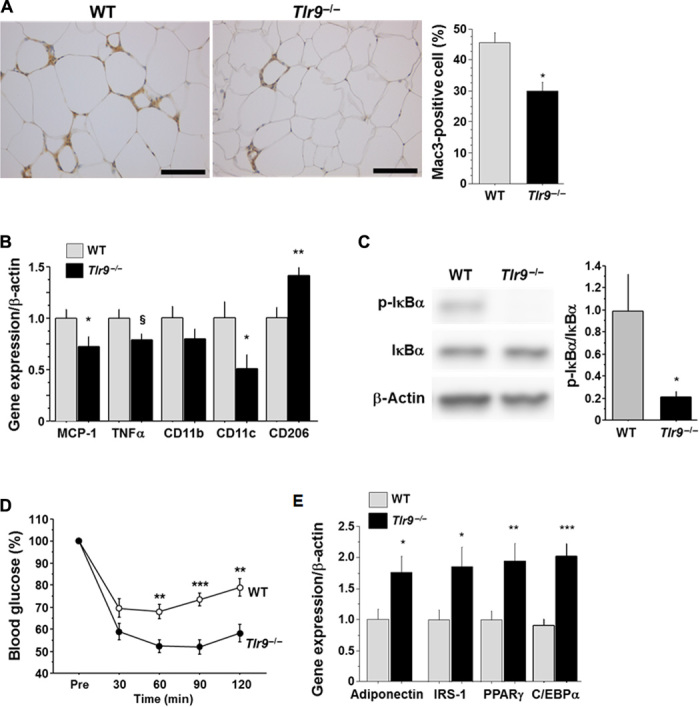
(A) Mac3 staining of epididymal fat obtained from WT or Tlr9−/− mice (n = 12 to 15). Scale bar, 100 μm. (B) Quantitative RT-PCR analysis of inflammatory gene expression in epididymal fat obtained from WT or Tlr9−/− mice (n = 12). (C) Western blot analysis of the phosphorylation of IκBα in epididymal fat obtained from WT or Tlr9−/− mice (n = 11). (D) Results of the insulin tolerance test (0.75 U/kg) of WT or Tlr9−/− mice (n = 13 to 16). (E) Quantitative RT-PCR analysis of epididymal fat for genes related to insulin sensitivity (n = 12). C/EBPα, CCAAT/enhancer binding protein α. All experiments in this figure were performed using samples obtained from mice fed a high-fat diet (HFD) for 12 weeks. §P = 0.05, *P < 0.05, **P < 0.01, and ***P < 0.001. All values are means ± SEM.
TLR9 in bone marrow promotes adipose tissue inflammation and insulin resistance
To evaluate the potential contribution of TLR9 in bone marrow (BM) cells to the pathogenesis of adipose tissue inflammation, we reconstituted the BM of Tlr9−/− mice with that of wild-type mice. Tlr9−/− mice whose BM cells were replaced by Tlr9−/− BM cells served as control chimeric mice. The presence or absence of TLR9 in BM did not affect metabolic parameters (table S2). BMT reduced body growth as reported in previous studies (33), although VAT weight was similar to that in nontransplanted mice in this study (fig. S13). Fluorescence in situ hybridization (FISH) of the X and Y chromosomes in the nuclei, prepared from spleen and quantitative reverse transcription polymerase chain reaction (RT-PCR) detection of Tlr9 in circulating white blood cells, demonstrated that more than 85% of recipient cells were replaced by donor cells (fig. S14). BM chimeric mice that have TLR9 only in BM cells showed more macrophage accumulation, higher expression of inflammatory molecules, and activation of NF-κB in VAT after a high-fat diet compared with control chimeric mice (Fig. 4, A to C). In association with these features of adipose tissue inflammation, BM chimeric mice that were restored with TLR9 only in BM showed more insulin resistance and less expression of genes that correlate with insulin sensitivity, compared with control chimeric animals (Fig. 4, D and E, and fig. S11B). These results suggested that activation of TLR9 in hematopoietic cells, at least partially, promotes adipose tissue inflammation and insulin resistance.
Fig. 4. Effects of hematopoietic restoration of TLR9 on adipose tissue inflammation and insulin resistance.
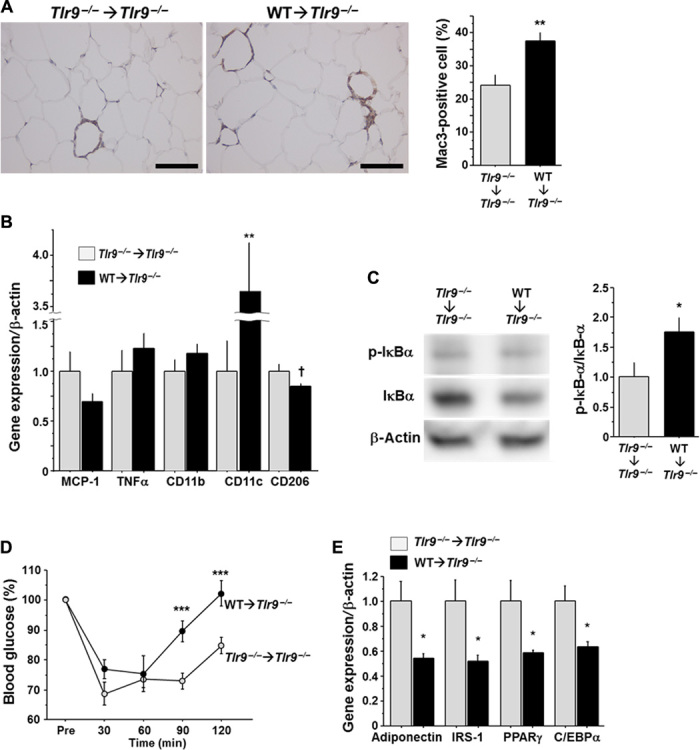
(A) Mac3 staining of epididymal fat obtained from BM chimeric mice (n = 7). Scale bar, 100 μm. (B) Quantitative RT-PCR analysis of inflammatory gene expression in epididymal fat obtained from BM chimeric mice (n = 7). (C) Western blot analysis of the phosphorylation of IκBα in epididymal fat obtained from BM chimeric mice (n = 6 to 7). (D) Results of insulin tolerance test (0.75 U/kg) of BM chimeric mice (n = 7 to 8). (E) Quantitative RT-PCR analysis of epididymal fat obtained from BM chimeric mice for genes related to insulin sensitivity (n = 7). All experiments in this figure were performed using samples obtained from mice fed a high-fat diet (HFD) for 12 weeks. †P = 0.06, *P < 0.05, **P < 0.01, and ***P < 0.001. All values are means ± SEM.
Administration of TLR9 antagonist attenuates adipose tissue inflammation and insulin resistance
Results of in vivo and in vitro experiments suggested that TLR9 contributes to insulin resistance by promoting inflammation in VAT. Therefore, we explored the therapeutic potential of TLR9 inhibition for obesity-induced adipose tissue inflammation and insulin resistance. We administered iODN2088 or its control oligonucleotide to fat-fed wild-type mice for 11 weeks. TLR9 inhibition with iODN2088 decreased MCP-1 and TNF-α expression in macrophages obtained by peritoneal lavage (Fig. 5A). TLR9-blocked mice showed heavier VAT compared with their controls (table S3); however, these mice showed reduced accumulation of macrophages in VAT (Fig. 5B). Results of quantitative RT-PCR demonstrated a higher expression of CD11c in VAT in iODN2088-treated mice, although the expression of TNF-α and the activation of NF-κB pathways were attenuated in the treated group (Fig. 5, C and D). In addition, as observed in Tlr9−/− mice, TLR9-blocked animals showed a better response to insulin and a higher expression of genes related to insulin sensitivity in VAT (Fig. 5, E and F, and fig. S11C). These results suggested that in vivo TLR9 blockade alters the inflammatory milieu by inhibiting macrophage accumulation and activation in adipose tissue, resulting in improvement of insulin sensitivity. Moreover, treatment with iODN2088 decreased the plasma level of triglycerides, albeit with no difference in food intake (table S3).
Fig. 5. Effects of in vivo blockade of TLR9 on adipose tissue inflammation and insulin resistance in WT mice.
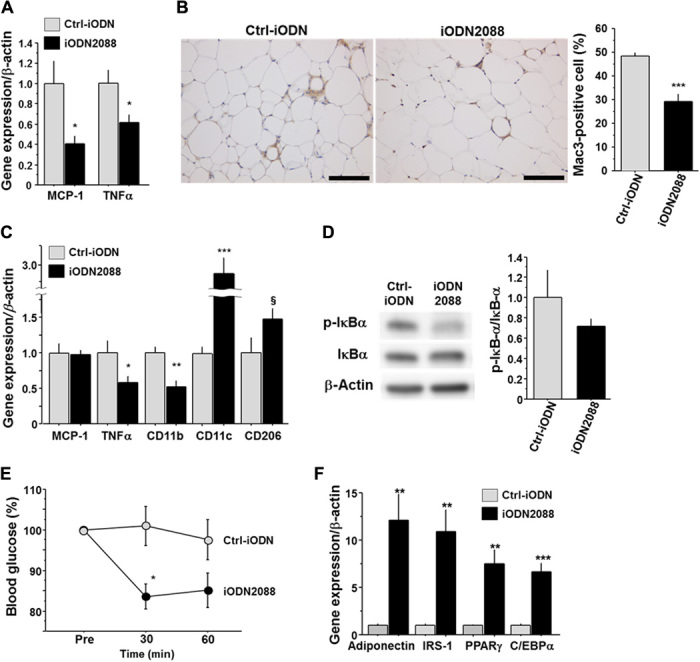
(A) Effects of intraperitoneal injection of iODN2088 on inflammatory gene expression in WT peritoneal macrophages (n = 5 to 6). (B) Mac3 staining of epididymal fat obtained from fat-fed WT mice treated with iODN2088 or its control (Ctrl-iODN) (n = 5 to 6). Scale bar, 100 μm. (C) Effects of in vivo iODN2088 treatment on inflammatory gene expression in epididymal fat (n = 5 to 6). (D) Effects of in vivo iODN2088 treatment on the phosphorylation of IκBα in epididymal fat (n = 5 to 6). (E) Response to intraperitoneal injection of insulin (1.0 U/kg) in iODN2088-treated or Ctrl-iODN–treated mice (n = 5 to 6). (F) Effects of in vivo iODN2088 treatment on the expression of genes related to insulin sensitivity in epididymal fat (n = 5 to 6). §P = 0.08, *P < 0.05, **P < 0.01, and ***P < 0.001. All values are means ± SEM.
Plasma level of ssDNA is associated with visceral obesity and insulin resistance in humans
Finally, we examined the clinical significance of cfDNA using human plasma samples collected upon medical examination at regional health checkups. Plasma concentration of ssDNA was significantly higher in patients with visceral obesity and positively correlated with visceral fat area (VFA), as determined by computed tomography (Fig. 6, A and B). Furthermore, plasma concentration of ssDNA positively correlated with the marker of insulin resistance, as measured by the homeostasis model assessment of insulin resistance (HOMA-IR) (Fig. 6C). ssDNA was a significant estimator for HOMA-IR even after correction by other confounding factors such as age, C-reactive protein, and VFA (table S4). This corresponds to the results of our mouse study and suggests that circulating ssDNA, which is associated with visceral obesity, serves, at least partially, as an instigator of insulin resistance in humans.
Fig. 6. Relationship between cfDNA and visceral obesity or insulin resistance in humans.
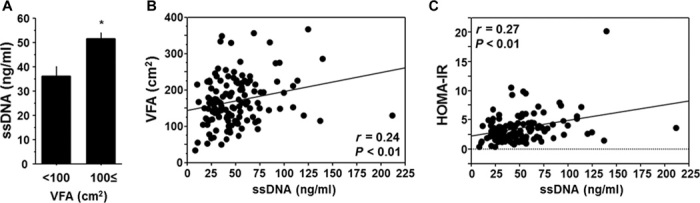
(A) Comparison of plasma ssDNA level between humans with and without computed tomography–determined visceral obesity (VFA ≥ 100 cm2). (B) Correlation between plasma ssDNA level and VFA. (C) Correlation between plasma ssDNA level and insulin resistance determined by HOMA-IR. Human plasma samples that were collected upon medical examination at regional health checkups were used (n = 131). *P < 0.05. All values are means ± SEM.
DISCUSSION
Understanding the molecular mechanisms of chronic inflammation in adipose tissue remains a major medical challenge. We found that obesity is associated with the release of cfDNA into plasma in mice and humans. Furthermore, results of our in vivo and in vitro experiments revealed that cfDNA released from degenerated adipocytes promotes the activation of macrophages, at least partially, via the TLR9 pathway, leading to the development of adipose tissue inflammation and insulin resistance.
In adipose tissue, hypertrophy and proliferation of adipocytes, angiogenesis, and contribution of immune cells are highly coordinated (10, 15, 16); however, obesity disrupts this balance, causing apoptosis and/or necrosis of adipocytes (22, 23). Degenerative changes observed in obese adipose tissue favor the hypothesis that obesity increases the release of cfDNA from adipocytes. Here, we demonstrated a higher ssDNA level in the circulating blood of obese subjects, which was associated with VAT weight in mice or VFA in humans. These results suggested that the increase in plasma ssDNA level was associated with fat mass. In addition, an in vitro experiment using differentiated 3T3-L1 adipocytes showed that TNF-α, an important cytokine associated with obesity-related insulin resistance, increased cfDNA release from adipocytes into a culture medium. These results suggested that visceral obesity increases the release of cfDNA.
Recent studies have demonstrated that cfDNA serves as an endogenous ligand for TLR9 (34, 35). Here, we found that macrophages, a key player in adipose tissue inflammation (12–14), express TLR9. Therefore, we hypothesized that the cfDNA-TLR9 pathway in macrophages contributes to the development of adipose tissue inflammation. To access this hypothesis in vivo, we used three mouse models. Tlr9−/− mice clearly demonstrated less inflammation and better insulin sensitivity compared with wild-type mice under a high-fat diet. BMT experiments demonstrated that Tlr9 deficiency in BM cells played a protective role in the development of adipose tissue inflammation and insulin resistance, although these effects were relatively modest compared with non-BMT Tlr9−/− mice because of the limitations of BMT experiments, such as reduced growth rate and transplantation efficacy (33). TLR9 expressed in cells other than BM-derived cells might also play a role. Results of experiments that used a TLR9 inhibitor supported the concept that TLR9 participates in the development of adipose tissue inflammation. These models convincingly demonstrated that the cfDNA-TLR9 pathway stimulated macrophage accumulation in adipose tissue and played a pivotal role in the development of adipose tissue inflammation and insulin resistance. Results of our in vitro experiments suggested that cfDNA released from degenerated adipocytes increased MCP-1 expression via TLR9 in wild-type macrophages. MCP-1 is an important chemoattractant for macrophages toward dead adipocytes (36). Both macrophages and adipocytes express MCP-1, although the production of MCP-1 in macrophages causes further monocyte/macrophage accumulation, accelerating adipose tissue inflammation (37). In addition, MCP-1 directly affects adipocyte function and insulin sensitivity (38, 39). Moreover, increased CD206 expression and decreased TNF-α expression in VAT were observed in Tlr9−/− mice. Experiments that used BM chimeric mice or a specific TLR9 inhibitor supported these results. Taken together, the cfDNA-TLR9 axis is involved in the accumulation and activation of macrophages, contributing, at least partially, to the development of adipose tissue inflammation and insulin resistance.
While this study was being conducted, Hong et al. (40) reported that TLR9 deficiency promoted insulin resistance in response to a high-fat diet, suggesting anti-inflammatory roles for TLR9 in macrophage activation. Previous studies demonstrated the role of TLR9 in the proinflammatory activation of macrophages related to innate immunity (7, 9). Our present study is in line with previous evidences on this. Several differences in study design, such as diet and duration of feeding, might cause discrepancies between their study and ours. In addition, our present study provided evidences that cfDNA released from degenerated adipocytes serves as an internal ligand of TLR9, which their study did not mention.
Compared with previous studies that reported plasma levels of cfDNA in patients with other inflammatory diseases, including cancer and systemic lupus erythematosus, the plasma cfDNA level in obese subjects reported in this study was low (3, 41, 42). The inflammation observed in obese subjects is more chronic and low grade compared with other diseases. We speculate that cfDNA level might associate with the progression of diseases. Moreover, recent studies demonstrated the relationship between the gut microbiota and metabolic syndrome (43). These studies suggested the translocation of bacterial components (such as DNA) and inflammatory factors (including lipopolysaccharide) in the host circulation under certain circumstances, accompanied by intestinal epithelium dysfunction caused by obesity or other metabolic disorders. In our present study, bacteria-specific DNA was not detected by PCR in plasma cfDNA, as was reported previously (44) (fig. S15), although we need to take into account DNA fragments originating from the gut microbiota when we explore the origin of cfDNA. Further studies are needed to clarify the role of the cfDNA-TLR9 axis in the development of obesity-related adipose tissue inflammation and insulin resistance.
Previous studies suggested that obesity-related adipocyte degeneration participates in the development of adipose tissue inflammation and obesity-associated complications (22, 23, 36). Our present study suggests that the cfDNA-TLR9 axis may participate in this process. In conclusion, cfDNA released by obesity-related adipocyte degeneration plays, at least partially, a causal role in the development of adipose tissue inflammation via TLR9. Our findings shed new insights into the pathogenesis of adipose tissue inflammation and suggest that the cfDNA-TLR9 axis might be a potential therapeutic target against obesity-induced insulin resistance.
MATERIALS AND METHODS
Animal experiments
C57BL/6 mice (wild-type mice) and Tlr9−/− mice (C57BL/6 background) were purchased from Japan SLC Inc. and Oriental Yeast Co. Ltd., respectively. Male mice were fed a high-fat diet (HFD-60; Oriental Yeast Co. Ltd.) from 8 weeks of age through the completion of the study.
BMT was performed as described previously (45). Five-week-old recipient mice were lethally irradiated (total, 9 Gy). On the following day, unfractionated BM cells harvested from donor mice were injected into recipient mice via tail-vein injection. At 2 weeks after BMT, all mice were started on a high-fat diet. Replacement rate after BMT was determined by FISH of the X and Y chromosomes in male recipient mice repopulated with female BM. Interphase nucleic slides were prepared from spleen samples using air-drying. FISH analysis was performed using mouse X and Y chromosome probes (Chromosome Science Labo) following the manufacturer’s protocol, and the signals were observed under an all-in-one fluorescence microscope (BZ-9000; Keyence Japan). We used only BM chimeric mice, in which more than 80% of BM had been replaced by donor BM. In addition, we examined the expression of Tlr9 in circulating white blood cells using quantitative RT-PCR. Erythrocytes were removed from heparinized peripheral blood using ACK lysing buffer (Thermo Fisher Scientific Inc.), and white blood cells were pelleted and processed for RNA extraction.
For in vivo TLR9 inhibition, phosphothioate-modified oligodeoxynucleotides—iODN2088 (5′-tcctggcggggaagt-3′) and negative control for iODN2088 (5′-tcctgagcttgaagt-3′)—were used (26). These oligodeoxynucleotides were synthesized with a low level of endotoxin (<0.5 endotoxin units/mg; Gene Design Inc.) and intraperitoneally administered to mice (150 μg) three times a week for 11 weeks, starting from 7 weeks of age.
All mice were housed under a 12-hour light/dark cycle, with food and water available ad libitum. All experimental procedures conformed to the guidelines for animal experimentation of Tokushima University.
Human samples
Plasma samples were obtained from 131 subjects (87 men and 44 women; mean ± SD age, 56 ± 12 years) who fasted overnight and underwent medical examination at regional health checkups. Patients who were being treated for hypertension, diabetes, or lipid disorder were excluded. Patients with a history of cardiovascular or cerebrovascular disease, severe hepatic disease, or severe renal disease, or who were receiving hormone replacement therapy were also excluded. The study protocols were approved by the local ethical committees, and written informed consent was obtained. Samples were stored at −80°C until use.
Extraction of cfDNA
Extraction of cfDNA from adipocyte CM and plasma was performed using QIAamp DNA Mini Kit (Qiagen), according to the manufacturer’s instructions. The concentrations of ssDNA and dsDNA in extracted cfDNA were measured using QuantiFluor ssDNA System (Promega) or Quant-iT PicoGreen dsDNA Assay Kit (Life Technologies), respectively, according to the manufacturers’ instructions. Plasma nucleosome level was also measured using a commercially available kit (Roche).
Cell culture experiments
Thioglycolate-stimulated peritoneal macrophages were collected from female wild-type mice or Tlr9−/− mice at the age of 8 to 10 weeks and cultured in Dulbecco’s modified Eagle’s medium containing 10% fetal bovine serum. Isolated peritoneal macrophages were used for experiments 24 hours after plating. Peritoneal macrophages were treated with CpG1826 or ODN1826 control (InvivoGen)—synthetic oligonucleotides that contain unmethylated CpG—for 4 hours. Peritoneal macrophages were also stimulated with CM or cfDNA obtained from the CM of 3T3-L1 differentiated adipocytes for 4 hours. For the in vivo TLR9 inhibition experiment, residential peritoneal macrophages were collected by peritoneal lavage with cold phosphate-buffered saline (PBS) and used immediately for analyses.
Mouse 3T3-L1 preadipocytes were differentiated as previously described (46). On day 8, 3T3-L1 differentiated adipocytes were used for collection of CM. Adipocytes were pretreated with or without TNF-α (50 ng/ml)under serum-starved conditions for 24 hours, and then cells were cultured for another 24 hours in a starvation medium without TNF-α. CM were collected after centrifugation and filtration through a 20-μm mesh to remove cell debris. For Transwell membrane coculture of macrophages and 3T3-L1 adipocytes, a Transwell membrane (pore size, 1 μm) was used. After pretreatment with or without TNF-α for 24 hours, 3T3-L1 adipocytes were cultured in a starvation medium for 24 hours without TNF-α and then used for coculture with macrophages.
Analysis of metabolic parameters
After a 24-hour fasting, blood sample was collected from the heart into an EDTA-containing tube. After centrifugation, plasma was stored at −80°C until the assay. Serum level of insulin (Shibayagi Co. Ltd.) and plasma levels of total cholesterol, triglycerides, and free fatty acids (Wako Diagnostics) were measured using commercially available kits. Insulin tolerance test was performed after a 4-hour fasting. Insulin solution (at a dose of 0.75 or 1.0 U/kg) was injected into the peritoneal cavity as indicated. Indirect calorimetry and physical activity measurements were performed after 10 to 12 weeks of high-fat diet. Details of indirect experiments had been described previously (47).
Fractionation of adipose tissue
Previous papers described the fractionation of adipose tissue (47). Epididymal fat pads were minced in PBS and incubated with collagenase (0.5 mg/ml) on a shaking platform for 40 min at 37°C. The mixture was then passed through a nylon filter (pore size, 250 μm) to remove undigested material, and the filtrate was centrifuged for 5 min at 200g and 4°C. Floating cells and pellets were recovered as mature adipocyte fraction and stromal vascular fraction, respectively.
Histological and immunohistochemical analyses
For tissue harvest, a 0.9% sodium chloride solution was perfused at a constant pressure via the left ventricle, and then tissues were removed immediately. Epididymal fat pads were fixed with formalin and embedded in paraffin. Tissues were sectioned serially (5 μm) and stained with hematoxylin and eosin for general morphological examination.
For immunohistochemical detection of macrophages, sections were incubated with anti-Mac3 antibody (BD Pharmingen) and stained using the avidin-biotin complex and ImmPACT DAB Peroxidase Substrate Kit (Vector Laboratories). Each section was counterstained with hematoxylin. Macrophage accumulation in fat tissue [Mac3-positive cells (in percentage)] was analyzed using the ratio of the number of Mac3-positive cells to the number of total cells (total number of nucleus) (48). For perilipin staining, sections were stained with anti-perilipin antibody (Abcam) followed by Alexa Fluor 588–conjugated anti-rabbit immunoglobulin (Ig) antibodies (Molecular Probes). Nuclei were counterstained with Hoechst 33258. The sections were mounted using ProLong Antifade Kit (Molecular Probes) and observed under a confocal microscope (Nikon A1R confocal microscope system; Nikon Instruments Inc.).
Electron microscopic analysis
For electron microscopy, samples were fixed in 4% paraformaldehyde containing 0.25% glutaraldehyde. Ultrathin sections obtained from embedded Epon blocks were stained with uranyl acetate and lead citrate and examined using an electron microscope (Hitachi H-7650).
For immunogold staining, samples were fixed in a 4% paraformaldehyde solution including 0.1% glutaraldehyde and 0.05% Triton X-100 and then embedded in glycol methacrylate. Ultrathin (80 to 100 nm) sections were incubated with 1% bovine serum albumin in 0.01 M PBS for 1 hour and rinsed with 0.01 M PBS for 15 min. The sections were incubated overnight with Anti-Single Stranded DNA (ssDNA) Rabbit IgG Affinity Purify (1:200 dilution; Immuno-Biological Laboratories Co. Ltd.) at 4°C. After the sections were washed with 0.01 M PBS, 10-nm gold-labeled goat anti-rabbit IgG (BBInternational) was applied as secondary antibody for 2 hours at room temperature. The sections were counterstained with uranyl acetate and Reynold’s lead citrate and then examined under an electron microscope (Hitachi H-7600). As negative controls for the immunohistochemical procedures, substitution of an identical concentration of nonimmune IgG for the primary antibody and direct incubation in colloidal gold without primary antibody were performed.
Quantitative RT-PCR
cDNA was synthesized from total RNA extracted from tissues and cells. Real-time quantitative RT-PCR was performed with an Mx3000P (Agilent Technologies) and Power SYBR Green PCR Master Mix (Applied Biosystems) using gene-specific primers (table S5). Data are expressed in arbitrary units normalized by β-actin.
Immunoblotting
Lysates prepared from tissues and cells in a lysis buffer containing a protease inhibitor cocktail (Roche) and a phosphatase inhibitor cocktail (Thermo Scientific) were separated with SDS–polyacrylamide gel electrophoresis gels. The following antibodies were used: perilipin (Abcam), IκBα, phospho-IκBα, IRS-1, phospho-IRS-1Ser307 (Cell Signaling), and β-actin (Sigma). Levels of expression were quantified by densitometry (ImageQuant LAS 4000mini; GE Healthcare Life Sciences).
Statistics
For continuous variables, data are expressed as means ± SEM. Comparisons between two groups were performed using unpaired Student’s t test. Comparisons of multiple groups were performed using one-way analysis of variance (ANOVA) followed by Tukey test. Linear regression analysis was used to evaluate the relationship between two variables. P < 0.05 was considered statistically significant.
Acknowledgments
We are grateful to E. Uematsu, Y. Saga (Tokushima University), H. Kato, Y. Sugawara (Tokyo University), M. Ito, C. Ohta, Y. Ogami, and Y. Mizuoka (Osaka University of Pharmaceutical Sciences) for their expert technical assistance. Funding: This work was partially supported by Japan Society for the Promotion of Science KAKENHI grants (grant 25460369 to D.F.; grant 23591314 to M. Shimabukuro; grants 24659392, 22390159, 25670390, and 25293184 to M. Sata; grant 23590267 to T.H.; grant 25860586 to Y. Higashikuni; and grant 25560368 to I.I.), Ministry of Education, Culture, Sports, Science, and Technology KAKENHI grant (grant 21117007 to M. Sata), and Banyu Life Science Foundation International (D.F.). Author contributions: D.F. designed and performed most of the experiments, interpreted the results, and prepared the manuscript. S.N. performed most of the experiments. Y. Higashikuni, K.T., Y. Hirata, S.Y., T.S., C.M., and I.I. assisted with in vivo experiments. F.S. and H.S. assisted with metabolic cage analyses, indirect calorimetry, and physical activity experiments. M.B. assisted with quantitative RT-PCR analysis. T.H. and J.K.-K. performed histological and electron microscopic studies. M. Shimabukuro contributed to data interpretation and critical reading of the manuscript. M. Sata interpreted the data and prepared the manuscript. All authors discussed the results and commented on the manuscript. Competing interests: The authors declare that they have no competing interests. Data and materials availability: All data needed to evaluate the conclusions in the paper are present in the paper and/or the Supplementary Materials. Additional data related to this paper may be requested from the authors.
SUPPLEMENTARY MATERIALS
Supplementary material for this article is available at http://advances.sciencemag.org/cgi/content/full/2/3/e1501332/DC1
Fig. S1. Correlations of cfDNA with epididymal fat weight, liver weight, and blood glucose level.
Fig. S2. Adipocyte degeneration induced by a high-fat diet.
Fig. S3. Effects of TLR9 agonist and antagonist on MCP-1 expression in macrophages.
Fig. S4. Effects of TLR9 agonist and antagonist on Tlr9−/− macrophages.
Fig. S5. Release of cfDNA from TNF-α–treated adipocytes.
Fig. S6. Expression of Tlr2, Tlr4, and Tlr7 in Tlr9−/− macrophages.
Fig. S7. Effects of TLR9 antagonist on macrophages treated with cfDNA.
Fig. S8. Level of obesity between Tlr9−/− mice and wild-type mice.
Fig. S9. Comparison of blood glucose and serum insulin levels between wild-type mice and Tlr9−/− mice.
Fig. S10. Food consumption and metabolic studies of mice.
Fig. S11. Insulin signaling in VAT obtained from fat-fed mice.
Fig. S12. Comparison between Tlr9−/− mice and wild-type mice fed NC.
Fig. S13. Level of obesity between BMT mice and non-BMT mice fed a high-fat diet.
Fig. S14. Replacement rate of BM cells after transplantation.
Fig. S15. Detection of bacterial DNA in plasma cfDNA.
Table S1. Comparison between Tlr9−/− mice and wild-type mice.
Table S2. Comparison between BM chimeric mice.
Table S3. Comparison between iODN2088 and control for iODN-treated wild-type mice.
Table S4. Multivariate analysis estimating HOMA-IR.
Table S5. Primer sequences.
REFERENCES AND NOTES
- 1.Jung K., Fleischhacker M., Rabien A., Cell-free DNA in the blood as a solid tumor biomarker—A critical appraisal of the literature. Clin. Chim. Acta 411, 1611–1624 (2010). [DOI] [PubMed] [Google Scholar]
- 2.Atamaniuk J., Hsiao Y.-Y., Mustak M., Bernhard D., Erlacher L., Fodinger M., Tiran B., Stuhlmeier K. M., Analysing cell-free plasma DNA and SLE disease activity. Eur. J. Clin. Invest. 41, 579–583 (2011). [DOI] [PubMed] [Google Scholar]
- 3.Atamaniuk J., Kopecky C., Skoupy S., Säemann M. D., Weichhart T., Apoptotic cell-free DNA promotes inflammation in haemodialysis patients. Nephrol. Dial. Transplant. 27, 902–905 (2012). [DOI] [PubMed] [Google Scholar]
- 4.Scharfe-Nugent A., Corr S. C., Carpenter S. B., Keogh L., Doyle B., Martin C., Fitzgerald K. A., Daly S., O’Leary J. J., O’Neill L. A. J., TLR9 provokes inflammation in response to fetal DNA: Mechanism for fetal loss in preterm birth and preeclampsia. J. Immunol. 188, 5706–5712 (2012). [DOI] [PubMed] [Google Scholar]
- 5.Borissoff J. I., Joosen I. A., Versteylen M. O., Brill A., Fuchs T. A., Savchenko A. S., Gallant M., Martinod K., ten Cate H., Hofstra L., Crijns H. J., Wagner D. D., Kietselaer B. L. J. H., Elevated levels of circulating DNA and chromatin are independently associated with severe coronary atherosclerosis and a prothrombotic state. Arterioscler. Thromb. Vasc. Biol. 33, 2032–2040 (2013). [DOI] [PMC free article] [PubMed] [Google Scholar]
- 6.Barrat F. J., Meeker T., Gregorio J., Chan J. H., Uematsu S., Akira S., Chang B., Duramad O., Coffman R. L., Nucleic acids of mammalian origin can act as endogenous ligands for Toll-like receptors and may promote systemic lupus erythematosus. J. Exp. Med. 202, 1131–1139 (2005). [DOI] [PMC free article] [PubMed] [Google Scholar]
- 7.Lee J.-G., Lim E.-J., Park D.-W., Lee S.-H., Kim J.-R., Baek S.-H., A combination of Lox-1 and Nox1 regulates TLR9-mediated foam cell formation. Cell. Signal. 20, 2266–2275 (2008). [DOI] [PubMed] [Google Scholar]
- 8.Marshak-Rothstein A., Toll-like receptors in systemic autoimmune disease. Nat. Rev. Immunol. 6, 823–835 (2006). [DOI] [PMC free article] [PubMed] [Google Scholar]
- 9.Vollmer J., TLR9 in health and disease. Int. Rev. Immunol. 25, 155–181 (2006). [DOI] [PubMed] [Google Scholar]
- 10.Hotamisligil G. S., Inflammation and metabolic disorders. Nature 444, 860–867 (2006). [DOI] [PubMed] [Google Scholar]
- 11.Shoelson S. E., Lee J., Goldfine A. B., Inflammation and insulin resistance. J. Clin. Invest. 116, 1793–1801 (2006). [DOI] [PMC free article] [PubMed] [Google Scholar]
- 12.Weisberg S. P., McCann D., Desai M., Rosenbaum M., Leibel R. L., Ferrante A. W. Jr, Obesity is associated with macrophage accumulation in adipose tissue. J. Clin. Invest. 112, 1796–1808 (2003). [DOI] [PMC free article] [PubMed] [Google Scholar]
- 13.Xu H., Barnes G. T., Yang Q., Tan G., Yang D., Chou C. J., Sole J., Nichols A., Ross J. S., Tartaglia L. A., Chen H., Chronic inflammation in fat plays a crucial role in the development of obesity-related insulin resistance. J. Clin. Invest. 112, 1821–1830 (2003). [DOI] [PMC free article] [PubMed] [Google Scholar]
- 14.Chawla A., Nguyen K. D., Goh Y. P. S., Macrophage-mediated inflammation in metabolic disease. Nat. Rev. Immunol. 11, 738–749 (2011). [DOI] [PMC free article] [PubMed] [Google Scholar]
- 15.Furukawa S., Fujita T., Shimabukuro M., Iwaki M., Yamada Y., Nakajima Y., Nakayama O., Makishima M., Matsuda M., Shimomura I., Increased oxidative stress in obesity and its impact on metabolic syndrome. J. Clin. Invest. 114, 1752–1761 (2004). [DOI] [PMC free article] [PubMed] [Google Scholar]
- 16.Sung H.-K., Doh K.-O., Son J. E., Park J. G., Bae Y., Choi S., Nelson S. M. L., Cowling R., Nagy K., Michael I. P., Koh G. Y., Adamson S. L., Pawson T., Nagy A., Adipose vascular endothelial growth factor regulates metabolic homeostasis through angiogenesis. Cell Metab. 17, 61–72 (2013). [DOI] [PubMed] [Google Scholar]
- 17.Rigamonti A., Brennand K., Lau F., Cowan C. A., Rapid cellular turnover in adipose tissue. PLOS One 6, e17637 (2011). [DOI] [PMC free article] [PubMed] [Google Scholar]
- 18.Strissel K. J., Stancheva Z., Miyoshi H., Perfield J. W. II, DeFuria J., Jick Z., Greenberg A. S., Obin M. S., Adipocyte death, adipose tissue remodeling, and obesity complications. Diabetes 56, 2910–2918 (2007). [DOI] [PubMed] [Google Scholar]
- 19.Pajvani U. B., Trujillo M. E., Combs T. P., Iyengar P., Jelicks L., Roth K. A., Kitsis R. N., Scherer P. E., Fat apoptosis through targeted activation of caspase 8: A new mouse model of inducible and reversible lipoatrophy. Nat. Med. 11, 797–803 (2005). [DOI] [PubMed] [Google Scholar]
- 20.Davis J. E., Braucher D. R., Walker-Daniels J., Spurlock M. E., Absence of Tlr2 protects against high-fat diet–induced inflammation and results in greater insulin-stimulated glucose transport in cultured adipocytes. J. Nutr. Biochem. 22, 136–141 (2011). [DOI] [PubMed] [Google Scholar]
- 21.Suganami T., Nishida J., Ogawa Y., A paracrine loop between adipocytes and macrophages aggravates inflammatory changes: Role of free fatty acids and tumor necrosis factor α. Arterioscler. Thromb. Vasc. Biol. 25, 2062–2068 (2005). [DOI] [PubMed] [Google Scholar]
- 22.Cinti S., Mitchell G., Barbatelli G., Murano I., Ceresi E., Faloia E., Wang S., Fortier M., Greenberg A. S., Obin M. S., Adipocyte death defines macrophage localization and function in adipose tissue of obese mice and humans. J. Lipid Res. 46, 2347–2355 (2005). [DOI] [PubMed] [Google Scholar]
- 23.Murano I., Barbatelli G., Parisani V., Latini C., Muzzonigro G., Castellucci M., Cinti S., Dead adipocytes, detected as crown-like structures, are prevalent in visceral fat depots of genetically obese mice. J. Lipid Res. 49, 1562–1568 (2008). [DOI] [PubMed] [Google Scholar]
- 24.van Montfoort M. L., Stephan F., Lauw M. N., Hutten B. A., Van Mierlo G. J., Solati S., Middeldorp S., Meijers J. C. M., Zeerleder S., Circulating nucleosomes and neutrophil activation as risk factors for deep vein thrombosis. Arterioscler. Thromb. Vasc. Biol. 33, 147–151 (2013). [DOI] [PubMed] [Google Scholar]
- 25.Kono H., Rock K. L., How dying cells alert the immune system to danger. Nat. Rev. Immunol. 8, 279–289 (2008). [DOI] [PMC free article] [PubMed] [Google Scholar]
- 26.Oka T., Hikoso S., Yamaguchi O., Taneike M., Takeda T., Tamai T., Oyabu J., Murakawa T., Nakayama H., Nishida K., Akira S., Yamamoto A., Komuro I., Otsu K., Mitochondrial DNA that escapes from autophagy causes inflammation and heart failure. Nature 485, 251–255 (2012). [DOI] [PMC free article] [PubMed] [Google Scholar]
- 27.Diana J., Simoni Y., Furio L., Beaudoin L., Agerberth B., Barrat F., Lehuen A., Crosstalk between neutrophils, B-1a cells and plasmacytoid dendritic cells initiates autoimmune diabetes. Nat. Med. 19, 65–73 (2013). [DOI] [PubMed] [Google Scholar]
- 28.Hoque R., Sohail M., Malik A., Sarwar S., Luo Y., Shah A., Barrat F., Flavell R., Gorelick F., Husain S., Mehal W., TLR9 and the NLRP3 inflammasome link acinar cell death with inflammation in acute pancreatitis. Gastroenterology 141, 358–369 (2011). [DOI] [PMC free article] [PubMed] [Google Scholar]
- 29.Imaeda A. B., Watanabe A., Sohail M. A., Mahmood S., Mohamadnejad M., Sutterwala F. S., Flavell R. A., Mehal W. Z., Acetaminophen-induced hepatotoxicity in mice is dependent on Tlr9 and the Nalp3 inflammasome. J. Clin. Invest. 119, 305–314 (2009). [DOI] [PMC free article] [PubMed] [Google Scholar]
- 30.Prins J. B., Niesler C. U., Winterford C. M., Bright N. A., Siddle K., O’Rahilly S., Walker N. I., Cameron D. P., Tumor necrosis factor-α induces apoptosis of human adipose cells. Diabetes 46, 1939–1944 (1997). [DOI] [PubMed] [Google Scholar]
- 31.Keuper M., Blüher M., Schon M. R., Möller P., Dzyakanchuk A., Amrein K., Debatin K.-M., Wabitsch M., Fischer-Posovszky P., An inflammatory micro-environment promotes human adipocyte apoptosis. Mol. Cell. Endocrinol. 339, 105–113 (2011). [DOI] [PubMed] [Google Scholar]
- 32.Tamai M., Shimada T., Hiramatsu N., Hayakawa K., Okamura M., Tagawa Y., Takahashi S., Nakajima S., Yao J., Kitamura M., Selective deletion of adipocytes, but not preadipocytes, by TNF-α through C/EBP- and PPARγ-mediated suppression of NF-κB. Lab. Invest. 90, 1385–1395 (2010). [DOI] [PubMed] [Google Scholar]
- 33.Schiller N. K., Kubo N., Boisvert W. A., Curtiss L. K., Effect of γ-irradiation and bone marrow transplantation on atherosclerosis in LDL receptor–deficient mice. Arterioscler. Thromb. Vasc. Biol. 21, 1674–1680 (2001). [DOI] [PubMed] [Google Scholar]
- 34.Guillerey C., Mouriès J., Polo G., Doyen N., Law H. K. W., Chan S., Kastner P., Leclerc C., Dadaglio G., Pivotal role of plasmacytoid dendritic cells in inflammation and NK-cell responses after TLR9 triggering in mice. Blood 120, 90–99 (2012). [DOI] [PubMed] [Google Scholar]
- 35.Welner R. S., Pelayo R., Nagai Y., Garrett K. P., Wuest T. R., Carr D. J., Borghesi L. A., Farrar M. A., Kincade P. W., Lymphoid precursors are directed to produce dendritic cells as a result of TLR9 ligation during herpes infection. Blood 112, 3753–3761 (2008). [DOI] [PMC free article] [PubMed] [Google Scholar]
- 36.West M., Dead adipocytes and metabolic dysfunction: Recent progress. Curr. Opin. Endocrinol. Diabetes Obes. 16, 178–182 (2009). [DOI] [PubMed] [Google Scholar]
- 37.Bie J., Zhao B., Song J., Ghosh S., Improved insulin sensitivity in high fat- and high cholesterol–fed Ldlr−/− mice with macrophage-specific transgenic expression of cholesteryl ester hydrolase: Role of macrophage inflammation and infiltration into adipose tissue. J. Biol. Chem. 285, 13630–13637 (2010). [DOI] [PMC free article] [PubMed] [Google Scholar]
- 38.Kanda H., Tateya S., Tamori Y., Kotani K., Hiasa K.-I., Kitazawa R., Kitazawa S., Miyachi H., Maeda S., Egashira K., Kasuga M., MCP-1 contributes to macrophage infiltration into adipose tissue, insulin resistance, and hepatic steatosis in obesity. J. Clin. Invest. 116, 1494–1505 (2006). [DOI] [PMC free article] [PubMed] [Google Scholar]
- 39.Sartipy P., Loskutoff D. J., Monocyte chemoattractant protein 1 in obesity and insulin resistance. Proc. Natl. Acad. Sci. U.S.A. 100, 7265–7270 (2003). [DOI] [PMC free article] [PubMed] [Google Scholar]
- 40.Hong C.-P., Yun C. H., Lee G.-W., Park A., Kim Y.-M., Jang M. H., TLR9 regulates adipose tissue inflammation and obesity-related metabolic disorders. Obesity 23, 2199–2206 (2015). [DOI] [PubMed] [Google Scholar]
- 41.van der Vaart M., Pretorius P. J., Is the role of circulating DNA as a biomarker of cancer being prematurely overrated? Clin. Biochem. 43, 26–36 (2010). [DOI] [PubMed] [Google Scholar]
- 42.Zhang S., Lu X., Shu X., Tian X., Yang H., Yang W., Zhang Y., Wang G., Elevated plasma cfDNA may be associated with active lupus nephritis and partially attributed to abnormal regulation of neutrophil extracellular traps (NETs) in patients with systemic lupus erythematosus. Intern. Med. 53, 2763–2771 (2014). [DOI] [PubMed] [Google Scholar]
- 43.Konrad D., Wueest S., The gut-adipose-liver axis in the metabolic syndrome. Physiology 29, 304–313 (2014). [DOI] [PubMed] [Google Scholar]
- 44.Such J., Francés R., Muñoz C., Zapater P., Casellas J. A., Cifuentes A., Rodríguez-Valera F., Pascual S., Sola-Vera J., Carnicer F., Uceda F., Palazón J. M., Pérez-Mateo M., Detection and identification of bacterial DNA in patients with cirrhosis and culture-negative, nonneutrocytic ascites. Hepatology 36, 135–141 (2002). [DOI] [PubMed] [Google Scholar]
- 45.Fukuda D., Sata M., Ishizaka N., Nagai R., Critical role of bone marrow angiotensin II type 1 receptor in the pathogenesis of atherosclerosis in apolipoprotein E–deficient mice. Arterioscler. Thromb. Vasc. Biol. 28, 90–96 (2008). [DOI] [PubMed] [Google Scholar]
- 46.Frost S. C., Lane M. D., Evidence for the involvement of vicinal sulfhydryl groups in insulin-activated hexose transport by 3T3-L1 adipocytes. J. Biol. Chem. 260, 2646–2652 (1985). [PubMed] [Google Scholar]
- 47.Hosooka T., Noguchi T., Kotani K., Nakamura T., Sakaue H., Inoue H., Ogawa W., Tobimatsu K., Takazawa K., Sakai M., Matsuki Y., Hiramatsu R., Yasuda T., Lazar M. A., Yamanashi Y., Kasuga M., Dok1 mediates high-fat diet–induced adipocyte hypertrophy and obesity through modulation of PPAR-γ phosphorylation. Nat. Med. 14, 188–193 (2008). [DOI] [PubMed] [Google Scholar]
- 48.Fukuda D., Aikawa E., Swirski F. K., Novobrantseva T. I., Kotelianski V., Gorgun C. Z., Chudnovskiy A., Yamazaki H., Croce K., Weissleder R., Aster J. C., Hotamisligil G. S., Yagita H., Aikawa M., Notch ligand delta-like 4 blockade attenuates atherosclerosis and metabolic disorders. Proc. Natl. Acad. Sci. U.S.A. 109, E1868–E1877 (2012). [DOI] [PMC free article] [PubMed] [Google Scholar]
Associated Data
This section collects any data citations, data availability statements, or supplementary materials included in this article.
Supplementary Materials
Supplementary material for this article is available at http://advances.sciencemag.org/cgi/content/full/2/3/e1501332/DC1
Fig. S1. Correlations of cfDNA with epididymal fat weight, liver weight, and blood glucose level.
Fig. S2. Adipocyte degeneration induced by a high-fat diet.
Fig. S3. Effects of TLR9 agonist and antagonist on MCP-1 expression in macrophages.
Fig. S4. Effects of TLR9 agonist and antagonist on Tlr9−/− macrophages.
Fig. S5. Release of cfDNA from TNF-α–treated adipocytes.
Fig. S6. Expression of Tlr2, Tlr4, and Tlr7 in Tlr9−/− macrophages.
Fig. S7. Effects of TLR9 antagonist on macrophages treated with cfDNA.
Fig. S8. Level of obesity between Tlr9−/− mice and wild-type mice.
Fig. S9. Comparison of blood glucose and serum insulin levels between wild-type mice and Tlr9−/− mice.
Fig. S10. Food consumption and metabolic studies of mice.
Fig. S11. Insulin signaling in VAT obtained from fat-fed mice.
Fig. S12. Comparison between Tlr9−/− mice and wild-type mice fed NC.
Fig. S13. Level of obesity between BMT mice and non-BMT mice fed a high-fat diet.
Fig. S14. Replacement rate of BM cells after transplantation.
Fig. S15. Detection of bacterial DNA in plasma cfDNA.
Table S1. Comparison between Tlr9−/− mice and wild-type mice.
Table S2. Comparison between BM chimeric mice.
Table S3. Comparison between iODN2088 and control for iODN-treated wild-type mice.
Table S4. Multivariate analysis estimating HOMA-IR.
Table S5. Primer sequences.