
FIGURE.
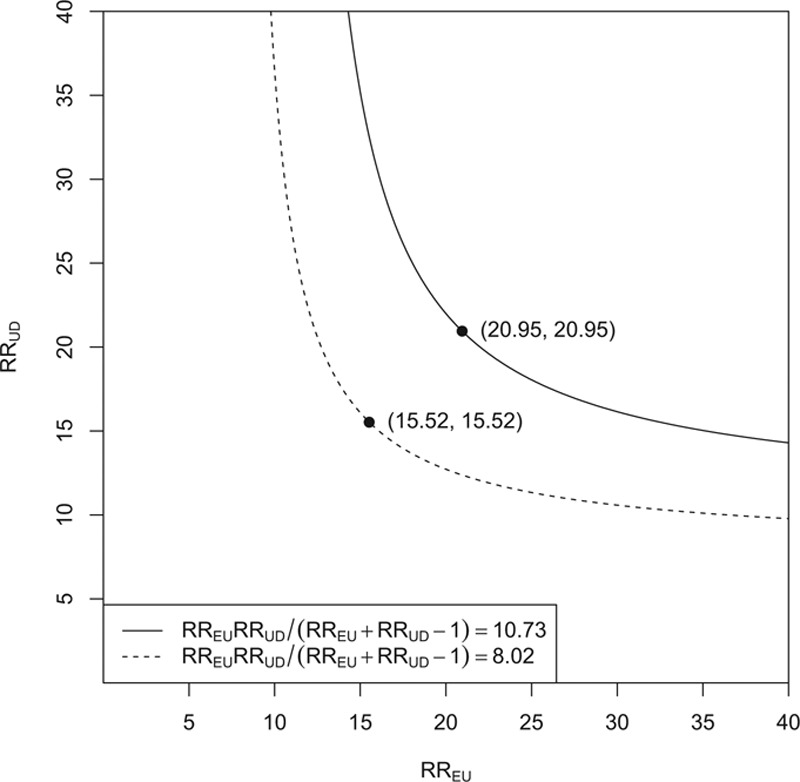
The areas above the two lines are the joint values of the exposure–confounder association RREU and the confounder–outcome association RRUD that can would be required to explain away the effect estimate 10.73 and the lower confidence limit 8.02.