Abstract
NMR ligand affinity screening is a powerful technique that is routinely used in drug discovery or functional genomics to directly detect protein–ligand binding events. Binding events can be identified by monitoring differences in the 1D 1H NMR spectrum of a compound with and without protein. Although a single NMR spectrum can be collected within a short period (2—10 min per sample), one-by-one screening of a protein against a library of hundreds or thousands of compounds requires a large amount of spectrometer time and a large quantity of protein. Therefore, compounds are usually evaluated in mixtures ranging in size from 3 to 20 compounds to improve the efficiency of these screens in both time and material. Ideally, the NMR signals from individual compounds in the mixture should not overlap so that spectral changes can be associated with a particular compound. We have developed a software tool, NMRmix, to assist in creating ideal mixtures from a large panel of compounds with known chemical shifts. Input to NMRmix consists of an 1H NMR peak list for each compound, a user-defined overlap threshold, and additional user-defined parameters if default settings are not used. NMRmix utilizes a simulated annealing algorithm to optimize the composition of the mixtures to minimize spectral peak overlaps so that each compound in the mixture is represented by a maximum number of nonoverlapping chemical shifts. A built-in graphical user interface simplifies data import and visual evaluation of the results.
Keywords: mixture optimization, NMR-based small molecule screening, protein−ligand interactions, software tools
Introduction
Ligand affinity screening by nuclear magnetic resonance (NMR) spectroscopy is a versatile method routinely used to support drug discovery and functional proteomics research.1−3 The real power of NMR ligand affinity screens arises from its ability to directly detect protein–ligand binding events under native or near-native sample conditions. The most common NMR screening approaches (i.e., line-broadening,4 STD-NMR,5 and WaterLOGSY4) are focused on detecting changes in the 1D 1H spectrum of a ligand upon binding to a protein. Hundreds of compounds can be analyzed in a day by coupling these benefits to an automated sample changer, software to optimize probe tuning and other parameters, and rapid NMR data collection of with a cryogenic probe.6
Compounds are usually evaluated in mixtures to improve the efficiency of NMR ligand affinity screens. The use of mixtures provides two significant benefits: (1) a larger number of compounds can be screened in a shorter amount of time and (2) the amount of protein required for the entire screen is reduced; however, mixtures suffer from drawbacks. As the size of a mixture increases, so does the probability that a mixture contains more than one compound competing for the same binding site, thus weakening the NMR observable binding event for each compound.7 Also, compounds in the mixture may react or interact with each other, leading to chemical changes, lowered solubility, or aggregation.8,9 Finally, the NMR signals from the multiple compounds may overlap, leading to ambiguity in analyzing the binding results and the necessity for rescreening with individual compounds. This last problem can be mitigated by creating mixtures with minimal to no peak overlaps, but the task is onerous and impractical for typical screening libraries composed of hundreds or thousands of compounds. A previous investigation has shown that mixtures with minimal peak overlap could be efficiently created by using a simulated annealing algorithm;10 however, robust software that implements the algorithm into effective practice is not available.
Here we describe NMRmix, a freely available, open-source software solution that utilizes a simulated annealing algorithm to generate mixtures with minimal peak overlap. NMRmix was written in Python 2.7 (https://www.python.org) and utilizes the Qt 5 framework (http://www.qt.io) with PyQt5 bindings (https://www.riverbankcomputing.com) to build a graphical user interface (GUI). The input to NMRmix consists of a list of peaks from 1D 1H NMR spectra for each compound, a target value for the number of compounds in each mixture, and a user-defined parameter that specifies overlap ranges for the peaks. In optimizing mixtures NMRmix utilizes a scoring function that considers the proportion of peaks in a compound that are overlapped as well as the intensity of the peaks. The graphical interface supports access to customizable parameters, downloads of peak list data, interactive views of simulated spectra for each mixture, and graphs of statistics. NMRmix outputs regions of interest (ROIs)11 in a simple, text-based tabular format that can be used to automate the analysis of NMR ligand affinity screening data. NMRmix can be built on most operating systems (Linux, Mac OSX, and Windows), and it is available preinstalled in the NMRFAM Virtual Machine (http://www.nmrfam.wisc.edu/software).
Materials and Methods
Importing the Compound Library and Peak Lists
Generating optimized NMR mixtures in NMRmix requires information on the compounds to be mixed as well as a peak list containing the 1H chemical shifts for each compound. NMRmix offers a number of convenient methods and formats for importing compound data. The compound information can be added manually within the NMRmix interface, or it can be imported from a CSV (comma-separated values) file that contains the information for all of the compounds in the library. The only required compound information for optimization is the name of the compound, a unique identifier, and the source of the peak list. Additional characteristics, such as SMILES strings or stock solution solvent, can also be included to provide enhancements within NMRmix. The 1H NMR peak lists can be imported from either local or online sources. NMRmix can input peak list data in several file formats: Bruker Topspin, Agilent VnmrJ, Mestrelab Mnova, ACD/NMR, NMR-STAR, HMDB chemical shift values, or a manually created peak list file. By providing the relevant compound identifiers, NMRmix can download data from the Biological Magnetic Resonance data Bank (BMRB) standard compound database12 or the Human Metabolome Database (HMDB).13
NMRmix provides a helpful interface for visually inspecting the imported data and for setting user-specified parameters. For example, overall statistics about the compound library, including chemical shift histograms and aromaticity, can be examined. The user can set particular spectral regions to be ignored when creating mixtures; these ignore regions may contain NMR signals from solvents, buffers, or internal standards that will be present across multiple samples. Peaks that fall within specified ignore regions are not considered in scoring overlaps, and the peak list statistics in NMRmix are updated to indicate which compounds have peaks in ignore regions.
To evaluate NMRmix, we selected 872 entries from the BMRB standards database with associated 1H peak lists. The removal of duplicate compounds reduced this list to 795 compounds. The characteristics of these compounds were added to a CSV file in the format required by NMRmix (available in the Supporting Information). Upon import into NMRmix, another 59 compounds were removed because they lacked 1H chemical shifts for one or more hydrogens. The resulting virtual library of 736 compounds was used to create simulated mixtures. For the purpose of evaluating optimization by NMRmix, no ignore regions were set.
Scoring Overlaps
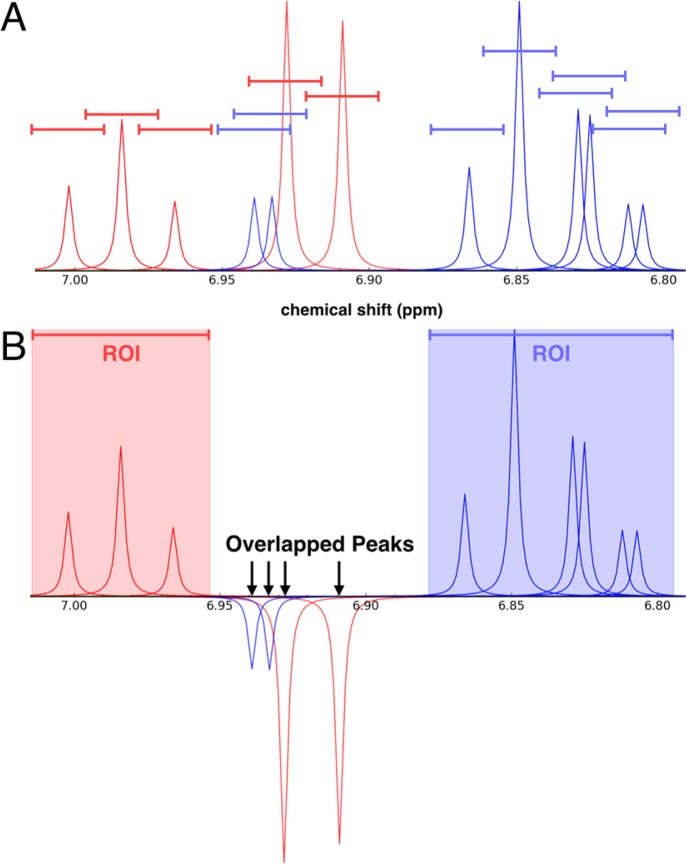
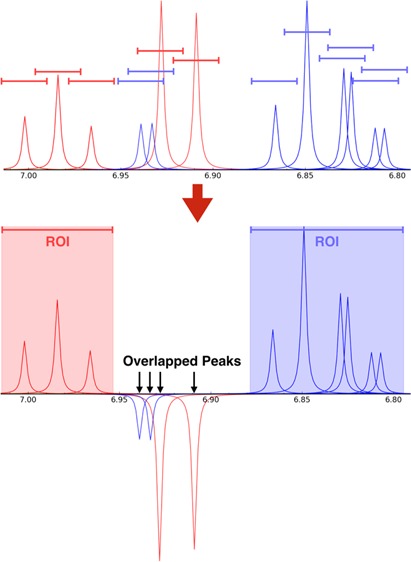
To determine whether an overlap occurs in a mixture, each 1H NMR signal in each compound is assigned a spectral range defined by a tolerance δ (in ppm) added to and subtracted from its chemical shift value c (c ± δ in ppm) (Figure 1A). This user-defined overlap range effectively represents the spectral region belonging to each peak of a compound. An overlap in a mixture occurs when the overlap range of a peak for one compound overlaps with the overlap range of a peak from a different compound (Figure 1B). Overlaps are not registered when evaluating peaks from the same compound. The overlap range can be set independently for each peak in a compound, or a single global value for all peaks can be used.
Figure 1.
(A) Simulated 1D 1H NMR spectrum of a mixture containing phenol (red peaks) and 4-chlorocatechol (blue peaks). The colored lines centered above each peak, which represent overlap ranges of 0.025 ppm, define the overlap regions. (B) This same mixture as viewed in NMRmix: peaks from different compounds whose ranges overlap are inverted; and, elsewhere, overlapping peak ranges from a given compound form a region of interest (ROI) for that compound.
The goal of generating mixtures with no overlaps is frequently not achievable, owing to the number of compounds in each mixture and the distribution of 1H NMR chemical shifts in the compound library. Overlaps that do occur should not represent a significant proportion of the peaks belonging to any one compound in the mixture to minimize the ambiguity in identifying compounds in a mixture. Therefore, instead of using the total number of overlaps to optimize the mixtures, NMRmix uses a scoring function based on the proportion of peaks in each compound that are overlapped
where SC represents the overlap score for the compound, k represents the score scaling function, NO represents the number of peaks in the compound that are overlapped, and NT represents the total number of peaks in the compound. In this approach, the penalty associated with an overlap is lower in a compound with a large number of peaks when compared with a compound that has only a few or just one peak.
NMRmix also has the ability to use peak intensities as a factor in evaluating the optimization of mixtures. In most NMR ligand-detect screening approaches (e.g., line-broadening, STD, or WaterLOGSY), identifying a binding event depends on monitoring changes in the line width, intensity, or position of peaks belonging to a compound. The presence of nearby strong signals can hinder the detection of such changes in weak signals. To minimize this problem, NMRmix offers an optional scoring function (SC*) for use in optimizing mixtures
where SC* represents the modified overlap score for the compound, k represents the score scaling function, IO represents the sum of all of the intensities of the overlapped peaks in the compound, and IT represents the sum of all of the intensities of all of the peaks in the compound.
Optimizing Mixtures
Once the peak lists have been loaded, the overlap range defined, and the ignore regions set, NMRmix creates an initial randomized set of mixtures prior to optimization. By default, the maximum size of each mixture is five compounds; however, this value can be changed to any mixture size between 2 and 20 compounds. NMRmix will automatically create the necessary number of mixtures such that each mixture contains the maximum number of compounds (e.g., 736 compounds with a maximum mixture size of 5 will generate 148 mixtures).
The optimization of mixtures in NMRmix occurs through simulated annealing. In brief, a small number of compounds from different mixtures are swapped during each step of the annealing process. The number of compounds being swapped (the mixing rate) is a user-defined parameter that can be specified prior to optimization. After each annealing step, the new arrangement of compounds in the mixtures is evaluated based on a total overlap score, which is either accepted or rejected. This process continues until the maximum number of annealing steps (set by the user) is reached or stops before if none of the mixtures contains overlaps.
The total overlap score (ST) used to evaluate each arrangement of compounds in the mixtures is simply the sum of all of the overlap scores for each compound (SC or SC*) in their respective mixtures
During each step of the annealing process, if the total overlap score for the new arrangement of mixtures is less than or equal to the total overlap score of the current arrangement of mixtures, the new arrangement is automatically accepted; however, to minimize the possibility that the total overlap score for the mixtures becomes trapped in a local minimum due to a particular arrangement of compounds in the mixtures, each step of the simulated annealing process in which the total overlap score increases is evaluated according to a modified Boltzmann probability
where P is the probability of acceptance, ΔST is the difference between the total overlap score of the new set of mixtures and that of the current set of mixtures, kT is the temperature scaling factor (default 25 000), kS is the score scaling factor (default 10 000), M is the mixing rate, and T is the step temperature. To facilitate the calculation of a probability of acceptance, each annealing step is associated with a “temperature” value that decreases on each successive step. At the beginning of the annealing process, when the temperature is higher, the probability for accepting a more overlapped arrangement of compounds is greater (Figure 2). Even a new arrangement at a temperature of 10 000 that increases the total overlap score by 20 000 (equivalent to two completely overlapped compounds) still has an 8.2% chance of acceptance. Each subsequent step of the annealing process lowers the temperature, thus lowering the base acceptance probability. In most cases, once the temperature reaches approximately 100 (using default parameters), the probability of acceptance becomes zero.
Figure 2.
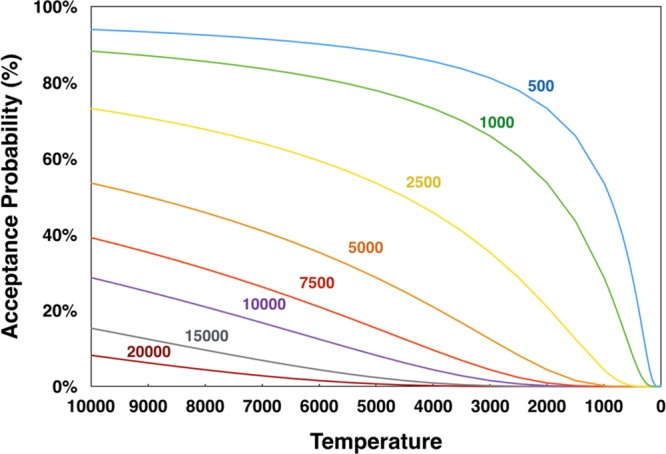
Temperature dependence of the Boltzmann acceptance probability as a function of ΔST, the difference between the total overlap score of the new set of mixtures and that of the current set of mixtures, with ΔST values: (blue) 500; 1000 (green); 2500 (yellow); 5000 (orange); 7500 (red); 10 000 (violet); 15 000 (gray); and 20 000 (maroon). The calculations of acceptance probabilities used the default values for the temperature scaling factor (25 000), score scaling factor (10 000), and mixing rate (2).
Prior to optimization, users are able to define several parameters of the optimization process, including: maximum mixture size (default 5), starting temperature (default 10 000), final temperature (default 25), maximum number of steps (default 100 000), mixing rate (default 2), and number of optimization iterations (default 5). Unless otherwise stated, the default parameters were used for the cases described here.
Viewing Results and Output
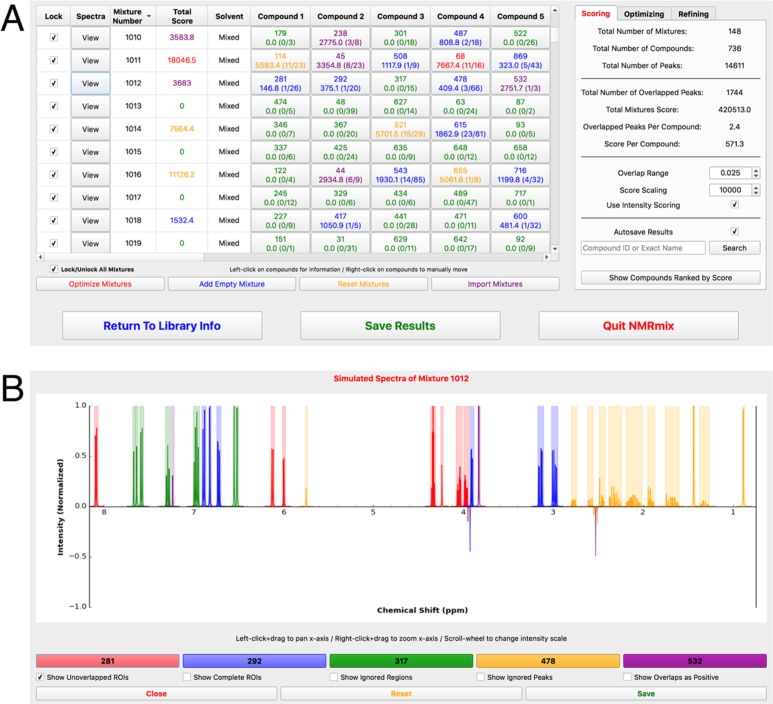
The NMRmix GUI provides several features that facilitate the viewing of results: peak list statistics, mixture optimization analysis, an interactive mixture table, and a simulated mixture spectrum viewer. The primary view of NMRmix is the interactive mixture table (Figure 3A), which shows the current state of the mixtures. Each row of the mixture table represents one mixture that is labeled by a unique mixture identifier, the overlap score for the mixture, the identity and overlap score of each compound in the mixture, and the primary solvent (if any). Overlap scores for both the mixture and the individual compounds are color-coded to visually indicate the degree of overlap. When any scoring parameter (score scale, overlap range, or intensity scoring) is changed by using NMRmix’s GUI functions, an automatic update of the table is triggered, resulting in updates to the scores and colors consistent with the new scoring scheme. Additionally, clicking on the compound information in the mixture table produces a pop-up window showing more information about the individual compound (i.e., its structure, simulated spectrum, peak list, etc.). Finally, each row of the mixture table includes a button to view a simulated spectrum of the mixture (Figure 3B) with the peaks from each compound in the mixture displayed in a different color. The simulated mixture spectrum is interactive: it allows scrolling and zooming and provides an effective way to visually evaluate each mixture. Any mixtures containing overlapped peaks will, by default, display those peaks as negative peaks, which makes identifying the location of the overlaps a simple process. The simulated mixture spectrum also displays colored ROIs for the nonoverlapped regions of the spectrum. These ROIs are created directly from the overlap range of each nonoverlapped peak. If two or more ROIs from the same compound overlap, the ROIs are merged into a single ROI that spans the range of all of the merged ROIs. These ROIs indicate the areas of the spectrum where peak identities should be unambiguous (Figure 1B).
Figure 3.
(A) Representation of the mixing table view of NMRmix: Each row of the table represents a mixture and displays the compounds within each mixture and the overlap scores for each individual compound as well as the entire mixture. These mixtures were created using the default parameters, intensity scoring, and only 2500 annealing steps. (B) Simulated spectrum view of mixture 1012 from the mixing table. This mixture contains cytidine-5′-monophosphate (red), 3,4-dihydroxy-l-phenylalanine (blue), trans-2-hydroxycinnamic acid (green), adrenosterone (yellow), and acetosyringone (purple). As indicated in the mixing table view, mixture 1012 should have six overlapped peaks; these are visible in NMRmix view as negative peaks. Also shown are the colored ROIs for unambiguous identification of each compound.
In addition to viewing results in NMRmix, all graphical outputs, such as graphs and spectra, can be saved locally on a computer as an image. Information regarding the optimized mixtures can also be stored in the convenient and portable CSV (spreadsheet) format. The saved information includes: the arrangement of compounds in each mixture, the ignore regions used, the compound library, the parameters, a list of all of the peaks, and the ROIs. Stored results can also be imported back into NMRmix for further review and analysis.
Results and Discussion
BMRB Virtual Compound Library
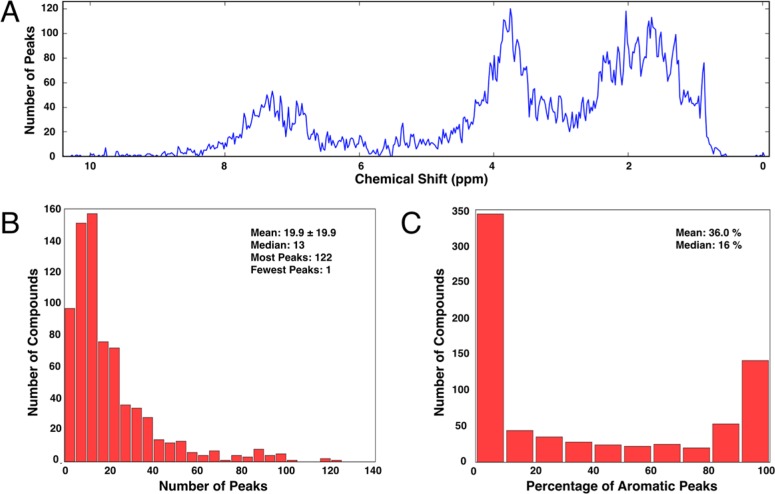
The 1H peak lists for the 736 compounds in the BMRB virtual library contained a total of 14 611 peaks. The distribution of the chemical shifts for these peaks showed that the majority were aliphatic (Figure 4A). A majority of the compounds had ≤20 peaks per compound (Figure 4B), indicative of their small size. Not only were most of the peaks aliphatic, nearly half of the compounds had only aliphatic peaks (Figure 4C). These statistics are not surprising because the BMRB virtual library consists of mostly small metabolites. Such a high density of aliphatic peaks may reasonably be expected to provide a challenge toward creating mixtures with nonoverlapped peaks; however, a previous analysis indicated that library size and peak distribution do not appear to significantly affect the results of optimization by simulated annealing,10 and this expectation was confirmed by the results of NMRmix shown below.
Figure 4.
NMRmix-generated representations of the peak list statistics for the virtual compound library imported from BMRB. (A) Histogram of the chemical shifts showing that the majority of the peaks occur in the low-frequency aliphatic region. (B) Histogram representing the number of peaks for each compound; the majority of the compounds have fewer than 20 peaks. (C) Percentage of aromatic peaks (≥4.7 ppm) per compound showing that nearly half of the compounds have <10% aromatic character.
In addition to providing statistics on the compound library peak list, NMRmix also makes it easy to evaluate the effects that solvents, buffers, and internal standards may have on the design of mixtures for ligand screening. Setting an ignore region in NMRmix for the residual water signal (4.6–4.9 ppm) that likely occurs in every aqueous NMR sample removed 209 peaks from 90 compounds. NMRmix results indicated that two of these compounds, formaldehyde and formamide, would be completely ignored (i.e., have no peaks outside the ignored region) and thus would not be used in any mixture. This feature of NMRmix can help inform which solvents, buffers, or internal standards would be best for the compound library being screened. For example, a comparison of four internal standards (sodium formate, DMSO, t-butanol, and benzoic acid) with the BMRB virtual compound library showed that sodium formate would likely make the best internal standard based solely on peak overlaps. The sodium formate ignore region (8.435–8.450 ppm) removed only 2 peaks from 2 compounds, whereas the DMSO ignore region (2.660–2.680 ppm) removed 50 peaks from 33 compounds, the t-butanol ignore region (1.235–1.245 ppm) removed 33 peaks from 30 compounds, and the benzoic acid ignore regions (7.456–7.491, 7.527–7.562, and 7.854–7.875 ppm) removed 139 peaks from 72 compounds. The only internal standard that eliminated all peaks from a compound was DMSO, which caused two of the compounds to be eliminated from the mixtures.
Evaluation of User-Defined Parameters
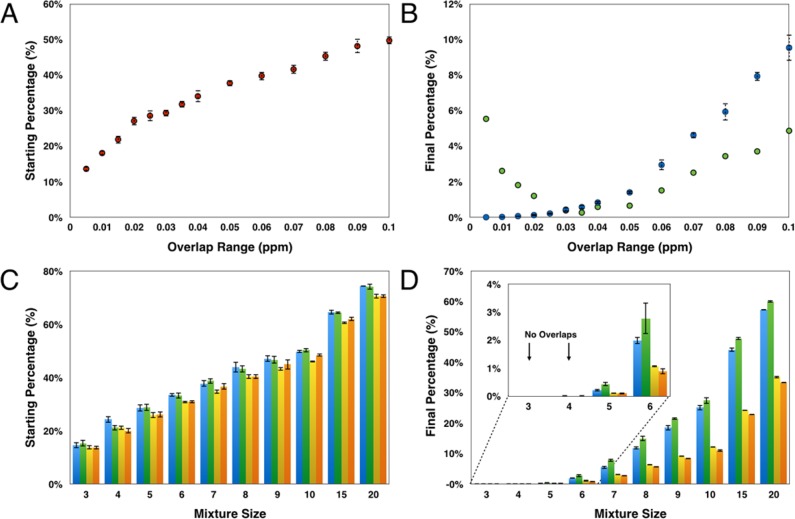
One of the most important parameters in NMRmix is the overlap range (the overlap range is twice the peak tolerance, measured in ppm units). This parameter is user-defined and can have a significant influence on the optimization results. It is not surprising that as the size of the overlap range increases the total overlap percentage (total number of overlapped peaks in library/total number of peaks in library) in the initial randomized mixtures prior to optimization also increases from 13.63 ± 0.70% at 0.005 ppm to 49.77 ± 1.06% at 0.010 ppm (Figure 5A). Mixture optimization serves to reduce the overlaps, although they still rise with larger overlap ranges (Figure 5B). With an overlap range of 0.005 ppm, NMRmix was able to create perfect mixtures with no overlaps. At 0.100 ppm, the total overlap percentage increased to 9.55 ± 0.74%.
Figure 5.
(A) Percentage of overlap ranges of various size present in randomly generated mixtures prior to optimization. (B) Percentage of overlap ranges of various size present following optimization through stimulated annealing with default parameters and 100 000 annealing steps: following scoring with the designated overlap range (blue) and after rescoring with an overlap range of 0.025 ppm (green). (C) Effect of mixture size on properties of random mixtures: total overlap percentage with standard scoring (blue); total overlap percentage with intensity scoring (green); total score percentage with standard scoring (yellow); and total score percentage with intensity scoring (orange). (D) Effect of mixture size on properties of mixtures following optimization with default parameters and 100 000 annealing steps: total overlap percentage with standard scoring (blue); total overlap percentage with intensity scoring (green); the total score percentage (yellow); and total score percentage with intensity scoring (orange).
It is important to set the overlap range to a value consistent with the NMR data to be collected. Important factors to consider are the line widths of the peaks and the broadening that may occur upon protein binding. Overlap ranges that are too small will result in the creation of mixtures in which signals from individual compounds cannot be separately resolved in the experimental data. Overlap ranges that are too large will exaggerate overlaps and skew the composition of the mixtures created to contain more real peak overlaps (Figure 5B). The compounds in the library have peak widths near the noise level between 0.005 and 0.015 ppm at 600 MHz, and thus we typically use an overlap range of 0.025 ppm in creating mixtures. We allow a small buffer in the overlap range beyond the peak width to allow for small chemical shift changes that may occur from changes in solution conditions or from interactions between components in the mixture.
In general, it is more efficient to use the largest practical number of compounds per mixture (mixture size) because it reduces the time required to screen a set of compounds and reduces the amount of protein needed; however, the potential reduction in time comes at the cost of increased peak density and thus a greater number of peak overlaps. This is abundantly clear when initial random mixtures of different sizes are compared (Figure 5C). At a mixture size of only 3, the percent total overlap averages 14.7 ± 1.1%; however, a mixture size of 20 has a starting total overlap percentage of 74.3 ± 0.2%. After NMRmix optimizes the mixture size for three and four compounds, a perfect mixture with no overlaps can be obtained in both cases. Optimizing a maximum mixture size of 20 compounds improves the overlap to only 57.2 ± 0.2% (Figure 5D). While keeping the mixture size small is more beneficial, NMRmix can still be used to optimize for the largest mixture size with minimal overlap.
Sometimes external factors may require mixtures to be larger than ideal. In these cases, an additional priority for mixture optimization is to ensure that the overlapped peaks are not those with the higher intensity. The NMRmix intensity scoring option can be used to create intensity-optimized mixtures. The benefit of overlap scoring can be seen in the case of a mixture containing selenomethionine and N-α-acetyl-l-lysine. Of the total of 51 peaks from the two compounds, only 3 peaks are overlapped. With standard scoring, this corresponds to a total mixture score of 1323; however, when intensity scoring is used, the total mixture score jumps to 7318. The simulated spectrum shows that two of the three overlapped peaks are the most intense peaks for each compound (Figure 6). Given that the intensity of the second largest peak for each compound is one-fourth the size of the largest peak, this mixture arrangement would be less than ideal in a situation where signal sensitivity is an issue.
Figure 6.
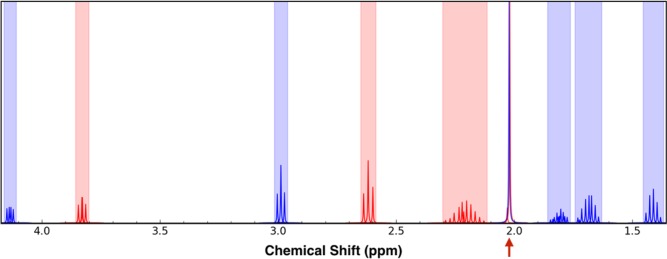
Simulated 1D 1H NMR spectrum representing a mixture containing selenomethionine (red peaks) and N-α-acetyl-l-lysine (blue peaks). An overlap between two selenomethionine peaks and one N-α-acetyl-l-lysine peak is indicated by the red arrow.
Because intensity scoring prioritizes the minimization of overlapped peaks with high peak intensities over the number of overlapped peaks, it is not surprising to find that optimizations using the intensity score may result in an increased total overlap percentage (Figure 5D); however, despite the increase in the number of overlaps, the total overlap score percentage (total overlap score for the library/total possible overlap score for the library) using intensity scoring is equal to or lower than the total overlap score percentage using standard scoring (Figure 5D), which indicates that overlaps that do occur are likely not the most intense peaks for the compounds. While this focus on intense peaks is useful for larger mixtures, standard scoring is still recommended for mixture sizes of three, four, or five compounds. At these smaller mixture sizes, the likelihood of generating mixtures without any overlaps is fairly high, and scoring based on the number of overlapped peaks is more efficient than intensity scoring.
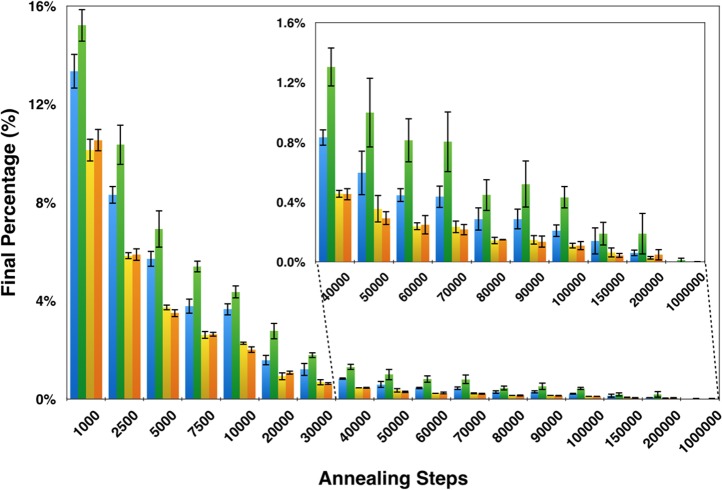
Generating optimized mixtures using simulated annealing requires the efficient sampling of different mixture states. Because the changes between each mixture state are small, a large number of annealing steps is required to efficiently mix the compounds. For the BMRB virtual library of 736 compounds with a maximum mixture size of 5, 1000 annealing steps led to a large reduction in the total overlap percentage (13.3 ± 0.7%) over that of the initial random mixtures (27.9 ± 1.5%) (Figure 7); however, the improvements became smaller as more annealing steps were used. At 100 000 steps, the total overlap percentage was 0.21 ± 0.04% (30 overlapped peaks for this compound library). At 200 000 steps, the total overlap decreased to 0.06 ± 0.02% (9 overlapped peaks). Finally, at 1 000 000 steps, NMRmix generated a mixture state without any overlaps. On a standard laptop, optimization of this compound library with 200 000 annealing steps and a maximum mixture size of 5 compounds can be completed in <15 min, while 1 000 000 steps for the same mixture size requires ∼1.25 h. Even when optimizing with 1 000 000 steps and a mixture size of 20 compounds, NMRmix takes only 15 h. Because mixtures are often used for multiple screens, increasing the number of annealing steps to achieve the most optimized results may be worth the greater investment in computational time.
Figure 7.
Effect of the number of annealing steps used for optimizing mixtures with default parameters and a maximum mixture size of five compounds: total overlap percentage with standard scoring (blue); total overlap percentage with intensity scoring (green); total score percentage with standard scoring (yellow); and total score percentage with intensity scoring (orange).
Conclusions
NMRmix is a powerful, freely available, open-source tool for generating mixtures of small molecules with minimal NMR peak overlap. The optimization of mixtures is accomplished by using a simulated annealing algorithm previously described.10 The user-friendly GUI facilitates easy mixture optimization and data analysis, and NMRmix only requires information about the compound library and a source for reference 1D 1H peak lists to get started. Additionally, NMRmix introduces the concept of intensity scoring, which penalizes overlaps that occur on the most intense peaks instead of treating overlaps of all peaks equally. After optimization, the resulting mixture table and ROI list can be exported to an easily readable CSV format. The availability of the ROI list in an easily readable format can also facilitate automation of data analysis for NMR-based ligand screening. The ranges of the ROI list can be easily extracted through scripting and imported into various NMR analysis tools as integration regions to automatically quantitate and compare spectra and identify hits. Future versions of NMRmix could include other non-NMR criteria, such as reactivity, solubility, aggregation, or structural similarity, into the score for optimizing mixtures. Additionally, NMRmix could be adapted toward optimizing mixtures for other nuclei used for NMR ligand affinity screens such as 19F-based screens.14,15
Acknowledgments
We thank the developers of the metabolomics database at BMRB (http://bmrb.wisc.edu/metabolomics/metabolomics_standards.shtml) for enabling this application to use the information it contains. Supported by National Institutes of Health grants P41GM103399 (in support of the National Magnetic Resonance Facility at Madison) and R01GM109046 (in support of the Biological Magnetic Resonance Data Bank).
Glossary
Abbreviations
- 1D
one-dimensional
- BMRB
Biological Magnetic Resonance data Bank
- CSV
comma-separated values
- D2O
deuterium oxide
- DMSO
dimethyl sulfoxide
- GUI
graphics user interface
- HMDB
Human Metabolome DataBase
- NMR
nuclear magnetic resonance
- NMRFAM
National Magnetic Resonance Facility At Madison
- ROI
region of interest
- SMILES
simplified molecular-input line-entry system
- STD
saturation transfer difference
Supporting Information Available
The Supporting Information is available free of charge on the ACS Publications website at DOI: 10.1021/acs.jproteome.6b00121. The NMRmix software is freely available from the NMRFAM Web site at http://www.nmrfam.wisc.edu/software.
BMRB virtual compound library referenced in the text in a file format appropriate for input into NMRmix. (CSV).
The authors declare no competing financial interest.
Supplementary Material
References
- Pellecchia M.; Bertini I.; Cowburn D.; Dalvit C.; Giralt E.; Jahnke W.; James T. L.; Homans S. W.; Kessler H.; Luchinat C.; Meyer B.; Oschkinat H.; Peng J.; Schwalbe H.; Siegal G. Perspectives on NMR in drug discovery: a technique comes of age. Nat. Rev. Drug Discovery 2008, 7, 738–45. 10.1038/nrd2606. [DOI] [PMC free article] [PubMed] [Google Scholar]
- Powers R. Advances in Nuclear Magnetic Resonance for Drug Discovery. Expert Opin. Drug Discovery 2009, 4, 1077–1098. 10.1517/17460440903232623. [DOI] [PMC free article] [PubMed] [Google Scholar]
- Powers R.; Mercier K. A.; Copeland J. C. The application of FAST-NMR for the identification of novel drug discovery targets. Drug Discovery Today 2008, 13, 172–9. 10.1016/j.drudis.2007.11.001. [DOI] [PMC free article] [PubMed] [Google Scholar]
- Hajduk P. J.; Olejniczak E. T.; Fesik S. W. One-dimensional relaxation-and-diffusion edited NMR methods for screening compounds that bind to macromolecules. J. Am. Chem. Soc. 1997, 119, 12257–12261. 10.1021/ja9715962. [DOI] [Google Scholar]
- Mayer M.; Meyer B. Characterization of ligand binding by saturation transfer different NMR spectroscopy. Angew. Chem., Int. Ed. 1999, 38, 1784–1788. . [DOI] [PubMed] [Google Scholar]
- Clos L. J. 2nd; Jofre M. F.; Ellinger J. J.; Westler W. M.; Markley J. L. NMRbot: Python scripts enable high-throughput data collection on current Bruker BioSpin NMR spectrometers. Metabolomics 2013, 9, 558–563. 10.1007/s11306-012-0490-9. [DOI] [PMC free article] [PubMed] [Google Scholar]
- Mercier K. A.; Powers R. Determining the optimal size of small molecule mixtures for high throughput NMR screening. J. Biomol. NMR 2005, 31, 243–58. 10.1007/s10858-005-0948-4. [DOI] [PubMed] [Google Scholar]
- Hann M.; Hudson B.; Lewell X.; Lifely R.; Miller L.; Ramsden N. Strategic pooling of compounds for high-throughput screening. J. Chem. Inf. Model. 1999, 39, 897–902. 10.1021/ci990423o. [DOI] [PubMed] [Google Scholar]
- Brown R. D.; Hassan M.; Waldman M. Combinatorial library design for diversity, cost efficiency, and drug-like character. J. Mol. Graphics Modell. 2000, 18 (427–37), 537. 10.1016/S1093-3263(00)80096-0. [DOI] [PubMed] [Google Scholar]
- Arroyo X.; Goldflam M.; Feliz M.; Belda I.; Giralt E. Computer-aided design of fragment mixtures for NMR-based screening. PLoS One 2013, 8, e58571. 10.1371/journal.pone.0058571. [DOI] [PMC free article] [PubMed] [Google Scholar]
- Lewis I. A.; Schommer S. C.; Markley J. L. rNMR: open source software for identifying and quantifying metabolites in NMR spectra. Magn. Reson. Chem. 2009, 47 (Suppl 1), S123–S123. 10.1002/mrc.2526. [DOI] [PMC free article] [PubMed] [Google Scholar]
- Ulrich E. L.; Akutsu H.; Doreleijers J. F.; Harano Y.; Ioannidis Y. E.; Lin J.; Livny M.; Mading S.; Maziuk D.; Miller Z.; Nakatani E.; Schulte C. F.; Tolmie D. E.; Kent Wenger R.; Yao H.; Markley J. L. BioMagResBank. Nucleic Acids Res. 2007, 36, D402–8. 10.1093/nar/gkm957. [DOI] [PMC free article] [PubMed] [Google Scholar]
- Wishart D. S.; Jewison T.; Guo A. C.; Wilson M.; Knox C.; Liu Y.; Djoumbou Y.; Mandal R.; Aziat F.; Dong E.; Bouatra S.; Sinelnikov I.; Arndt D.; Xia J.; Liu P.; Yallou F.; Bjorndahl T.; Perez-Pineiro R.; Eisner R.; Allen F.; Neveu V.; Greiner R.; Scalbert A. HMDB 3.0--The Human Metabolome Database in 2013. Nucleic Acids Res. 2013, 41, D801–7. 10.1093/nar/gks1065. [DOI] [PMC free article] [PubMed] [Google Scholar]
- Jordan J. B.; Poppe L.; Xia X.; Cheng A. C.; Sun Y.; Michelsen K.; Eastwood H.; Schnier P. D.; Nixey T.; Zhong W. Fragment based drug discovery: practical implementation based on (1)(9)F NMR spectroscopy. J. Med. Chem. 2012, 55, 678–87. 10.1021/jm201441k. [DOI] [PubMed] [Google Scholar]
- Vulpetti A.; Hommel U.; Landrum G.; Lewis R.; Dalvit C. Design and NMR-based screening of LEF, a library of chemical fragments with different local environment of fluorine. J. Am. Chem. Soc. 2009, 131, 12949–59. 10.1021/ja905207t. [DOI] [PubMed] [Google Scholar]
Associated Data
This section collects any data citations, data availability statements, or supplementary materials included in this article.


