Abstract
Aim:
We have shown that rutaecarpine extracted from the dried fruit of Chinese herb Evodia rutaecarpa (Juss) Benth (Wu Zhu Yu) promotes glucose consumption and anti-inflammatory cytokine expression in insulin-resistant primary skeletal muscle cells. In this study we investigated whether rutaecarpine ameliorated the obesity profiles, lipid abnormality, glucose metabolism and insulin resistance in rat model of hyperlipidemia and hyperglycemia.
Methods:
Rats fed on a high-fat diet for 8 weeks, followed by injection of streptozotocin (30 mg/kg, ip) to induce hyperlipidemia and hyperglycemia. One week after streptozotocin injection, the fat-fed, streptozotocin-treated rats were orally treated with rutaecarpine (25 mg·kg−1·d−1) or a positive control drug metformin (250 mg·kg−1·d−1) for 7 weeks. The body weight, visceral fat, blood lipid profiles and glucose levels, insulin sensitivity were measured. Serum levels of inflammatory cytokines were analyzed. IRS-1 and Akt/PKB phosphorylation, PI3K and NF-κB protein levels in liver tissues were assessed; pathological changes of livers and pancreases were examined. Glucose uptake and AMPK/ACC2 phosphorylation were studied in cultured rat skeletal muscle cells in vitro.
Results:
Administration of rutaecarpine or metformin significantly decreased obesity, visceral fat accumulation, water consumption, and serum TC, TG and LDL-cholesterol levels in fat-fed, streptozotocin-treated rats. The two drugs also attenuated hyperglycemia and enhanced insulin sensitivity. Moreover, the two drugs significantly decreased NF-κB protein levels in liver tissues and plasma TNF-α, IL-6, CRP and MCP-1 levels, and ameliorated the pathological changes in livers and pancreases. In addition, the two drugs increased PI3K p85 subunit levels and Akt/PKB phosphorylation, but decreased IRS-1 phosphorylation in liver tissues. Treatment of cultured skeletal muscle cells with rutaecarpine (20–180 μmol/L) or metformin (20 μmol/L) promoted the phosphorylation of AMPK and ACC2, and increased glucose uptake.
Conclusion:
Rutaecarpine ameliorates hyperlipidemia and hyperglycemia in fat-fed, streptozotocin-treated rats via regulating IRS-1/PI3K/Akt signaling pathway in liver and AMPK/ACC2 signaling pathway in skeletal muscles.
Keywords: rutaecarpine; metformin; fat-fed, streptozotocin-treated rats; metabolic syndrome; type 2 diabetes; hyperlipidemia; insulin receptor substrate-1; AMPK; acetyl-CoA carboxylase
Introduction
Diabetes mellitus (DM) is the third leading cause of death in developed countries, and the number of patients is still growing1,2. The World Health Organization (WHO) estimates that more than 347 million people worldwide suffer from diabetes, and the number is likely to more than double by 2030 without intervention. Moreover, most cases of type 2 diabetes mellitus (T2DM) are associated with obesity and high blood lipid profiles. Diabetes and high blood lipids can lead to metabolic syndrome (MetS) and eventually induce other conditions, such as heart disease3,4.
Thus, studies have focused on the development of drugs that regulate lipid and carbohydrate metabolism. Until now, potential clinical drugs have included insulin and its analogues, sulfonylureas, biguanides, thiazolidinediones (TZDs), meglitinides, α-glucosidase inhibitors, amylin analogues, incretin hormone mimetics, and dipeptidyl peptidase 4 (DPP4) inhibitors. Although these aforementioned drugs have significant effects, guidelines still recommend metformin monotherapy in most cases5,6,7,8. Metformin has been conclusively shown to reduce LDL cholesterol, triglyceride levels, hepatic glucose output and plasma insulin level and enhance insulin sensitivity of peripheral tissues, thereby increasing glucose uptake. It is used as the first-line anti-diabetic drug in clinic. In the WHO Model List of Essential Medicines of 2011, metformin is one of only two oral anti-diabetic drugs (the other one is glibenclamide)9. However, side effects, such as lactic acidosis and permanent nerve damage, limit its application in certain populations10,11.
The insulin receptor signaling pathway is a major mechanism underlying the development of diabetes and MetS. The IRS-1/phosphatidylinositol 3-kinase (PI3K)/Akt axis plays a key role in insulin receptor signaling transduction. Phosphorylation of IRS-1 Ser312 (Human)/307 (rodent) has been implicated in the inhibition of insulin signal transduction12,13. In contrast, phospho-IRS-1 participates in the down-regulation of PI3-kinase p85 activity and subsequent Akt phosphorylation. Akt phosphorylation induces metabolic syndrome and insulin resistance. Therefore, the IRS/PI3K/Akt axis transduces insulin receptor signaling.
AMP-activated protein kinase (AMPK) is a metabolic sensor, and it serves as one of the crucial targets for treatment of diseases associated with high blood glucose and lipid14,15. AMPK is composed of a catalytic (α) subunit and two regulatory (β, γ) subunits, and AMPK activation requires α subunit phosphorylation. AMPK is the major kinase regulator of acetyl-CoA carboxylase (ACC), and ACC2 plays an essential role in controlling fatty acid oxidation, making it a potential therapeutic target for obesity and related diseases16. The IRS-1/PI3K/Akt and AMPK pathways are therefore critical signaling pathways in the glucose metabolism regulation and appear to contribute to the development of insulin resistance.
Rutaecarpine is extracted from the dried fruit of Evodia rutaecarpa (Juss) Benth, which is known as the Chinese herb Wu Zhu Yu17. Various pharmacological effects have been reported for rutaecarpine, including analgesic effects, anti-inflammatory activity, atherosclerosis suppression, inotropic action on cardiomyocytes, and vasodilatory effects18,19,20. Rutaecarpine also reduces lipid accumulation in adipocytes by inhibiting adipogenesis/lipogenesis21. We recently reported that rutaecarpine promoted glucose consumption and anti-inflammatory cytokine expression in insulin-resistant primary skeletal muscle cells22, but the underlying mechanisms remain unclear.
In the present study, we generated a rat model treated with high-fat diet (HFD) plus low-dose streptozotocin (STZ) to mimic hyperlipidemia and hyperglycemia. We found that rutaecarpine exerted its effect by acting on two important insulin signaling pathways. Our findings suggest that rutaecarpine is a good drug candidate for treatment of lipid and carbohydrate metabolism disorders.
Materials and methods
Animals
The animal experiment protocol was approved by the Animal Experiment Ethics Committee of Shanghai University of Traditional Chinese Medicine, and all experimental animals were treated following the Guide for the Care and Use of Laboratory Animals published by the National Institutes of Health (NIH publication 85–23, revised 1986). Specific pathogen-free (SPF) male Sprague-Dawley (SD) rats (Sino-British SIPPR/BK Lab, Shanghai, China) weighing 200±20 g were housed (3 rats per cage) at 22±3 °C and 12-h light-dark cycles.
Chemicals and reagents
Rutaecarpine was purchased from Shanghai Tauto Biotech Co, Ltd (purity≥98%). STZ and metformin hydrochloride tablets were purchased from Sigma Company (MO, USA). Tween-80, citric acid (C6H8O7·H2O), trisodium citrate (NaC6H5O7·2H2O), CMC-Na and NaCl were obtained from National Pharmaceutical Group Chemical Reagent Co, Ltd. The blood glucose meter was from LIFESCAN Company (OneTouch Ultra, Johnson & Johnson, USA).
Induction of Fat-fed/STZ rat model
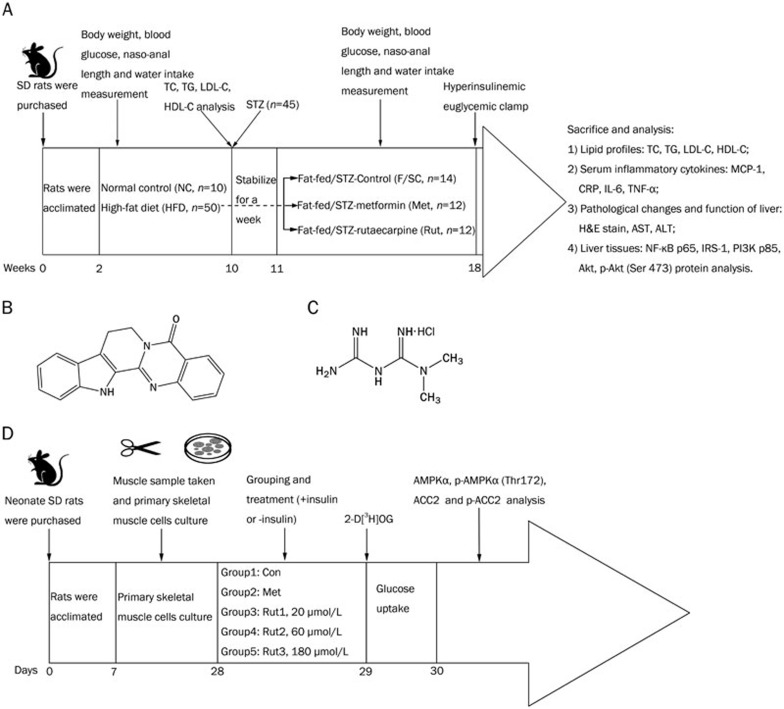
The fat-fed/STZ rat model was developed as previously described with modifications23,24. Sixty SPF male SD rats were acclimated for 2 weeks (weeks 0–2), then randomly divided into two groups: normal control (NC, n=10), and high-fat diet (HFD, n=50). Rats in the NC group were fed standard chow diet (23% protein, 49% carbohydrate, 8% fat), and rats in the HFD group received a high-fat diet (25.7% protein, 28.8% carbohydrate, 38.9% lard fat). After 8 weeks, the Lee obesity index values for rats in the HFD group were measured, and rats with an index greater than 300 were considered obese25. Obese rats were treated with STZ (30 mg/kg, ip), while control rats received an equal volume of vehicle. Seventy-two hours after STZ administration, tail vein blood glucose levels were measured, and rats with blood glucose levels higher than 16.7 mmol/L were considered hyperglycemic26.
Experimental animal group and treatment
At week 11 (1 week post-STZ injection), 38 Fat-fed/STZ rats were randomly divided into 3 groups based on blood glucose, body weight, and serum lipid levels:
Group 1: Fat-fed/STZ-Control (F/SC, solvent alone, ig, n=14);
Group 2: Fat-fed/STZ-rutaecarpine (Rut; 25 mg·kg−1·d−1, ig, n=12);
Group 3: Fat-fed/STZ-metformin (Met; 250 mg·kg−1·d−1, ig, n=12; Figure 1B).
Figure 1.
Animal and cell study protocols and chemical structures of rutaecarpine, metformin hydrochloride and streptozocin. (A) Animal study protocol and the effects of rutaecarpine on glycaemic and lipid profile of Fat-fed/STZ rats in vivo. (B) Chemical structure of rutaecarpine (C18H13N3O, molecular weight: 287.32). (C) Chemical structure of metformin hydrochloride (C4H11N5·HCl, molecular weight: 165.62). (D) Effects of rutaecarpine (20, 60, and 180 μmol/L) on glucose uptake and AMPKα, p-AMPKα, ACC2 and p-ACC2 in primary skeletal muscle cells in vitro.
See Figure 1A for outline of animal grouping and treatments.
Hyperinsulinemic euglycemic clamp (HEC)
The hyperinsulinemic-euglycemic clamp is recommended to assess insulin sensitivity, in which the glucose infusion rate (GIR) is considered to be a gold standard27,28. Following the published classical methods, we assessed the GIR values of 4 rats in each group at week 18. The 12-h fasted rats were anesthetized, the right jugular vein was cannulated for glucose and insulin infusion, and the left carotid artery was used for blood sampling. Glucose and insulin solutions were stored in two digital syringe pumps (Microinfusion Pump WZ-50C2, Hangzhou, China) and joined to the jugular catheter by a “Y” connector. Insulin (Mixtrad 30, Novo Nordisk, Denmark) was infused at a rate of 1.67 mU·kg−1·min−1 from 0 to 120 min. The euglycemic levels were clamped at 5.0±0.5 mmol/L by a variable infusion rate of 10% glucose. Blood glucose levels were monitored with a glucometer (OneTouch Ultra, Johnson & Johnson, USA), and the GIR was adjusted every 5 to 10 min as needed to maintain the euglycemic level. Clamping was achieved by 90 min and maintained for 30 min.
Blood collection and tissue preparation
At the end of the experiment (week 18), fasted (12 h) rats were weighed and anesthetized (1% sodium pentobarbital, 60 mg/kg body weight, ip). Blood samples were collected from the abdominal artery. Serum samples were isolated after centrifugation of whole blood at 10 000×g at −4 °C for 5 min, and stored at −20 °C. The visceral fat pads (epididymal, perirenal, and mesenteric) and the left liver were promptly removed, and the visceral fat wet-weight was measured. The liver tissues were divided into two sections; one was fixed in 10% formalin for histology analysis, and the other was immediately frozen in liquid nitrogen and transferred to −80 °C freezer until use.
Biochemistry assays
Total cholesterol (TC), triglyceride (TG), LDL-cholesterol (LDL-C), hepatic alanine transaminase (ALT) and aspartate transaminase (AST) were measured in serum samples by auto biochemistry analyzer (Olympus AU 600, Hamburg, Germany). The C-reactive protein (CRP), monocyte chemotactic protein (MCP-1), interleukin-6 (IL-6), and tumor necrosis factor-α (TNF-α) serum levels were measured by enzyme-linked immunosorbent assay (ELISA) (R&D Systems, Minneapolis, MN, USA).
Histopathological analysis
Liver tissue slides were stained with hematoxylin/eosin (H&E) and scored according to the criteria proposed by Hsieh29 and Ozden30. The degree of inflammation was based on the number of foci per low-power field: 0=absent, 1+=1 focus, 2+=2 or more foci, 3+=bridging or confluent. Fibrosis was staged according to the following index: 0=absent, 1+=focal or patchy nonbridging (<50% of low-power field), 2+=extensive nonbridging (>50% of low-power field), 3+=bridging, 4+=cirrhosis. Steatosis was estimated by the fraction of fat in liver cells: 0=absent, 1+=≤25%, 2+=25%−50%, 3+=50%−75%, 4+=≥75%. A total score was calculated for each liver sample and compared to the controls. Scoring was performed in a blinded manner by a pathologist.
The splenic portion of the pancreas from each rat was fixed in 10% buffered formalin and processed via the paraffin wax embedding method. Paraffin-embedded sections were cut at 4 μm thickness using a microtome (Leitz 1512, Germany) followed by H&E staining. Images were acquired on an Olympus microscope (Olympus IX70, Japan). Quantitative (morphometric) analysis was performed with ImageJ Software. Islet density was determined at 100× magnification, while islet diameter, islet area and islet cell number were determined at 400× magnification.
Primary skeletal muscle cell culture
Primary cultures of skeletal muscle cells were prepared from soleus skeletal muscle of 10 neonate SD rats as previously described31,32. Briefly, muscle tissue was dissected from the soleus and cut into small pieces using scissors, incubated with 0.75 mg/mL collagenase type I and 1.5 mg/mL trypsin in a Ca2+-Mg2+-free phosphate buffer for 20 min at 37 °C. After filtration through 100 μm, 200 μm, and 400 μm multilayer nylon membranes, the cells were collected by centrifugation at 150×g for 10 min and seeded onto 60-mm plates in a proliferation medium composed of DMEM/F12 (1:1), 10% FBS, 1% penicillin/streptomycin (Sigma, MO, USA). Twenty-four hours after plating, the plates were washed to eliminate non-adherent cells. The culture medium was renewed every three days, while cultures were monitored by daily observation under an inverted microscope (OLYMPUS, IX71, Japan). For differentiation, the growth medium was changed to 2% FBS medium at d 4 of culture. After 7 additional days, the primary skeletal muscle cells were ready for experiments. At this time, most of the myocytes had differentiated into multinucleated myotubes could be easily identified as muscle cells. Each condition was performed in triplicate.
Experimental skeletal muscle cell groups and treatments
After 48 h in differentiation media in which myotubes were formed, skeletal muscle cells were divided into the following 5 groups:
Group 1: Skeletal muscle cells −Control (Con, solvent alone, +insulin or −insulin);
Group 2: Skeletal muscle cells −Metformin (Met; 20 μmol/L, +insulin or −insulin);
Group 3: Skeletal muscle cells −Rutaecarpine1 (Rut1; 20 μmol/L, +insulin or −insulin);
Group 4: Skeletal muscle cells −Rutaecarpine2 (Rut2; 60 μmol/L, +insulin or −insulin);
Group 5: Skeletal muscle cells −Rutaecarpine3 (Rut3; 180 μmol/L, +insulin or −insulin).
The cells were harvested, lysed, and processed for glucose uptake assay and Western blot analysis after an additional 24 h or 48 h period. See Figure 1D for outline of in vitro experiment grouping and treatments.
Glucose transport in rat skeletal muscle cells
2-Deoxy-D-[1,2-3H(N)]glucose (2-D[3H]OG, Sigma, MO, USA) uptake in skeletal muscle cells was measured as previously described32. Briefly, primary cultured skeletal muscle cells were exposed to serum-free medium containing 0.5% BSA for 12 h. The cells were then incubated in the presence or absence of rutaecarpine (Rut1, 20 μmol/L; Rut2, 60 μmol/L; and Rut3, 180 μmol/L) with or without human insulin (10 U/L; Novolin R; Novo Nordisk) for 24 h. The preparations were rinsed to terminate the experimental treatment and then incubated for 20 min at 29 °C in 1.5 mL KHB buffer containing 8 mmol/L 2-D[3H]OG (2.25 mCi/mL), 2 mmol/L sodium pyruvate, and 0.1% BSA. To stop the reaction, the cells were immersed in ice-cold saline for 30 min and dissolved in 1 mol/L NaOH at 55 °C for 60 min. The extract was neutralized with 1 mol/L HCl, and 3H-labeled radioactivity was counted in the presence of a scintillation buffer. The blank containing KHB buffer or liquid scintillation buffer and the hot control of radioactive 2-D[3H]OG in the mixture were used for calibration. The readouts were normalized against total cellular protein, and 2-deoxyglucose uptake was calculated. Dose-response curves for in vivo insulin sensitivity in individual tissues were generated.
Western blot analysis
Protein lysates were prepared from liver tissues or primary cultured skeletal muscle cells as previously described33. Total protein from frozen liver samples (20–50 μg) was subjected to Western blot analysis using polyclonal antibodies against NF-κB p65. Skeletal muscle cells were rinsed twice with PBS and maintained on dry ice. The muscle cells were harvested and lysed in radioimmunoprecipitation assay (RIPA) buffer containing protease inhibitors and phosphatase inhibitors. Homogenates were incubated with end-over-end rotation at 4 °C for 1 h and centrifuged at 10 000 rounds per minute for 20 min at 4 °C. Protein concentrations were determined by BCA protein assay kit (Beyotime, Haimen, China). Homogenates were then lysed in 5× SDS loading buffer. SDS-PAGE was performed on a mini-vertical electrophoresis system (Bio-Rad Mini-PROTEAN®, Bio-Rad Laboratories, Hercules, CA, USA).
Equal amounts of total proteins from each sample were separated on a 10% acrylamide resolving gel (0.1% SDS, 1.5 mol/L Tris-HCl, pH 8.8) with a 5% acrylamide stacking gel (0.1% SDS, 0.5 mol/L Tris-HCl, pH 6.8). Electrophoresis was performed in electrode buffer (0.1% SDS, 0.25 mol/L glycine, 0.025 mol/L Tris-HCl, pH 8.3) at 60 V for 60 min, then switched to 100 V for 120 min or 240 min, and then transferred to nitrocellulose membranes. The membranes were blocked for 1 h or 3 h in TBST (0.14 mol/L NaCl, 0.02 mol/L Tris base, pH 7.5, and 0.1% Tween-20) containing 3% (w/v) bovine serum albumin (BSA), incubated with the primary antibodies NF-κB p65 (#4764, 1:1000), AMPKα (#2532, 1:1000), p-AMPKα (Thr172, #2535, 1:1000), ACC2 (#3662, 1:1000), p-ACC2 (#3661, 1:1000), IRS-1 (#2382, 1:1000), p-IRS-1 (Ser 307, #2381, 1:1000), PI3K p85 (#4292, 1:1000), Akt (#9272, 1:1000), and p-Akt (Ser 473, #9271, 1:1000) (Cell Signaling Technology, Beverly, MA, USA) overnight at 4 °C. The membrane was then washed with TBST for 5 min and repeated 5 times. Secondary antibodies (HRP, 1:2000, Abbkine, Redlands, CA, USA) were incubated for 1–2 h at room temperature. Antigen-antibody complexes were detected by ECL (Enhanced Chemiluminescence, Amersham, Picataway, UK). The housekeeping protein β-actin was used as a loading control. Each experiment was repeated three times on different gels and running buffers.
Statistical analysis
The data are expressed as the mean±SD. The difference between two groups was analyzed by Student's t test. Differences among multiple groups were analyzed by one-way ANOVA. Correlations between variables were evaluated by Pearson's product-moment correlation coefficient. Tests were performed using GraphPad Prism version 5.0 for Windows (GraphPad Software, San Diego, CA, USA). The acceptable value of significance was P<0.05.
Results
Effect of rutaecarpine on body weight, Lee obesity index and visceral fat of Fat-fed/STZ rats
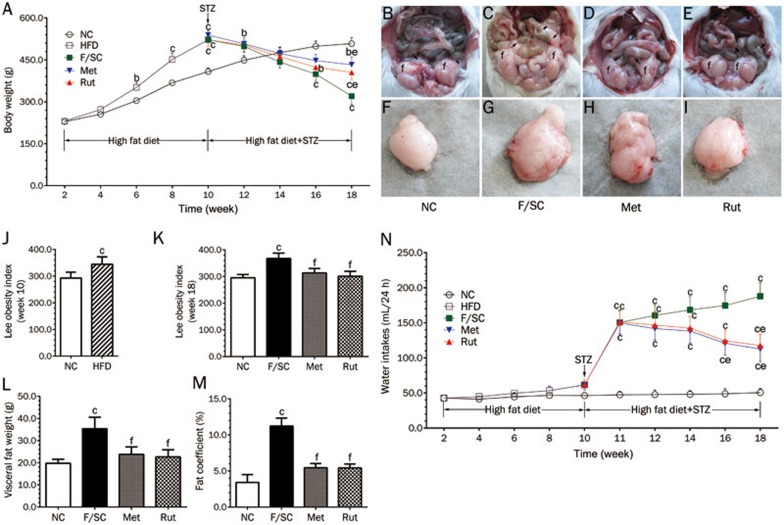
A high-fat diet for 8 weeks significantly increased body weight (Figure 2A) and Lee obesity index (Figure 2J) of rats. Injection of STZ (week 10) reduced body weight in all experimental groups (Figure 2A). Co-treatment of rutaecarpine with metformin effectively prevented STZ-induced body weight loss (Figure 2A). However, Fat-fed/STZ Rats showed a marked increase in the Lee obesity index at week 18 (Figure 2K). Similar to metformin, rutaecarpine significantly decreased the Lee obesity index in contrast to the F/SC group. As excess visceral fat is linked to T2DM34, IR35 and other obesity-related disorders36, we also examined the visceral fat weight level.
Figure 2.
Changes in body weight, Lee obesity index, visceral fat and water consumption in NC, F/SC, Met, Rut groups. (A) The body weight is increased with aging and facilitated by high fat diet (HFD). STZ single dose injection (week 10) decreased body weights which were reversed by rutaecarpine (Rut) and metformin (Met) at week 18 (F/SC: The rats treated with HFD plus low dose STZ as control group). (B) The head of the epididymis of a NC rat (arrow) with a slight mesenteric fat deposit (arrowhead) and epididymal fat (f). (C) The hidden epididymal head by the large amount of fat (arrow) and a high fatty deposit in the mesenterium (arrowhead) and epididymal fat (f) of a F/SC rat. (D and E) The hidden epididymal head by the middle amount of fat (arrow) and a high fatty deposit in the mesenterium (arrowhead) and epididymal fat (f) of Met and Rut rats. (F-I) Effect of rutaecarpine on visceral fat morphology of Fat-fed/STZ rats. (J) High fat diet (HFD) increases the Lee obesity index (measured at week 10). (K) The high-fat diet plus STZ treatment increase the Lee obesity index (measured at week 18) which is attenuated by rutaecarpine or metformin administration. (L) Visceral fat (epididymal, perirenal, and mesenteric; collected at week 18) and fat coefficient (M) were higher in F/SC group. Met and Rut markedly inhibited visceral fat weight. (N) The water consumption of individual rats were measured longitudinally before and after treatment. Values are mean±SD, n=10 in NC, n=50 in HFD, n=10 for F/SC, Met and Rut group respectively. bP<0.05, cP<0.01 vs NC; eP<0.05, fP<0.01 vs F/SC.
The fat deposits in F/SC rats were so large that it impeded visualization of the epididymal head (Figure 2C). Metformin treatment reduced the fat deposits. The effect of rutaecarpine was significantly higher than metformin (Figure 2D and 2E). Fat assays confirmed these results (Figure 2F–2I).
As a result (Figure 2L and 2M), the high fat diet markedly increased visceral fat and fat coefficient in the F/SC group. Rutaecarpine treatment and the positive control metformin significantly reduced the visceral fat weight and fat coefficient in obese-diabetes rats (Figure 2L and 2M, P<0.01). Water consumption was higher in the F/SC group compared to the NC group and was significantly reduced by rutaecarpine and the positive control metformin (P<0.05, Figure 2N).
Effect of rutaecarpine on lipid profiles of Fat-fed/STZ rats
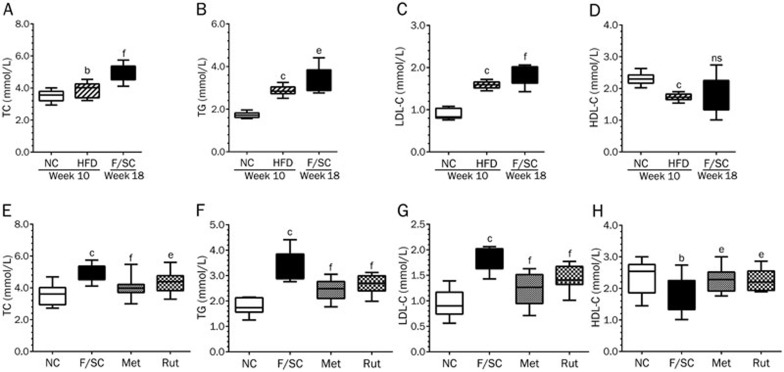
As lipid metabolism is highly associated with the development of type 2 diabetes, we examined TC, TG, LDL-C and HDL-C serum levels (Figure 3). The high fat diet markedly increased TC (Figure 3A), TG (Figure 3B), and LDL-C (Figure 3C), but decreased HDL-C (Figure 3D). Eight weeks after STZ injection, Fat-fed/STZ rats remained in good fat status (Figure 3A–3D). Consistent with our previous findings37, seven weeks treatment with rutaecarpine significantly decreased TC, TG, LDL-C and increased HDL-C in Fat-fed/STZ rats (Figure 3E–3H).
Figure 3.
The high fat diet (HFD) (week 10) and HFD plus STZ injection (F/SC) (week 18) elevated TC, TG, LDL-C and attenuated HDL-C (A–D). Seven weeks treatment with rutaecarpine or metformin in Fat-fed/STZ rats markedly decreased TC, TG, LDL-C and increased HDL-C (E–H). Values are expressed as mean±SD, n=50 in HFD group, n=10 in NC, F/SC, Met and Rut groups. bP<0.05, cP<0.01 vs NC; eP<0.05, fP<0.01 vs F/SC. No significance (ns) means P>0.05.
Effect of rutaecarpine on blood glucose and insulin sensitivity of Fat-fed/STZ rats
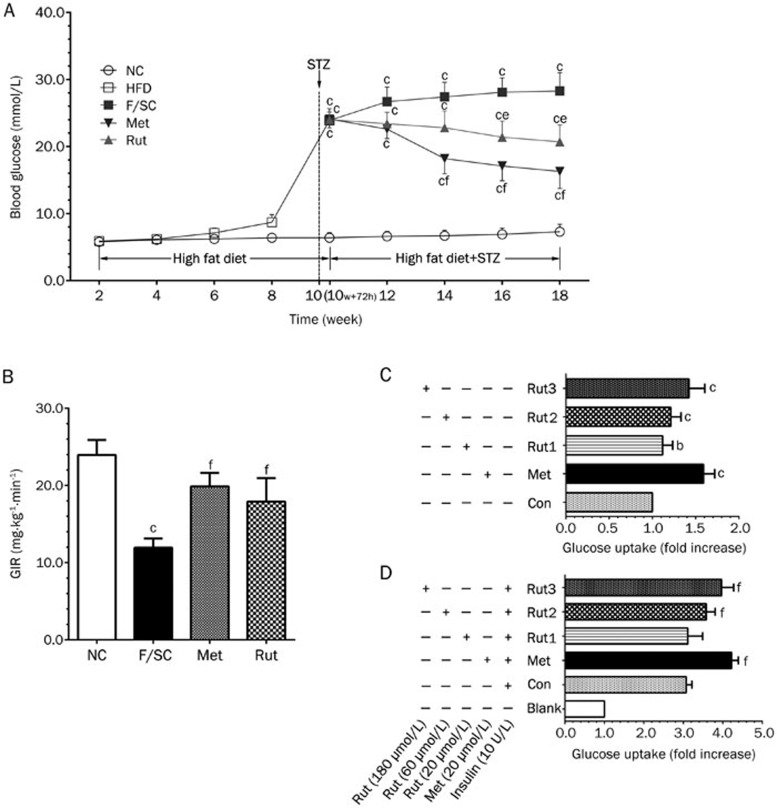
A single STZ injection increased blood glucose levels in F/SC rats (Figure 4A). Treatment with metformin and rutaecarpine (starting 1 week after STZ injection) decreased blood glucose levels at week 14 and 16, respectively, compared to the F/SC group.
Figure 4.
Rutaecarpine effect on glycaemic profile. (A) The high fat diet (HFD; week 2 to 10) did not inference the blood glucose levels significantly in all groups. Blood glucose is significantly increased 72 h post STZ injection (week 10+72 h). Treatment of herb element and metformin (1 week post STZ injection) in F/SC rats gradually decreased glucose levels. Values are expressed as mean±SD, n=50 in HFD group, n=10 in NC, F/SC, Met and Rut groups. (B) Changes of glucose infusion rate (GIR) by rutaecarpine. The hyperinsulinemic euglycemic clamp study shows that herb element (7 Weeks treatment) increased GIR markedly. Values are mean±SD, n=10. bP<0.05, cP<0.01 vs NC; eP<0.05, fP<0.01 vs F/SC. (C) Glucose uptake in skeletal muscle without insulin treatment. Rutaecarpine (Rut1: 20 μmol/L; Rut2: 60 μmol/L and Rut3: 180 μmol/L; 24 h treatment) dose-dependently facilitated glucose uptake. Values are mean±SD, n=6. bP<0.05, cP<0.01 compared to the Con (−insulin); (D) Skeletal muscle glucose uptake under inference of insulin (10 U/L). As the rutaecarpine concentration increasing, the glucose uptake of insulin-stimulated skeletal muscle cells also increased. Values are mean±SD, n=6 in each group. eP<0.05, fP<0.01 compared to the Con (+Insulin) group.
To further confirm the effect of rutaecarpine on glucose metabolism, we tested peripheral insulin sensitivity by using GIR values in the HEC method, which is the gold standard in assessing IR. As shown in Figure 4B, F/SC rats had markedly decreased GIR values compared to the NC group, indicating that Fat-fed/STZ significantly induced IR. Treatment with rutaecarpine and metformin effectively reversed the decrease in insulin sensitivity (Figure 4B).
Effect of rutaecarpine on glucose uptake in skeletal muscle cells
Insulin treatment leads to increased glucose uptake in adipocytes or skeletal muscle cells. Therefore, glucose uptake assay can also be used to indicate insulin sensitivity. In the absence of insulin treatment of skeletal muscle cells, we observed a direct concentration-dependent positive effect of rutaecarpine on glucose uptake (Figure 4C). Moreover, we examined the effect of rutaecarpine on glucose uptake in insulin-treated skeletal muscle cells (Figure 4D). Although insulin treatment alone significantly increased glucose uptake in skeletal muscles, we observed an additive effect of insulin and rutaecarpine.
Effect of rutaecarpine on AMPK and ACC2 in skeletal muscle cells
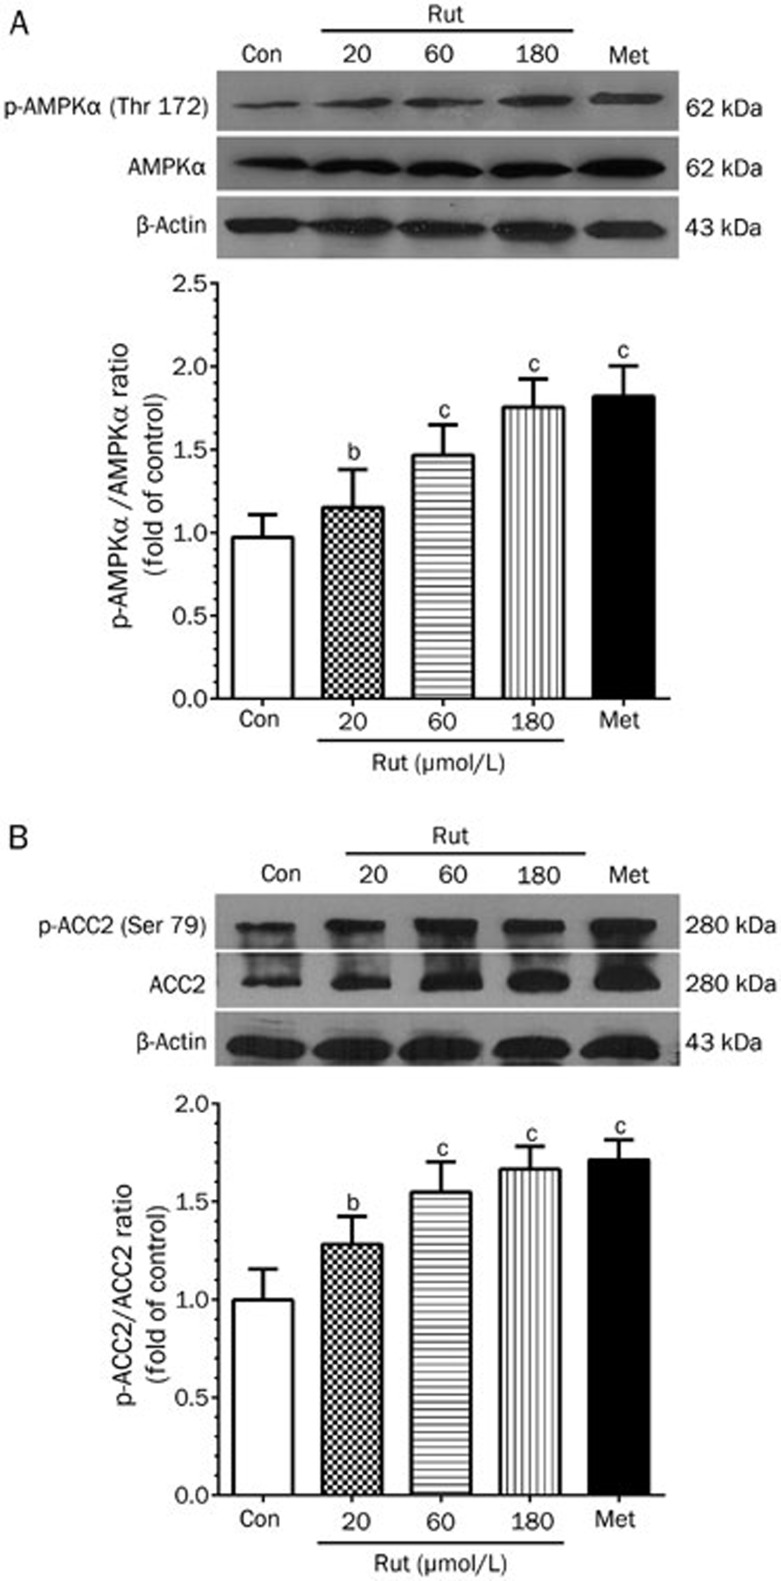
Because phosphorylated AMPK and ACC2 play important roles in lipid metabolism, we examined their protein levels in skeletal muscle cells. Rutaecarpine treatment induced AMPKα phosphorylation in a concentration-dependent manner (Figure 5A). Rutaecarpine also significantly increased ACC2 phosphorylation (Figure 5B). These data suggest that the AMPK-ACC2 pathway may be involved in the mechanism by which rutaecarpine affects obesity and type 2 diabetes.
Figure 5.
The changes of protein phosphorylation levels of AMPK (Thr 172) (A) and ACC2 (B) by 24 h treatment of metformin (20 μmol/L) and rutaecarpine (20, 60 and 180 μmol/L) in skeletal muscle cells. The intensity of the phosphor-signals was detected with Western blot and presented as mean grey scale of corresponding bands in bar graph. Values are expressed as mean±SD, n=6 in each group. bP<0.05, cP<0.01 compared to the Con group.
Effect of rutaecarpine on the IRS-1/PI3K/Akt pathway in rat livers
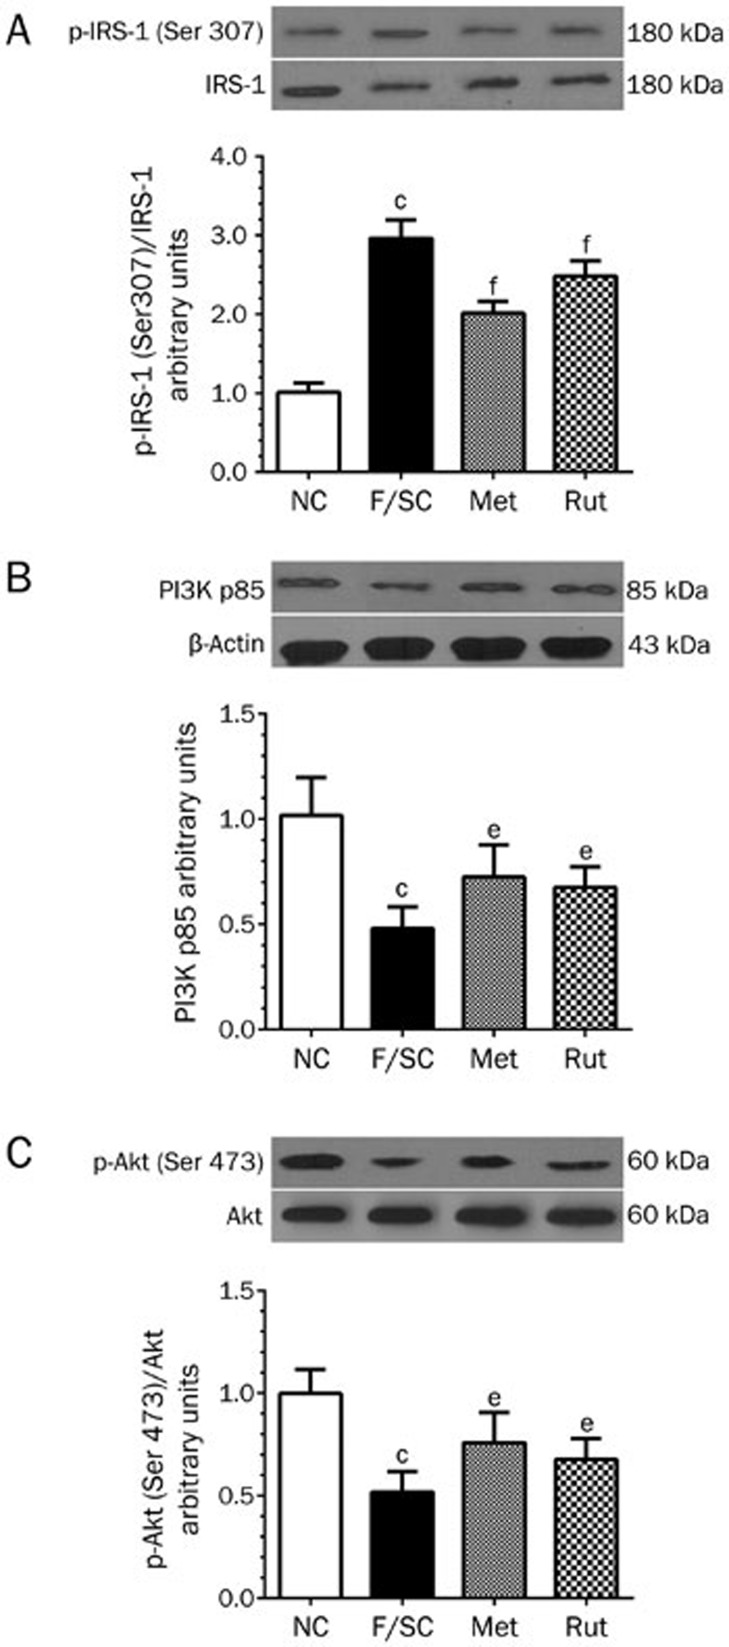
To understand the mechanism by which rutaecarpine induced insulin sensitivity, we examined the phosphorylation levels of IRS-1 (Ser 307) and Akt (Ser 473) as well as the protein expression level of p85-PI3K. As shown in Figure 6, livers from Fat-fed/STZ rats showed impaired insulin signaling cascades. Rutaecarpine treatment decreased IRS-1 phosphorylation (P<0.01, Figure 6A), enhanced PI3K p85 protein expression (P<0.05, Figure 6B), and elevated Akt serine 473 phosphorylation (P<0.05, Figure 6C).
Figure 6.
The effects of rutaecarpine on IRS-1-PI3K-Akt insulin receptor mediated pathway were analyzed by Western blot with liver tissues. The 7 weeks treatment of rutaecarpine (25 mg/kg) or metformin (250 mg/kg) inhibited IRS-1 phosphorylation (A); promoted expression of PI3K p85 (B); and enhanced phosphorylation of Akt (C). The protein expressions were expressed as mean grey scale of corresponding bands in bar graph. Values are mean±SD, n=6 in each group. bP<0.05, cP<0.01 vs NC; eP<0.05, fP<0.01 vs F/SC.
Effect of rutaecarpine on CRP, MCP-1, TNF-α, IL-6 and NF-κB in Fat-fed/STZ rats
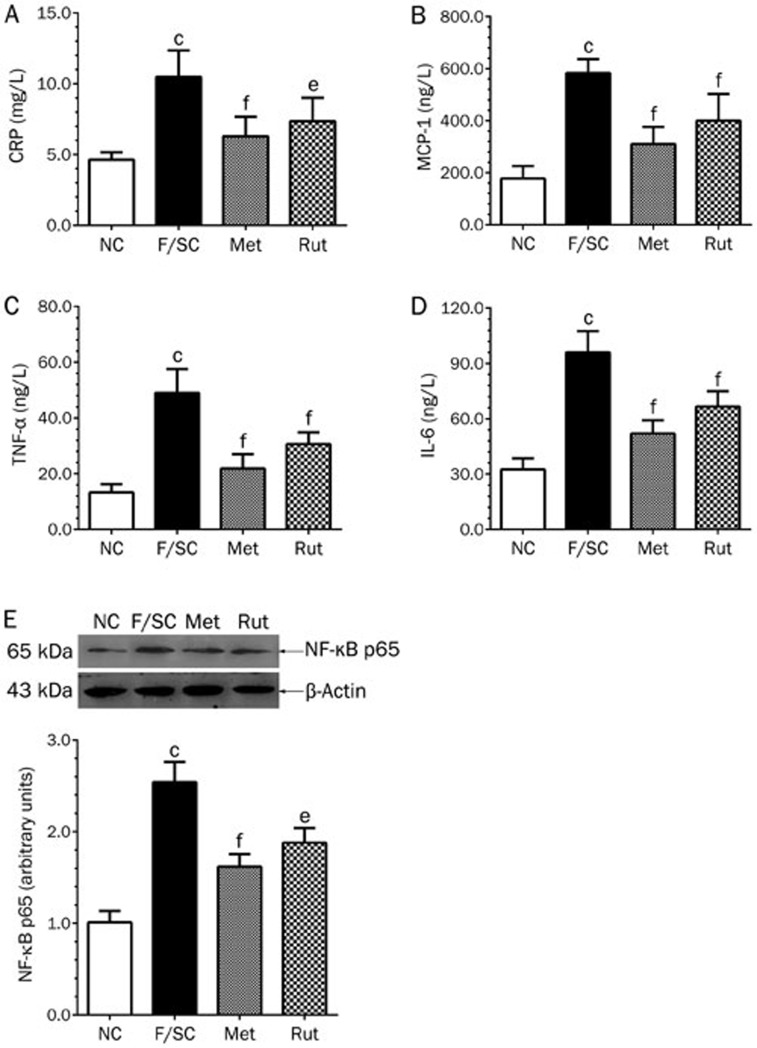
A high-fat diet plus STZ injection significantly increased CRP, MCP-1, TNF-α and IL-6 serum levels in F/SC rats (Figure 7A–7D), while rutaecarpine treatment reduced them (Figure 7A–7D).
Figure 7.
Effect of rutaecarpine on serum inflammatory cytokines CRP (A), MCP-1 (B), TNF-α (C), IL-6 (D) and liver NF-κB protein (E) of Fat-fed/STZ rats. Panels show representative bands and histograms represent optical density values normalized to the corresponding β-actin. Values are mean±SD, n=6 or 10 in each group. bP<0.05, cP<0.01 vs NC; eP<0.05, fP<0.01 vs F/SC.
NF-κB plays a central role in inflammation through its ability to induce the transcription of pro-inflammatory genes38. In this study, NF-κB p65 protein expression was significantly increased in the liver of high-fat diet/STZ rats. Rutaecarpine treatment attenuated NF-κB expression by 26.0% (P<0.05, Figure 7E).
Effect of rutaecarpine on pathological changes and function of the liver
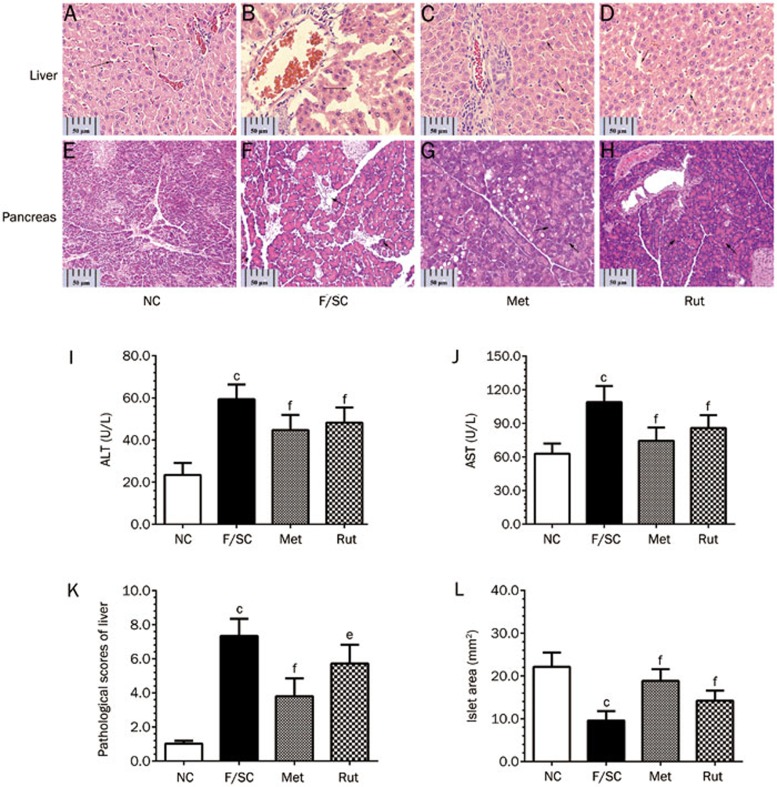
Steatosis is a major pathological change in the livers of Fat-fed/STZ rats39. As shown in Figure 8B, livers of Fat-fed/STZ rats showed hepatocellular degeneration, sinusoid dilation, and inflammatory cell infiltration, reflecting the signs of steatosis. Rutaecarpine treatment blocked this pathological course (Figure 8D) and improved the pathological score (Figure 8K).
Figure 8.
Pathological changes of liver, pancreas (H&E stain, magnification: ×400) and hepatic AST, ALT of Fat-fed/STZ rats. (A–D) The liver of F/SC group shows hepatocellular degeneration with dilated sinusoids, and infiltrated inflammatory cells. (E-H) Histopathology of pancreas of Fat-fed/STZ rats treated with rutaecarpine. Treatment of metformin (250 mg/kg) or rutaecarpine (25 mg/kg) prevented pathological changes and reversed pathological scores of liver (K). The elevated ALT (I), AST (J) and islet area of pancreas (L) in F/SC group were also significantly reduced by the treatments (scale bar=50 μm). Values are mean±SD, n=6 or 10 in each group. bP<0.05, cP<0.01 vs NC; eP<0.05, fP<0.01 vs F/SC.
In addition to hepatic histological evidence, we measured AST and ALT levels as a readout of hepatic function. AST and ALT levels were significantly increased (P<0.01, Figure 8I and 8J) in the F/SC group. Rutaecarpine treatment significantly decreased them.
The effect of rutaecarpine on pancreas pathology in Fat-fed/STZ rats
Figure 8E–8H shows pathological images after H&E staining of the rat pancreas. The tissue structures were clear in the normal group, as we could clearly observe multiple pancreatic cell mass, normal islet shape, islet cell boundaries, and various sizes of islets. Moreover, small and large islands were composed of approximately 10 and 100 cells, respectively. Nuclear chromatin was stained light purple, and the cytoplasm stained light red. The intercellular capillaries were clearly visible (Figure 8E). The Fat-fed/STZ group rats had pancreatic alveolar atrophy, interstitial fibrosis and fatty degeneration. In contrast to the NC group, the majority of the islets were smaller (22.14±1.054 mm2 vs 9.58±0.693 mm2, P<0.01, Figure 8L). The majority of the cells were not clear, and the cytoplasm was loose and showed signs of vacuole degeneration.
The pancreatic lesions in the metformin-treated group significantly improved, while the cytoplasm was significantly decreased. The nucleus became normal after metformin treatment (Figure 8G), and the islet area significantly increased (18.86±0.867 mm2 vs 9.58±0.693 mm2, P<0.01, Figure 8L).
The amount and area of islets in the rutaecarpine-treated group increased (14.23±0.740 mm2 vs 9.58±0.693 mm2, P<0.001). The number of the cells significantly decreased. Thus, rutaecarpine has a protective effect on the islets of Fat-fed/STZ rats by repairing pancreatic tissue injury.
Discussion
Hypertrophic obesity is a hallmark of a high-fat diet induced metabolism disorder40,41. To better describe the rutaecarpine-induced body fat change in our animal models, we measured the Lee obesity index. An increase in visceral/intra-abdominal fat stores is associated with an increased risk for IR42, and the International Diabetes Federation (IDF) particularly reduced cut-off values for visceral obesity to emphasize its impact on the prevalence of cardiovascular events43. Rutaecarpine treatment reduced the Lee obesity index (Figure 2K) and visceral fat (Figure 2L), suggesting that rutaecarpine plays a role in lipid metabolic activity. Consistently, rutaecarpine treatment significantly decreased TC (Figure 3E), TG (Figure 3F), and LDL-C (Figure 3G) in Fat-fed/STZ rat.
The association between abdominal fat accumulation and IR risk has long been proposed44,45. However, there is no clear proof of a causal link between obesity and blood glucose concentrations in our fat (38.9% lard fat containing chow)-fed rat model (Figure 4A). Chow (20% protein, 35% carbohydrate, 45% fat) containing 16% higher fat than our fat diet failed to elevate blood glucose in a Wistar rat model46. Buettner47 performed a 12-week high fat (42%) diet course with coconut fat (saturated fatty acids), olive oil (monounsaturated fatty acids), lard (comparable quantities of saturated fatty and monounsaturated fatty acids) and fish oil (polyunsaturated fatty acids) as fat sources. The blood glucose levels of experimental rats did not change in any of the high fat diet groups. However, a 58% lard fat diet (49% higher than our high-fat diet) induced hyperglycemia in female C57BL/6J mice accompanied by an increase in body weight48. Interestingly, a 32% safflower fat diet also induced increased plasma glucose levels in female C57BL/6J mice49. Thus, differences in species and genetic backgrounds may affect the correlation between body weight and glycemia under high-fat diets50. In addition, we only observed the white fat tissue but not brown fat tissue in our study. In the histological analysis of the F/SC group, the epididymis head was hidden by a large amount of fat, and we also observed a highly fatty deposit in the mesenterium (Figure 2C). Moreover, fat weight and fat coefficient visceral in the F/SC group was significantly higher than the control. Rutaecarpine treatment could significantly reverse these abnormal indices to different degrees (Figure 2E and 2I).
It is important to note that although a high-fat diet increased the body weight and blood glucose in Ins1+/+: Ins2−/− mice, insulin resistance was not observed51,52. In contrast, our experimental Fat-fed/STZ rats developed hyperglycemia (Figure 4A) and IR (Figure 4B). Rutaecarpine treatment effectively decreased blood glucose levels and improved insulin sensitivity by reversing the suppression of GIR in Fat-fed/STZ rats (Figure 4A and 4B). Furthermore, the herb element promoted skeletal muscle glucose uptake both under the influence of insulin or at resting level (Figure 4C and 4D). Therefore, rutaecarpine can improve glucose metabolism through an insulin-sensitizing effect or an insulin-independent pathway in the Fat-fed/STZ model. Together with the observations that rutaecarpine improves the Lee obesity index (Figure 2C)/visceral fat (Figure 2D) and restores normal lipid profiles (Figure 3E–3H), we provide evidence for potential clinic application of the herb element in metabolic syndrome patients.
AMPK plays a central role in controlling lipid metabolism by modulating downstream ACC. AMPK serine/threonine protein kinase is a heterotrimeric complex consisting of a catalytic subunit (α) and two regulatory subunits (β and γ)53. It has been reported that Thr-172 phosphorylation of the AMPKα subunit negatively regulates hepatic lipid content, and inhibition of AMPK may contribute to lipid accumulation induced by high concentrations of glucose associated with IR54. In the present study, we showed that rutaecarpine induced AMPKα phosphorylation at Thr-172 in a concentration-dependent manner (Figure 5A). Similarly, ACC phosphorylation at Ser-79 increased in the rutaecarpine-treated group (Figure 5B). ACC is a downstream effector of AMPK, and our study suggests that the AMPK-ACC pathway mediates the effect of rutaecarpine on lipid metabolism. It has been known that the inhibitory effects of metformin on fatty acid metabolism occur via preferential AMPK-α1 phosphorylation in rat muscle cells55. More recently, Boyle56 found that metformin activates AMPK and reduces ACC protein levels in human adipose tissue in vivo. Our data indicated that rutaecarpine and metformin potentially act on the same pathway to regulate lipid metabolism.
IR is characterized by defects in muscle glucose uptake and overproduction of both glucose and lipids in livers. PI3K pathway activation is essential to regulate insulin receptor substrates (IRS). Among all IRS, IRS-1 is the predominant isoform in skeletal muscle, and it is closely linked to glucose homeostasis in the liver57. Ser/Thr phosphorylation of IRS-1 serves as a new drug target to treat IR. Indeed, there were no changes in basal hepatic IRS-1 tyrosine phosphorylation levels in SD rats with hyperglycemia induced by a high-Fat diet58. In contrast, the phospho-serine307 IRS-1 level increased in the muscle of STZ-induced diabetic SD rats59. In the present study, we found that p-IRS-1Ser307 elevated (Figure 6A) in the liver of Fat-fed/STZ rats. Rutaecarpine effectively reversed the changes in p-IRS-1Ser307, PI3K p85, and p-Ser473AKT in Fat-fed/STZ rats (Figure 6A–6C), demonstrating a similar mechanism as the anti-diabetic drug rosiglitazone, which was unable to restore p-Ser473AKT levels60.
Metabolic syndrome is an inflammatory disorder disease61. Obesity, IR, T2DM and alterations in vasculature are all closely associated with chronic inflammation characterized by abnormal inflammatory cell infiltration, cytokine production and ROS/RNS elevation. It is clear that activation of the NF-κB transcriptional program contributes to the pathological development of obesity-induced insulin resistance62,63. Rutaecarpine treatment in Fat-fed/STZ rats significantly inhibited NF-κB p65 (Figure 7E), a key protein in the NF-κB cascade. Moreover, as CRP (Figure 7A), MCP-1 (Figure 7B), TNF-α (Figure 7C), and IL-6 (Figure 7D) are considered important members of inflammatory pathways64,65,66, their inhibition suggests that inflammatory pathways are involved in the underlying mechanism by which rutaecarpine regulates lipid and carbohydrate homeostasis. Rutaecarpine restored pancreatic islet areas impaired by HFD and STZ (Figure 8H and 8L). We found that HFD plus STZ impaired the pancreatic islet (Figure 8F and 8L); however, whether they were uniquely damaged by HFD is still unknown.
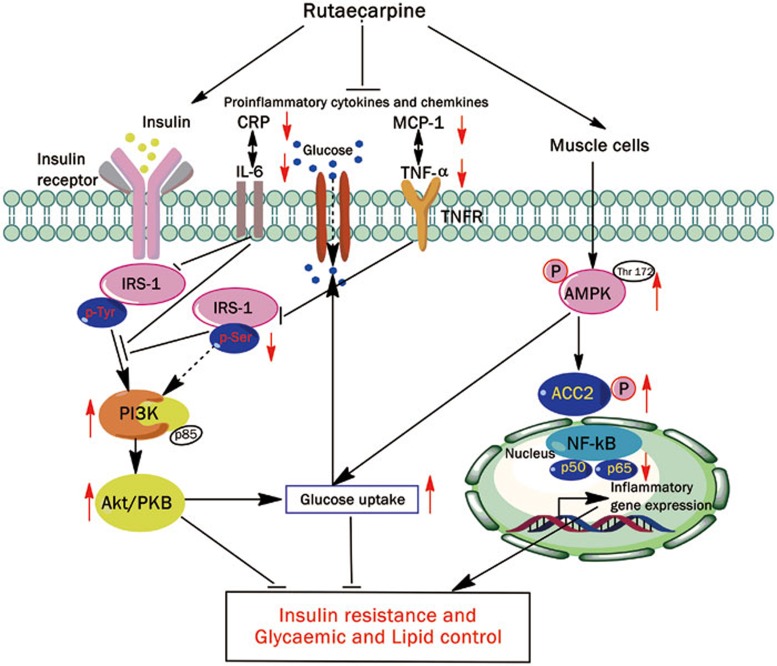
In summary, rutaecarpine inhibited hypolipidemia and hypoglycemia. AMPK/ACC2 and IRS-1/PI3K/Akt signaling pathways (Figure 9) are potentially involved in the underlying mechanism. Rutaecarpine also improved the inflammatory response, which can affect lipid and carbohydrate regulation. This study suggests that rutaecarpine is a potentially useful drug that could reduce serum lipid and glucose levels.
Figure 9.
Schematic action model of rutaecarpine which exert caloric restrict acting on cell metabolism at multiple levels and reduce energy-consuming processes in vivo and in vitro. Both AMPK-ACC2 and IRS-1-PI3K-Akt pathway participate regulatory pathway stimulated by rutaecarpine. The inhibitory effect on broad range of inflammatory cytokines may further suggest the multi-targets of rutaecarpine. The arrows indicate the potential targets of rutaecarpine. However, their role in the mechanism still need validation.
Abbreviations
2-D[3H]OG, 2-deoxy-D-[1,2-3H(N)]glucose; ACC2, acetyl-CoA carboxylase 2; AgRP, agouti-related protein; AHA, American Heart Association; ALT, alanine transaminase; AMPK, AMP-activated protein kinase; AST, aspartate transaminase; CRP, C reactive protein; ECL, enhanced chemiluminescence; GIR, glucose infusion rate; HEC, hyperinsulinemic euglycemic clamp; HFD, high-fat diet; HRP, horseradish peroxidase; IDF, International Diabetes Federation; IL-6, interleukin-6; IR, insulin resistance; IRS-1, insulin receptor substrate-1; KHB, Krebs-Henseleit bicarbonate; LDL-C, low density lipoprotein cholesterol; MCP-1, monocyte chemotactic protein; MetS, metabolic syndrome; NPY, neuropeptide Y; PBS, phosphate-buffered saline; PI3K, phosphatidylinositol 3-kinase; STZ, streptozotocin; T2DM, type 2 diabetes mellitus.
Author contribution
Xu-qiang NIE, Ferid MURAD, Yu-qi HE, and Ka BIAN designed the research; Xu-qiang NIE, Huai-hong CHEN, and Jian-yong ZHANG conducted experiments; Xu-qiang NIE, Jian-wen YANG, and Hui-jun PAN performed data analysis; Xu-qiang NIE, Wen-xia SONG, Ferid MURAD, Yu-qi HE, and Ka BIAN wrote the manuscript.
Acknowledgments
This work was supported by the project 08DZ1972104 of Shanghai Committee of Science & Technology, E-Institutes for Nitric Oxide and Inflammatory Medicine (E-04010), National Natural Science Foundation of China (81560712 and 81402985) and the Joint Fund Project of the Science and Technology Office of Guizhou Province, China (LH-2014-7566).
References
- Fu J, Prasad HC. Changing epidemiology of metabolic syndrome and type 2 diabetes in Chinese youth. Curr Diab Rep 2014; 14: 447. [DOI] [PubMed] [Google Scholar]
- Beagley J, Guariguata L, Weil C, Motala AA. Global estimates of undiagnosed diabetes in adults. Diabetes Res Clin Pract 2014; 103: 150–60. [DOI] [PubMed] [Google Scholar]
- Kuivenhoven JA, Groen AK. Beyond the genetics of HDL: why is HDL cholesterol inversely related to cardiovascular disease? Handb Exp Pharmacol 2015; 224: 285–300. [DOI] [PubMed] [Google Scholar]
- Via-Sosa MA, Toro C, Trave P, March MA. Screening premorbid metabolic syndrome in community pharmacies: a cross-sectional descriptive study. BMC Public Health 2014; 14: 487. [DOI] [PMC free article] [PubMed] [Google Scholar]
- Orme M, Fenici P, Lomon ID, Wygant G, Townsend R, Roudaut M. A systematic review and mixed-treatment comparison of dapagliflozin with existing anti-diabetes treatments for those with type 2 diabetes mellitus inadequately controlled by sulfonylurea monotherapy. Diabetol Metab Syndr 2014; 6: 73. [DOI] [PMC free article] [PubMed] [Google Scholar]
- American Diabetes Association. Standards of medical care in diabetes-2015 abridged for primary care providers. Clin Diabetes 2015; 33: 97–111. [DOI] [PMC free article] [PubMed] [Google Scholar]
- Jung HS, Lim Y, Kim EK. Therapeutic phytogenic compounds for obesity and diabetes. Int J Mol Sci 2014; 15: 21505–37. [DOI] [PMC free article] [PubMed] [Google Scholar]
- Distefano JK, Watanabe RM. Pharmacogenetics of anti-diabetes drugs. Pharmaceuticals (Basel) 2010; 3: 2610–46. [DOI] [PMC free article] [PubMed] [Google Scholar]
- WHO Expert Committee on the Selection and Use of Essential Medicines (2011: Geneva Switzerland), World Health Organization. WHO model list of essential medicines : 17th list, March 2011 Geneva. World Health Organization; 2011.
- Hazel-Fernandez L, Xu Y, Moretz C, Meah Y, Baltz J, Lian J, et al. Historical cohort analysis of treatment patterns for patients with type 2 diabetes initiating metformin monotherapy. Curr Med Res Opin 2015; 31: 1703–16. [DOI] [PubMed] [Google Scholar]
- Kinaan M, Ding H, Triggle CR. Metformin: An old drug for the treatment of diabetes but a new drug for the protection of the endothelium. Med Princ Pract 2015; 24: 401–15. [DOI] [PMC free article] [PubMed] [Google Scholar]
- Aguirre V, Werner ED, Giraud J, Lee YH, Shoelson SE, White MF. Phosphorylation of Ser307 in insulin receptor substrate-1 blocks interactions with the insulin receptor and inhibits insulin action. J Biol Chem 2002; 277: 1531–7. [DOI] [PubMed] [Google Scholar]
- Yamauchi T, Kaburagi Y, Ueki K, Tsuji Y, Stark GR, Kerr IM, et al. Growth hormone and prolactin stimulate tyrosine phosphorylation of insulin receptor substrate-1, -2, and -3, their association with p85 phosphatidylinositol 3-kinase (PI3-kinase), and concomitantly PI3-kinase activation via JAK2 kinase. J Biol Chem 1998; 273: 15719–26. [DOI] [PubMed] [Google Scholar]
- Steinberg GR, Kemp BE. AMPK in health and disease. Physiol Rev 2009; 89: 1025–78. [DOI] [PubMed] [Google Scholar]
- Hegarty BD, Turner N, Cooney GJ, Kraegen EW. Insulin resistance and fuel homeostasis: the role of AMP-activated protein kinase. Acta Physiol (Oxf) 2009; 196: 129–45. [DOI] [PubMed] [Google Scholar]
- Abu-Elheiga L, Oh W, Kordari P, Wakil SJ. Acetyl-CoA carboxylase 2 mutant mice are protected against obesity and diabetes induced by high-fat/high-carbohydrate diets. Proc Natl Acad Sci U S A 2003; 100: 10207–12. [DOI] [PMC free article] [PubMed] [Google Scholar]
- Pharmacopoeia of the People's Republic of China. 1st ed. Beijing, China China Medical Science and Technology Press; 2010.
- Kobayashi Y, Hoshikuma K, Nakano Y, Yokoo Y, Kamiya T. The positive inotropic and chronotropic effects of evodiamine and rutaecarpine, indoloquinazoline alkaloids isolated from the fruits of Evodia rutaecarpa, on the guinea-pig isolated right atria: possible involvement of vanilloid receptors. Planta Med 2001; 67: 244–8. [DOI] [PubMed] [Google Scholar]
- Moon TC, Murakami M, Kudo I, Son KH, Kim HP, Kang SS, et al. A new class of COX-2 inhibitor, rutaecarpine from Evodia rutaecarpa. Inflamm Res 1999; 48: 621–5. [DOI] [PubMed] [Google Scholar]
- Chiou WF, Chou CJ, Liao JF, Sham AY, Chen CF. The mechanism of the vasodilator effect of rutaecarpine, an alkaloid isolated from Evodia rutaecarpa. Eur J Pharmacol 1994; 257: 59–66. [DOI] [PubMed] [Google Scholar]
- Chen YC, Zeng XY, He Y, Liu H, Wang B, Zhou H, et al. Rutaecarpine analogues reduce lipid accumulation in adipocytes via inhibiting adipogenesis/lipogenesis with AMPK activation and UPR suppression. ACS Chem Biol 2013; 8: 2301–11. [DOI] [PubMed] [Google Scholar]
- Yang JW, Nie XQ, Shi HX, Zhang YJ, Zhang JY, Yuan Y, et al. Effects of rutaecarpine on inflammatory cytokines in insulin resistant primary skeletal muscle cells. Zhongguo Zhong Yao Za Zhi 2014; 39: 2930–5. [PubMed] [Google Scholar]
- Shi X, Lu XG, Zhan LB, Qi X, Liang LN, Hu SY, et al. The effects of the Chinese medicine ZiBu PiYin recipe on the hippocampus in a rat model of diabetes-associated cognitive decline: a proteomic analysis. Diabetologia 2011; 54: 1888–99. [DOI] [PubMed] [Google Scholar]
- Kusakabe T, Tanioka H, Ebihara K, Hirata M, Miyamoto L, Miyanaga F, et al. Beneficial effects of leptin on glycaemic and lipid control in a mouse model of type 2 diabetes with increased adiposity induced by streptozotocin and a high-fat diet. Diabetologia 2009; 52: 675–83. [DOI] [PubMed] [Google Scholar]
- Bernardis LL, Patterson BD. Correlation between 'Lee index' and carcass fat content in weanling and adult female rats with hypothalamic lesions. J Endocrinol 1968; 40: 527–8. [DOI] [PubMed] [Google Scholar]
- Qi MY, Kai C, Liu HR, Su YH, Yu SQ. Protective effect of Icariin on the early stage of experimental diabetic nephropathy induced by streptozotocin via modulating transforming growth factor beta1 and type IV collagen expression in rats. J Ethnopharmacol 2011; 138: 731–6. [DOI] [PubMed] [Google Scholar]
- Dedik L, Chrenova J, Rausova Z, Mingrone G, Penesova A. Clearance approach in hyperinsulinemic-euglycemic clamp evaluation in lean and obese subjects. Endocr Res 2015; 40: 156–9. [DOI] [PubMed] [Google Scholar]
- Kim JK. Hyperinsulinemic-euglycemic clamp to assess insulin sensitivity in vivo. Methods Mol Biol 2009; 560: 221–38. [DOI] [PubMed] [Google Scholar]
- Hsieh PS. Inflammatory change of fatty liver induced by intraportal low-dose lipopolysaccharide infusion deteriorates pancreatic insulin secretion in fructose-induced insulin-resistant rats. Liver Int 2008; 28: 1167–75. [DOI] [PubMed] [Google Scholar]
- Ozden H, Tekin N, Akyuz F, Gurer F, Ustuner MC, Kucuk F, et al. The protective effect of NG-nitro-L-arginine methyl ester and insulin on nitric oxide inhibition and pathology in experimental diabetic rat liver. Saudi Med J 2009; 30: 30–4. [PubMed] [Google Scholar]
- Hu Z, Wang H, Lee IH, Modi S, Wang X, Du J, et al. PTEN inhibition improves muscle regeneration in mice fed a high-fat diet. Diabetes 2010; 59: 1312–20. [DOI] [PMC free article] [PubMed] [Google Scholar]
- Braiman L, Sheffi-Friedman L, Bak A, Tennenbaum T, Sampson SR. Tyrosine phosphorylation of specific protein kinase C isoenzymes participates in insulin stimulation of glucose transport in primary cultures of rat skeletal muscle. Diabetes 1999; 48: 1922–9. [DOI] [PubMed] [Google Scholar]
- Romagnoli M, Gomez-Cabrera MC, Perrelli MG, Biasi F, Pallardo FV, Sastre J, et al. Xanthine oxidase-induced oxidative stress causes activation of NF-kappaB and inflammation in the liver of type I diabetic rats. Free Radic Biol Med 2010; 49: 171–7. [DOI] [PubMed] [Google Scholar]
- Montague CT, O'Rahilly S. The perils of portliness: causes and consequences of visceral adiposity. Diabetes 2000; 49: 883–8. [DOI] [PubMed] [Google Scholar]
- Kern PA, Ranganathan S, Li C, Wood L, Ranganathan G. Adipose tissue tumor necrosis factor and interleukin-6 expression in human obesity and insulin resistance. Am J Physiol Endocrinol Metab 2001; 280: E745–51. [DOI] [PubMed] [Google Scholar]
- Marette A. Molecular mechanisms of inflammation in obesity-linked insulin resistance. Int J Obes Relat Metab Disord 2003; 27: S46–8. [DOI] [PubMed] [Google Scholar]
- Nie XQ, Yu LH, Chen HH, Zhao TF, Bian K. Intervention effects of rutaecarpine in type 2 diabetic obese rats. Chin Pharmacol Bull 2010; 26: 872–6. [Google Scholar]
- Barnes PJ, Karin M. Nuclear factor-kappaB: a pivotal transcription factor in chronic inflammatory diseases. N Engl J Med 1997; 336: 1066–71. [DOI] [PubMed] [Google Scholar]
- Sahin K, Onderci M, Tuzcu M, Ustundag B, Cikim G, Ozercan IH, et al. Effect of chromium on carbohydrate and lipid metabolism in a rat model of type 2 diabetes mellitus: the fat-fed, streptozotocin-treated rat. Metabolism 2007; 56: 1233–40. [DOI] [PubMed] [Google Scholar]
- Kim SP, Ellmerer M, Van Citters GW, Bergman RN. Primacy of hepatic insulin resistance in the development of the metabolic syndrome induced by an isocaloric moderate-fat diet in the dog. Diabetes 2003; 52: 2453–60. [DOI] [PubMed] [Google Scholar]
- Kraegen EW, Clark PW, Jenkins AB, Daley EA, Chisholm DJ, Storlien LH. Development of muscle insulin resistance after liver insulin resistance in high-fat-fed rats. Diabetes 1991; 40: 1397–403. [DOI] [PubMed] [Google Scholar]
- Yki-Jarvinen H. Ectopic fat accumulation: an important cause of insulin resistance in humans. J R Soc Med 2002; 95: 39–45. [PMC free article] [PubMed] [Google Scholar]
- Mancia G, Bombelli M, Facchetti R, Casati A, Ronchi I, Quarti-Trevano F, et al. Impact of different definitions of the metabolic syndrome on the prevalence of organ damage, cardiometabolic risk and cardiovascular events. J Hypertens 2010; 28: 999–1006. [DOI] [PubMed] [Google Scholar]
- Frayn KN. Visceral fat and insulin resistance causative or correlative? Br J Nutr 2000; 83: S71–7. [DOI] [PubMed] [Google Scholar]
- Yamashita S, Nakamura T, Shimomura I, Nishida M, Yoshida S, Kotani K, et al. Insulin resistance and body fat distribution. Diabetes Care 1996; 19: 287–91. [DOI] [PubMed] [Google Scholar]
- Conde SV, Nunes da Silva T, Gonzalez C, Mota Carmo M, Monteiro EC, Guarino MP. Chronic caffeine intake decreases circulating catecholamines and prevents diet-induced insulin resistance and hypertension in rats. Br J Nutr 2012; 107: 86–95. [DOI] [PubMed] [Google Scholar]
- Buettner R, Parhofer KG, Woenckhaus M, Wrede CE, Kunz-Schughart LA, Scholmerich J, et al. Defining high-fat-diet rat models: metabolic and molecular effects of different fat types. J Mol Endocrinol 2006; 36: 485–501. [DOI] [PubMed] [Google Scholar]
- Winzell MS, Ahren B. The high-fat diet-fed mouse: a model for studying mechanisms and treatment of impaired glucose tolerance and type 2 diabetes. Diabetes 2004; 53: S215–9. [DOI] [PubMed] [Google Scholar]
- Ikemoto S, Thompson KS, Takahashi M, Itakura H, Lane MD, Ezaki O. High fat diet-induced hyperglycemia: prevention by low level expression of a glucose transporter (GLUT4) minigene in transgenic mice. Proc Natl Acad Sci U S A 1995; 92: 3096–9. [DOI] [PMC free article] [PubMed] [Google Scholar]
- Do R, Bailey SD, Desbiens K, Belisle A, Montpetit A, Bouchard C, et al. Genetic variants of FTO influence adiposity, insulin sensitivity, leptin levels, and resting metabolic rate in the Quebec Family Study. Diabetes 2008; 57: 1147–50. [DOI] [PubMed] [Google Scholar]
- Mehran AE, Templeman NM, Brigidi GS, Lim GE, Chu KY, Hu X, et al. Hyperinsulinemia drives diet-induced obesity independently of brain insulin production. Cell Metab 2012; 16: 723–37. [DOI] [PubMed] [Google Scholar]
- Buettner C. Is hyperinsulinemia required to develop overeating-induced obesity? Cell Metab 2012; 16: 691–2. [DOI] [PMC free article] [PubMed] [Google Scholar]
- Hardie DG, Scott JW, Pan DA, Hudson ER. Management of cellular energy by the AMP-activated protein kinase system. FEBS Lett 2003; 546: 113–20. [DOI] [PubMed] [Google Scholar]
- Zang M, Zuccollo A, Hou X, Nagata D, Walsh K, Herscovitz H, et al. AMP-activated protein kinase is required for the lipid-lowering effect of metformin in insulin-resistant human HepG2 cells. J Biol Chem 2004; 279: 47898–905. [DOI] [PubMed] [Google Scholar]
- Bogachus LD, Turcotte LP. Genetic downregulation of AMPK-alpha isoforms uncovers the mechanism by which metformin decreases FA uptake and oxidation in skeletal muscle cells. Am J Physiol Cell Physiol 2010; 299: C1549–61. [DOI] [PubMed] [Google Scholar]
- Boyle JG, Logan PJ, Jones GC, Small M, Sattar N, Connell JM, et al. AMP-activated protein kinase is activated in adipose tissue of individuals with type 2 diabetes treated with metformin: a randomised glycaemia-controlled crossover study. Diabetologia 2011; 54: 1799–809. [DOI] [PubMed] [Google Scholar]
- Taniguchi CM, Ueki K, Kahn R. Complementary roles of IRS-1 and IRS-2 in the hepatic regulation of metabolism. J Clin Invest 2005; 115: 718–27. [DOI] [PMC free article] [PubMed] [Google Scholar] [Retracted]
- Anai M, Funaki M, Ogihara T, Kanda A, Onishi Y, Sakoda H, et al. Enhanced insulin-stimulated activation of phosphatidylinositol 3-kinase in the liver of high-fat-fed rats. Diabetes 1999; 48: 158–69. [DOI] [PubMed] [Google Scholar]
- Lee SW, Dai G, Hu Z, Wang X, Du J, Mitch WE. Regulation of muscle protein degradation: coordinated control of apoptotic and ubiquitin-proteasome systems by phosphatidylinositol 3 kinase. J Am Soc Nephrol 2004; 15: 1537–45. [DOI] [PubMed] [Google Scholar]
- Standaert ML, Sajan MP, Miura A, Kanoh Y, Chen HC, Farese RV Jr, et al. Insulin-induced activation of atypical protein kinase C, but not protein kinase B, is maintained in diabetic (ob/ob and Goto-Kakazaki) liver. Contrasting insulin signaling patterns in liver versus muscle define phenotypes of type 2 diabetic and high fat-induced insulin-resistant states. J Biol Chem 2004; 279: 24929–34. [DOI] [PubMed] [Google Scholar]
- Crunkhorn S. Metabolic disorders: Breaking the links between inflammation and diabetes. Nat Rev Drug Discov 2013; 12: 261. [DOI] [PubMed] [Google Scholar]
- Wunderlich FT, Luedde T, Singer S, Schmidt-Supprian M, Baumgartl J, Schirmacher P, et al. Hepatic NF-kappa B essential modulator deficiency prevents obesity-induced insulin resistance but synergizes with high-fat feeding in tumorigenesis. Proc Natl Acad Sci U S A 2008; 105: 1297–302. [DOI] [PMC free article] [PubMed] [Google Scholar]
- Arkan MC, Hevener AL, Greten FR, Maeda S, Li ZW, Long JM, et al. IKK-beta links inflammation to obesity-induced insulin resistance. Nat Med 2005; 11: 191–8. [DOI] [PubMed] [Google Scholar]
- Suzuki T, Voeks J, Zakai NA, Jenny NS, Brown TM, Safford MM, et al. Metabolic syndrome, C-reactive protein, and mortality in US. Blacks and Whites: the Reasons for Geographic and Racial Differences in Stroke (REGARDS) study. Diabetes Care 2014; 37: 2284–90. [DOI] [PMC free article] [PubMed] [Google Scholar]
- Uysal KT, Wiesbrock SM, Marino MW, Hotamisligil GS. Protection from obesity-induced insulin resistance in mice lacking TNF-alpha function. Nature 1997; 389: 610–4. [DOI] [PubMed] [Google Scholar]
- McNelis JC, Olefsky JM. Macrophages, immunity, and metabolic disease. Immunity 2014; 41: 36–48. [DOI] [PubMed] [Google Scholar]


