

Abstract
Due to climate change, many lakes in Europe will be subject to higher variability of hydrological characteristics in their littoral zones. These different hydrological regimes might affect the use of allochthonous and autochthonous carbon sources. We used sandy sediment microcosms to examine the effects of different hydrological regimes (wet, desiccating, and wet-desiccation cycles) on carbon turnover. 13C-labelled particulate organic carbon was used to trace and estimate carbon uptake into bacterial biomass (via phospholipid fatty acids) and respiration. Microbial community changes were monitored by combining DNA- and RNA-based real-time PCR quantification and terminal restriction fragment length polymorphism (T-RFLP) analysis of 16S rRNA. The shifting hydrological regimes in the sediment primarily caused two linked microbial effects: changes in the use of available organic carbon and community composition changes. Drying sediments yielded the highest CO2 emission rates, whereas hydrological shifts increased the uptake of allochthonous organic carbon for respiration. T-RFLP patterns demonstrated that only the most extreme hydrological changes induced a significant shift in the active and total bacterial communities. As current scenarios of climate change predict an increase of drought events, frequent variations of the hydrological regimes of many lake littoral zones in central Europe are anticipated. Based on the results of our study, this phenomenon may increase the intensity and amplitude in rates of allochthonous organic carbon uptake and CO2 emissions.
Keywords: carbon dioxide emission, phospholipid fatty acids, keeling plot, stable isotope, water level changes
Climate changes can induce higher intensities of drying and rewetting of lake littoral zones, which in turn might result in higher allochthonous organic carbon uptake and decreased carbon storage.
INTRODUCTION
Climate change will lead to a more extreme climate with exceptionally hot and dry summers and mild winters. In temperate zones, short-duration extreme events, such as windstorms and heavy rains, will occur more often (IPCC 2014). Additionally, hydrological climate change models predict an increase in the extent of semi-aquatic habitats in Central Europe (Krysanova and Arnold 2008). Thus, many lakes in Europe will be subjected to greater variability of hydrological and physicochemical characteristics, which can strongly affect sediment microbial composition and functioning and may change biogeochemical cycles and energy fluxes. The littoral zone in lake ecosystems will be especially affected by an increase in water level variability and will also experience longer and more frequent desiccation periods (Zohary and Ostrovsky 2011; Evtimova and Donohue 2014). In this context, the response of inland waters to hydrological changes is of great importance, considering their large potential to store and release carbon (Cole et al. 2007; Tranvik et al. 2009; Aufdenkampe et al. 2011).
Littoral zones are strongly linked to their terrestrial surroundings and receive the majority of terrestrial allochthonous inputs to lake ecosystems. Allochthonous organic carbon (OC) entering the littoral zone is mineralized and subsequently released as greenhouse gases (GHG) to the atmosphere, assimilated by microbes, buried in the sediment, or transferred to other ecosystems (den Heyer and Kalff 1998). Steep biogeochemical gradients develop within the interface between the terrestrial and aquatic domains, creating a diverse habitat for sediment microorganisms and rendering the littoral zones of lakes potential hotspots of biogeochemical cycling and organic matter turnover. In soils and terrestrial-aquatic interfaces, the water regime has significant control over microbial C-transformation, and during episodic hydrological flow events the intensification of biogeochemical processes can occur (McClain et al. 2003; Gerull et al. 2011). Thus, rewetting and desiccation of sediments can have substantial effects on microbial physiology, which has important consequences for OC transformation.
Climate change induces an increase in evaporation and precipitation in lake hydrology and strongly determines water level fluctuations in inland waters. Greater precipitation leads to a rise in water levels, whereas rising temperatures reduce water levels through evapotranspiration. Therefore, the littoral zone will shift more frequently between submerging and desiccating stages, and such fluctuations may affect the carbon turnover and microbial community composition and biomass. Changing water levels are known to affect ecosystem GHG release to the atmosphere because the duration of oxic and anoxic conditions in the sediment are altered, but gas flux could be an indicator for changes in the microbial community as well (Billings et al. 1982; Moore and Knowles 1989). Earlier studies have observed enhanced CO2 emissions to the atmosphere with falling water levels due to the four orders of magnitude higher diffusion rate in air than in water (Blodau 2004). In addition, desiccation can also have a substantial effect on microbial community diversity and biomass, which has consequences for C turnover and fluxes within the ecosystem, in addition to direct and immediate effects on microbial physiology (Schimel 2007).
Periodic desiccation and rewetting in semi-aquatic systems lead to a cascade of responses, resulting in the mobilization and metabolism of otherwise unavailable OC in the substrate (Kusel, Sly and Holt 2008; Reiche et al. 2009). Only a few studies exist in the literature that address the effects of desiccation and rewetting on aquatic microbial ecosystems including studies on streams (Marxsen, Zoppini and Wilczek 2010) and on lake sediments (Fromin et al. 2010). For instance, in investigations of Mediterranean ecosystems, the observed responses concerned primarily changes in community structure and/or microbial activity and physiology. Investigations of the impact of drying and rewetting on the C dynamics of allochthonous and autochthonous OC in combination with the impact on microbial communities are rare. Studies of microbial community and C-dynamics together are needed to address this gap in knowledge.
In our microcosm experiment, we combined DNA- and RNA-based real-time PCR quantification of several microbial groups with terminal restriction fragment length polymorphism (T-RFLP) analysis of the bacterial community, which provides information regarding the quantitative changes and reveals structural differences in the total and metabolically active microbial community. Additionally, lipid biomarker-based techniques (phospholipid-derived fatty acids; PLFA) together with stable isotope approaches can provide insight into the physiologically active microbial biomass, the community structure and the incorporated carbon source (Steger et al. 2015). We added 13C-labelled particulate organic carbon (POC, beech leaves) of allochthonous origin to our microcosms and assessed the stable isotope content of individual PLFAs to trace and quantitatively estimate the carbon uptake into different bacterial and fungal fatty acids. In addition, we biogeochemically assessed CO2 emissions and the incorporation of 13C into respired CO2 over time.
The objective of this study was to investigate how hydrological changes would affect the sandy sediment microbial community and the related carbon biogeochemistry, including the C turnover of sediment bound C. For this purpose, microbial community changes and the fate of OC were analysed in laboratory microcosms subjected to three different treatments: a permanently wet system (denoted as WET), a sediment system shifted from the wet phase into a desiccating phase (DRY), and a system that was exposed to dry and wet cycles (REWET). We obtained detailed insights into the microbial community dynamics and microbial C assimilation and tracked the flow of allochthonous-derived C through the microbial community and into respired CO2 over 77 days. We specifically addressed whether (i) mineralization of allochthonous OC is higher during desiccation than in constantly submerged sandy sediments, (ii) desiccation and rewetting cycles cause mobilization of otherwise unavailable OC (e.g. cell breakdown) and lead to a higher usage of allochthonous OC in these systems, and (iii) desiccation and rewetting cycles lead to an individual microbial community that is distinct from that in the desiccated and continuously submerged systems.
MATERIALS AND METHODS
Sediment sampling
Sediments were collected in August 2011 at Großer Kelpinsee, a mesotrophic lake with negligible anthropogenic influence, surrounded by forest vegetation and located in Brandenburg, Germany (53°03′23.1″N 13°44′45.4″E). The sampling was performed in the littoral zone, containing mostly sandy sediments (C content: 0.53% DW). The upper 0–3 cm of sediment was sliced using a core sampler (Uwitech, Austria, inner diameter: 60 mm; tube length: 60 cm), stored in a cooled plastic box, and carried to the laboratory together with 20 l of lake water. The samples were stored in a fridge overnight. The following day, larger particles were removed from the sediment with a 2 mm mesh-size sieve, and the lake water was filtered using a 40-μm filter (Whatmann). The processed sediment slurries were acclimatized at 16°C for 7 days in the dark.
Experimental set-up
Following acclimatization, the sediment was thoroughly mixed and equally distributed into 15 cylinders (PVC, 32 cm height, 9 cm i.d.), hereafter called microcosms, resulting in a 10 cm layer of sediment within the microcosm that was subsequently filled with 12 cm of filtered lake water. A headspace of 10 cm remained above the water. Each cylinder had 120 2-mm diameter holes in the lower 8 cm section to enable water flow through the sediment layer. Mesh (55 μm) was wrapped around each cylinder to retain sediment particles within the cylinder. Each of the 15 cylinders was covered with a second gas-tight outer cylinder (50 cm height, 11 cm i.d., Supplementary Fig. S1).
To simulate the input of allochthonous carbon, 300 mg of beech leaves (dry weight) was added to each cylinder at the beginning of the experiment in the form of approximately 38 1-cm diameter leaf discs. The discs were stamped out of a dry leaf, avoiding the major veins. To track the fate of the carbon in the system, the leaves had a distinct δ13C signature of 1200‰ (chemical and biochemical properties of the plant residues: biochemical fractions of soluble (28.1%), hemicellulose (11.1%), cellulose (32.3%) and lignin-like (28.5%)). The water column above the sediment was continuously oxygenated using aquarium pumps (through a cellulose acetate membrane, 0.2 μm) to avoid anoxia during incubation.
Two days after the addition of the leaves, the 15 microcosm cylinders were exposed to varying hydrological regimes in three different treatments (each with five replicates): (i) ‘wet system’ (WET): the sediments remained in their original submerged state; (ii) ‘dry system’ (DRY): sediment was completely removed from the water to simulate desiccation similar to that during longer drought periods, and (iii) ‘rewet system’ (REWET): the sediment was repeatedly removed from the water and then submerged to reflect the initial state again. With this treatment, we simulated repeated cycles of rising and sinking water tables resembling the shoreline of a water body exposed to successive and frequent drought and precipitation events.
The periodic water table changes within the cylinders in the REWET system were achieved by moving the cylinders in and out of a water reservoir that retained the drained water during cycling. The cylinders were attached to a rod via a string, and an electric motor rotated this rod, yielding height changes of the cylinders and shifting the sediment layer between a submerged (wet) phase and a desiccated (dry) phase. The cycling of REWET featured 24 h of lifting, followed by 3 days in a desiccating phase out of the water (referred to as REWET-dry), 24 h of lowering the cylinder slowly back into the water (lifting rate 2.5 × 10⁻⁶ m s−1), and one subsequent day when the cylinder remained submerged (referred to as REWET-wet). Altogether, one cycle took 6 days, resulting in a total of 13 cycles during the experiment. The experiment was conducted for 77 days in the dark with a constant temperature of 16°C.
Sampling procedure of the cylinders
We sampled sediment on the following days: 0, 29, 31, 74 and 77. More precise information for each analysis will be explained in detail below. The first sampling on day 0 (T0) reflected the initial status of all cylinders before the treatments commenced and prior to the addition of the labelled leaf litter. Subsequent sampling was conducted according to the current state of the REWET cycling, i.e. one sampling in the dry stage and the next in the wet stage. On each sampling day, a sterile section of pipette was inserted into the sediment of each cylinder to extract a single sample of the entire sediment depth (0–10 cm). This enabled us to sample the whole depth of the sediment core. Afterwards, the slurry got suspended with the pore water. This resulted in approximately 10 ml of sediment, which was extracted from each cylinder and divided for subsequent analyses in the following way: 2 ml for stable isotope analysis of the bulk sediments, 1 ml each for the bacterial cell number, biomass, and DNA-/RNA-based analyses, and 5 ml for phospholipid fatty acid (PLFA) analysis. The samples used for DNA and RNA co-extraction were placed in a 2 ml tube containing 0.5 g of 1 mm zirconia–silica beads (Biospec Products, USA) and were immediately centrifuged (30 s, 4°C, 14 000 × g) to remove excess water. The tubes were stored at −80°C until further processing. The sediment subsamples for bacterial cell number and biomass analysis were preserved by adding 4 ml of 4% formaldehyde and stored at 4°C. The samples for PLFA analysis were freeze dried and stored at −20°C until analysis.
Physicochemical properties of the sediment
We measured the soluble reactive phosphorous (SRP), total phosphorous (TP) and total carbon contents according to the sampling scheme described above (Table 1) at the start and the end of the incubation (Supplementary Table S1). Sampling during incubation was not possible since the amount for analysing was too high and would have destroyed the sediment structure. Before further analysis, the samples were dried to adjust the results to the dry weight of sediment. For TP and SRP, three subsamples were measured independently following standard chemical procedures (Parsons and Strickland 1963; Grasshoff, Emrhardt and Kremling 1983; Wetzel and Likens 1991).
Table 1.
Overview of the measured biotic and abiotic factors. Values are given for the end of the experiment only. Samples of DRY, WET and REWET were taken at d77 (REWET-wet). REWET-dry samples were taken at d74. Values are presented with standard deviations except for DNA and RNA values where standard errors are used.
| Results for Tfinal | Statistics differences among groups | Significant post hoc | ||
|---|---|---|---|---|
| TOC (%) | DRY | 0.51 (0.03) | F(2,12) = 4.548; P = 0.034 | REWET/WET (P = 0.029) |
| REWET | 0.48 (0.06) | |||
| WET | 0.59 (0.08) | |||
| SRP (mg l−1) | DRY | All values were around the detection limit (<0.003 mg l–1) | ||
| REWET | ||||
| WET | ||||
| TP (mg l−1) | DRY | 0.017 (0.009) | F(2,12) = 7.824, P = 0.02 | REWET/DRY (P = 0.49) |
| REWET | 0.062 (0.045) | REWET/WET (P = 0.28) | ||
| WET | 0.11 (0.007) | |||
| CO2 emissions (mmol l−1 h-1) | DRY | 0.505 (0.181) | F(3,30) = 25.769; P = 0.001 | REWET-dry/DRY (P = 0.002) |
| REWET-dry | 0.322 (0.019) | REWET-dry/WET (P = 0.000) | ||
| REWET-wet | 0.034 (0.012) | REWET-wet/WET (P = 0.025) | ||
| WET | 0.146 (0.058) | DRY/WET (P = 0.011 | ||
| CO2 SIA (‰) | DRY | 180.7 (28.0) | F(3,27) = 21.510; P = 0.001 | REWET-dry/DRY (P = 0.002) |
| REWET-dry | 331.3 (80.6) | REWET-dry/WET (P = 0.000) | ||
| REWET-wet | 340 (113.3) | REWET-wet/WET (P = 0.025) | ||
| WET | 101.1 (45.49) | DRY/WET (P = 0.011) | ||
| Cell count (cells g−1 DW) | DRY | 0.98 × 10⁹ (0.49 × 10⁹) | χ2 = 11.352, df = 2; P = 0.003 | DRY/WET (P < 0.05) |
| REWET | 0.698 × 10⁹ (0.18 × 10⁹) | |||
| WET | 0.44 × 10⁹ (0.26 × 10⁹) | |||
| Cell volume (μm3) | DRY | 0.1467 (0.2168 μm3) | χ2 = 73.766, df = 2; P = 0.0001 | REWET-wet/DRY (P < 0.05) |
| REWET | 0.1119 (0.1684 μm3) | DRY/WET (P < 0.05) | ||
| WET | 0.0935 (0.1627 μm3) | |||
| Abundance of total Bacteria (16S rRNA gene copies g−1 DW) | DRY | 2.51 × 10⁹ (0.73 × 10⁹) | F(2,12) = 6,633, P = 0.011 | DRY/WET (P = 0.009) |
| REWET | 1.93 × 10⁹ (0.6 × 10⁹) | |||
| WET | 1.08 × 10⁹ (0.51 × 10⁹) | |||
| Abundance of active Bacteria (16S rRNA copies g−1 DW) | DRY | 2.39 × 10¹¹ (0.84 × 10¹¹) | F(2.12) = 13.375; P = 0.001 | REWET-wet/DRY (P = 0.008) |
| REWET | 1.1 × 10¹¹ (0.32 × 10¹¹) | DRY/WET (P = 0.001) | ||
| WET | 0.64 × 10¹¹ (0.33 × 10¹¹) | |||
| Abundance of total Actinobacteria} (16S rRNA gene copies g−1 DW) | DRY | 1.76 × 10⁸ (0.37 × 10⁸) | F(2.12) = 5.452. P = 0.021 | DRY/WET (P = 0.016) |
| REWET | 1.37 × 10⁸ (0.34 × 10⁸) | |||
| WET | 0.97 × 10⁸ (0.43 × 10⁸) | |||
| Abundance of active Actinobacteria (16S rRNA copies g−1 DW) | DRY | 6.32 × 10⁹ (0.69 × 10⁹) | F(2.12) = 93.346. P = 0.0001 | REWET-wet/DRY (P = 0.0001) |
| REWET | 2.13 × 10⁹ (0.75 × 10⁹) | REWET-wet/WET (P = 0.026) | ||
| WET | 0.86 × 10⁹ (0.52 × 10⁹) | DRY/WET (P = 0.0001) | ||
| Abundance of total Archaea (16S rRNA gene copies g-1 DW) | DRY | 4.7 × 10⁷ (1.57 × 10⁷) | F(2.12) = 1.231. P = 0.326 | No significant differences found |
| REWET | 4.86 × 10⁷ (3.25 × 10⁷) | |||
| WET | 2.79 × 10⁷ (1.76 × 10⁷) | |||
| Abundance of active Archaea (16S rRNA copies g-1DW) | DRY | 1.39 × 10⁹ (0.13 × 10⁹) | F(2.12) = 4.463. P = 0.036 | DRY/WET (P = 0.043) |
| REWET | 1.3 × 10⁹ (0.5 × 10⁹) | |||
| WET | 0.71 × 10⁹ (0.42 × 10⁹) | |||
The water and organic carbon content in the sediment were determined gravimetrically on day 0 and day 77. The samples were transferred to aluminium plates, weighed and dried to a constant weight for 2 days at 60°C. The dry sediment was re-weighed to calculate the water content from the mass-loss of the water. Since the REWET treatment was finished with the REWET-wet phase we did not measure the water content from the REWET-dry treatment. As a consequence, we based the biotic and abiotic sediment parameters as shown in Table 1 on sediment dry weight and did not adjust them to water content. For the nonmetric multidimensional scaling (NMS; see statistics below) we assumed as a rough approximation water content of REWET-dry to be similar to DRY. The dried material was oxidized at 450°C in a muffle furnace and re-weighed. The loss upon oxidation is referred to as the ash free dry weight or the loss of the total carbon content (TCC).
Gas measurements
Gas measurements of CO2 and its carbon isotopic composition were collected by first sealing the cylinders gas-tight allowing for CO2 concentrations to increase over 18 h. Following this incubation, 12 ml (n = 5) of gas from the headspace of each cylinder was transferred into an N2-flushed 12 ml Exetainer (Labco, High Wycombe, UK). After incubation, the cylinders were opened again. For the δ13CO analysis, we used a Thermo Delta V Advantage isotope ratio mass spectrometer interfaced to a GasBench-II automated headspace sampler. Exetainers of sampled gas were loaded onto a Combi-Pal auto-sampler coupled to the GasBench. Helium was used to push the sample air out of the Exetainer and into the GasBench, where it was separated on a PoraPLOT Q gas chromatograph column, dried with a nafion drier, and then passed to the mass spectrometer via an open split. The internal precision of the analyses based on internal standards was 0.22‰.
Respiration rates were calculated from the linear increase in CO2 concentration over time in the closed system. The CO2 concentrations were determined by calibration to known standards based on the mass 44 peak area. In this manner, concentration and isotopic composition (δ13C) of CO2 were measured. Assuming mixing of two end members in our system (atmospheric CO2 and CO2 added to the system by respiration), Keeling plot analyses were used to determine the δ13C of the respired C (Kayler et al. 2010).
Oxygen measurements
To assess the oxygen concentrations of the sediment in the cores and to avoid anoxia, five cylinders (two in REWET and WET and one in DRY) were equipped with a needle-type optode (PreSens, Germany) to monitor the oxygen concentrations during closed cylinder incubation (Premke and Graeve 2009; Hoelker et al. 2015).
Fatty acid analysis
For PLFA extraction, 2 g of freeze-dried sediment sample was extracted with a modified one-phase Bligh/Dyer method (Frostegård, Tunlid and Bååth 1991). The lipids were separated into neutral, glyco- and polar lipids (including phospholipids) using solid phase extraction with silicic acid columns (BondElut® LRC-Si, Varian). The polar fraction containing the phospholipids was collected, and the fatty acid 19:0 (nonadecanoic acid) was added to the samples as an internal standard. The samples were subjected to a mild alkaline methanolysis for conversion to fatty acid methyl esters (FAME) for analysis by gas chromatography (GC). Standard nomenclature was used to refer to the PLFAs as described in the literature (Boschker and Middelburg 2002; Steger et al. 2011; Attermeyer et al. 2014). Quantification and identification of FAMEs and the stable carbon-isotopic composition of the individual PLFAs were determined on a Thermo GC/C-IRMS system composed of a Trace GC Ultra gas chromatograph (Thermo Electron Corp., Milan, Italy) coupled to a Delta V Advantage isotope ratio mass spectrometer through a GC/C-III interface (Thermo Fisher Corp., Bremen, Germany). The PLFA δ13C data were corrected for the addition of the methyl group by a simple mass balance. The offset between the total biomass and PLFA due to fractionation effects during fatty acid synthesis was corrected (Boschker, de Brouwer and Cappenberg 1999; Bouillon and Boschker 2006) by assuming a depletion in 13C of −3.7 ± 2.1‰ compared with the bacterial substrate (Bouillon and Boschker 2006) and, therefore, calculated the isotopic composition of the microbial biomass as follows: δ13C = δ 13Cfatty acid + 3.7‰. PLFA samples were taken at the beginning and at the end of the experiments. All replicates were taken but only a few could be analysed for stable isotope analysis limited to the high analysis costs. As such two replicates for the beginning and three to four for the end of the experiment were analysed. However, not all PLFAs could be found in each replicate (Supplementary Table S1).
DNA/RNA co-extraction and quantification of cDNA by real-time PCR
Sampling and analysis of total DNA and RNA were conducted at day 0, 29, 31, 74 and 77. Total DNA and RNA were co-extracted from 1 ml of sediment by a protocol proposed by Toewe et al. (2011), a phenol–chloroform extraction with subsequent column-based separation of DNA and RNA using the AllPrep DNA/RNA Mini Kit (Qiagen, Germany). The protocol was modified only in the doubling of the amounts of CTAB (10% final concentration) in the extraction buffer. The RNA was checked for DNA contamination by PCR amplification using primers fd1 and 926r (Amann, Ludwig and Schleifer 1995; Muyzer et al. 1995) and subsequently reversely transcribed to cDNA using the GoScript™ Reverse Transcriptase System (Promega, USA) with optimized Mg2+ concentrations of 3.5 mM.
Diluted cDNA samples were subjected to real-time PCR using the QuantiTect® SYBR® Green PCR master mix (Qiagen) in a reaction mixture of 20 μl containing 0.5 μM of each primer. The primers were 8f + EUB518r for Bacteria (Fierer et al. 2005), A364a + A934b for Archaea (Kemnitz, Kolb and Conrad 2005) and EUB338F + Act1159R for Actinobacteria (Blackwood, Oaks and Buyer 2005). Each sample was run in duplicate on an ABI Prism 7500 fast thermal cycler (Life Technologies, USA) with the profiles proposed by the original authors. The standard curves for real-time PCR calibration were obtained from genomic DNA samples from Pseudomonas putida F1 (for Bacteria) or Streptomyces avermitilis DSM 46492 (for Actinobacteria) or plasmid DNA harbouring a respective gene fragment (for Archaea) (Becker et al. 2014). The 16S rRNA gene copy numbers were calculated based on the genome size and the number of 16S rRNA genes present in the respective strains. Serial dilutions of the samples were used to prove the equal PCR efficiency of the standard and the DNA/cDNA samples. Only single peaks were observed in the dissociation curves from both the standards and the samples, indicating specific amplification with each set of primers.
T-RFLP analysis
T-RFLP analysis was performed from 0.5 μl of undiluted DNA or cDNA by amplification of the 16S rRNA gene fragments using the primers 8f labelled with 6-FAM and 926r (Ulrich and Becker 2006). The amplicons were digested with the restriction enzyme HhaI (New England Biolabs, USA), mixed with 1 μl of MapMarker® 1000 Rox size standard (Eurogentec, diluted 1:5), and subsequently separated on an ABI 310 DNA sequencer (Life Technologies). The data analysis of the T-RFLP profiles was performed using GeneMapper version 4.0 (Life Technologies). The peaks were assigned to T-RFs across all samples using bins with a range of 1 bp. The resulting T-RFLP profiles were normalized following Dunbar, Ticknor and Kuske (2001). The fluorescence of each peak was adjusted to the smallest profile, and only peaks above the threshold of 100 fluorescence units were considered.
Bacterial biomass and cell counts
The bacterial biomass and cells counts were analysed by epifluorescence microscopy (Buesing 2005) on a Carl Zeiss Axio Imager Z1 microscope (1000×). Sampling and analysis were performed at day 0, 29, 31, 74 and 77. Digital images were taken randomly (10 fields using an AxioCam HR3 camera) and processed in AxioVision Version 6.1.7601 (Carl Zeiss MicroImaging, Germany). Every cell was manually marked, and the software delivered the spatial dimensions for each marked cell. The cell volumes were calculated as rods or spheres according to the closest geometric shape. The biomass was calculated as the cell carbon content from mean biovolumes and abundance using a relationship proposed by Romanova and Sazhin (2010): fg C cell−1 = 133.754V0.438, where V is the cell volume in μm3.
Statistics
We used IBM SPSS Statistics version 23 for the statistical analyses. The differences between groups were determined with ANOVA followed by post hoc tests (Tukey's or Dunn's test). To test the assumption of normality we used the Shapiro–Wilks test and to check for variance homogeneity, Levene's test. If these assumptions were not fulfilled (cell content and cell volume), the Kruskal–Wallis test was applied followed by an all-pairwise multiple comparison procedures (Dunn's method) for these two parameters.
We used non-metric multidimensional scaling (NMS) to study the shifts of the bacterial community structure. The relative proportion of T-RFs served as the input for calculating the NMS using the Bray–Curtis distance calculated using PC-ORD v.6.08 (McCune and Mefford 2011). The stress values were in the range of 7.9–13.4%, indicating a reliable test performance. Kendall's rank correlations were calculated between the NMS scores and physicochemical soil properties as well as the other microbial parameters of the samples using R software (R-3.1.3; R Core Team 2015). Furthermore, the explanatory variables were tested on collinearity using variance inflation factors (VIF). As a result, the highly inflated parameters 16S rRNA gene copy numbers (for d74) and 16S rRNA copy numbers (for d77) were removed from the correlation analysis. Explanatory variables that were significantly correlated with at least one NMS axis (P < 0.05) were included as vectors on the ordination joint plots. Significant differences in the T-RFLP profiles were tested by means of the multi-response permutation procedure (MRPP), which evaluates the observed versus permuted within-group agreement and applies a rank transformation on T-RF abundance (Mielke and Berry 2001). The MRPP reports a change-corrected index of within-group agreement (A), which increases with decreasing variability within the test groups compared with differences between groups.
RESULTS
Abiotic parameters of the sediment
The sediment carbon content in the three different treatments differed slightly at the end of the experiment (Table 1). Significant differences were found between the WET (0.59% ± 0.08) and REWET treatments (0.48% ± 0.06). The soluble reactive phosphorus values were near the detection limit of 0.003 mg l−1 throughout the entire experiment, which indicated a possible P limitation. On day 0, prior to the addition of the labelled leaves, the average values for total P were 0.019 ± 0.004 mg l−1. On the last sampling day, the TP values had only increased in the REWET treatment (0.062 ± 0.045 mg l−1) and were significantly higher compared with both DRY (0.017 ± 0.009 mg l−1) and WET (0.011 ± 0.007 mg l−1). The results were not adjusted to the water content but are all referred to the dry weight of the sediment. Due to experimental set-up and sampling, water content could only be measured at the start and end of the experiment, and thus only water contents of REWET-wet, WET and DRY treatments/phases were determined. The oxygen level above the sediment was greater than 4 mg l−1 for all the sediment samples.
CO2 emissions and stable isotope data
At the beginning of the experiment (d6–d11), DRY and both REWET stages (REWET-dry and REWET-wet) had equal CO2 emission rates (0.21 ± 0.11 mmol l−1 h−1). The start data of the WET treatment are not available due to instrument problems. At the end of the experiment, the WET treatment exhibited significantly reduced respiration. The CO2 emissions increased in the DRY treatment and were significantly higher compared with the WET and REWET-wet treatments (DRY: 0.505 ± 0.181 mmol l−1 h−1; REWET-dry: 0.322 ± 0.019 mmol l−1 h−1; REWET-wet 0.034 ± 0.012 mmol l−1 h−1; WET: 0.146 ± 0.058 mmol l−1 h−1; Fig. 1a). The CO2 emissions in the dry stage of REWET (d74) were also significantly greater than those in the wet stage (d77).
Figure 1.
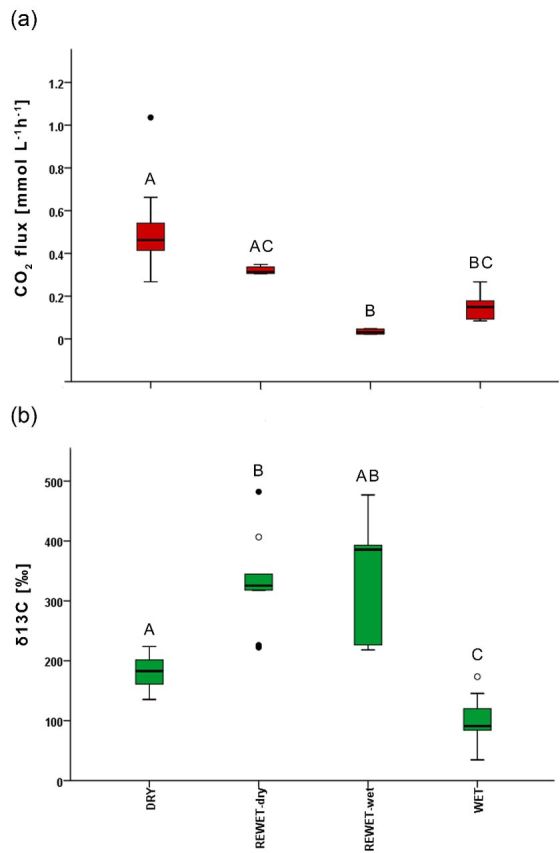
(a) Carbon dioxide flux and (b) respired 13CO2 for the three different treatments at the end of the experiment (day 66 and day 74). D, DRY; RW-dry, REWET-dry (Rewet cycle in the dry period); RW-wet, REWET-wet (Rewet cycle in the wet period); W, WET. The boundary of the box closest to zero indicates the 25th percentile, the line within the box marks the median, and the boundary of the box farthest from zero indicates the 75th percentile. Whiskers (error bars) above and below the box indicate the 90th and 10th percentiles, and circles indicate outlying points. Means with different letters are significantly different (P < 0.05).
Keeling plot analyses of the CO2 data revealed that the added 13C-labelled C source was used for respiration in all treatments. 13C of the respired CO2 was three times less in the WET treatment (101.1 ± 45.4‰, Fig. 1b) compared with REWET-wet (340 ± 113.3‰) and REWET-dry (331.3 ± 80.6‰). The DRY treatment (180.7 ± 28.0‰) also exhibited a slightly preferential use of the allochthonous C source compared with the WET treatment (Table 1).
C assimilation by microbes – stable isotope approach
The PLFA marker for heterotrophic bacteria in general (i/a 15:0) was significantly enriched in 13C after 77 days compared with the beginning of the experiment in all treatments (DRY, REWET and WET) (Fig. 2). Enrichment in the DRY treatment was the highest, and thus, the heterotrophic bacteria incorporated the highest portion of the allochthonous organic carbon (OCallo) sources in this treatment. Other PLFAs of microorganisms (e.g. i15:0, 16:0, and c18:1w9c, Fig. 2b–d, respectively) exhibited significant incorporation of the 13C labelled OCallo by revealing more enriched δ13C signals. However, between the two PLFA markers for Gram+ Bacteria, 14:0 exhibited no enrichment at the end of the treatments. In general, different hydrological conditions in the treatments led to different intensities of 13C label incorporation from OCallo use (Fig. 2b).
Figure 2.

Stable carbon isotope ratios in PLFA extracted from the sediment at day 0 and the end of experiment (day 77) in DRY, WET and REWET treatments. The most abundant PLFAs are illustrated: (a) 14:0, (b) i15:0, a marker for heterotrophic bacteria, (c) 16:0 (Gram+ bacteria), (d) 18:1ω9, a proxy for fungi, and (e) 20:5ω3 a biomarker for diatoms.
Dynamics of the microbial community
Microscopic cell counting
Fluorescence staining of the bacterial cells permits enumeration and estimations of cell size and shape. At the end of the experiment (d74–77), DRY exhibited the most cell counts ((0.98 ± 0.49) × 109 cells g−1 DW), which were significantly greater than the number of counted cells under WET conditions ((0.44 ± 0.26) × 109). REWET cell numbers were intermediate between the DRY and WET counts ((0.698 ± 0.18) × 109).
Cell volume and C content
In all treatments, the cell sizes were not normally distributed at the end of the experiment because the cells were either small cocci with a cell volume of less than 0.1 μm3 or larger rod-shaped and filamentous cells up to 2 μm3. Only a few mid-sized rod-shaped bacteria were present. The fraction of the cells larger than 0.1 μm3 was 40.5% in DRY, 25.3% in REWET and 17.0% in WET. The mean cell volume in DRY (0.15 ± 0.21 μm3) was significantly higher than those in both REWET (0.11 ± 0.16 μm3, P < 0.05) and WET (0.09 ± 0.16 μm3). Smaller mean volumes in REWET and WET were therefore mainly attributed to a lower abundance of large cells. The cell carbon contents per gram of sediment wet weight were calculated from the mean cell counts and volumes and were 56.8 μg C g−1 for DRY, 35.8 μg C g−1 for REWET and 21.0 μg C g−1 for WET.
Temporal dynamics of Archaea, Bacteria and Actinobacteria
Real-time PCR was used to quantify the 16S rRNA as well as the 16S rRNA gene copies of Archaea, Bacteria and Actinobacteria. DNA- and rRNA-based enumeration allowed the differentiation between the active and total community. The analyses of the active microbial community showed different patterns between the investigated groups and also differences in the dry and wet cycle under REWET conditions (Fig. 4). Figure 3 highlights how rRNA copy numbers increased during REWET-dry conditions (Fig. 3).
Figure 4.

Abundance of (a) the metabolically active (RNA-based) and (b) the total (DNA-based) Bacteria, Actinobacteria, and Archaea as determined by quantification of the 16S rRNA copy numbers. The abundance is presented for the three treatments REWET (triangles), DRY (diamonds) and WET (circles). The yellow part indicates the dry cycle.
Figure 3.

Changes of the relative abundance of Bacteria (diamonds), Actinobacteria (squares), and Archaea (triangles) based on 16S rRNA gene copy numbers under REWET conditions. A ratio of 1 represents the point where the rRNA gene copies peaked. The yellow part indicates the dry cycles.
Bacterial community structure
DNA- and RNA-based analyses at d74 and d77 revealed that the bacterial community in DRY was different from that present in REWET and WET. However, the latter communities were not different with the exception of one case (DNA-based total bacterial community at d74, Fig. 5c and d).
Figure 5.

Non-metric multidimensional scaling (NMS) ordination of the T-RFLP patterns of (a, b) the active and (c, d) the total bacterial community obtained from sediments on day 74 (a, c: REWET-dry) and day 77 (b, d: REWET-wet). The vectors indicate the strength and direction of the correlation with abiotic and biotic factors.
Active Bacteria (RNA-based)
The NMS ordination revealed a difference in the community structure of the active Bacteria (Fig. 5a and b). The DRY and WET samples were clearly distinct at both sampling points. At the end of the experiment, the REWET-dry samples were close to the WET samples, whereas the REWET-wet samples were located in between the two other treatments. The MRPP confirmed that the strongest differences were between WET and DRY bacterial communities. At the end of the experiment, the WET and REWET-dry communities were significantly different from DRY, with a high A value (Table 2). The water content correlated with the first axis for both sampling points (d74: r2 = 0.59; d77: r2 = 0.54) and corresponded with the separation between the DRY and WET treatments. The higher cell counts, biomass and 16S rRNA copies under DRY conditions were reflected by the correlations of these parameters with the first axis for both sampling points. In the later samples, 16S rRNA gene copies also correlated with the first NMS axis (Fig. 5).
Table 2.
Significance test (MRPP) of the changes in the bacterial community structure analysed by T-RFLP. *P < 0.05, **P < 0.01.
| Active bacteria (RNA-based) | Total bacteria (DNA-based) | ||
|---|---|---|---|
| d74 (REWET-dry) | REWET vs. DRY | 0.25** | 0.34** |
| REWET vs. WET | 0.07 | 0.19* | |
| DRY vs. WET | 0.35** | 0.38** | |
| d77 (REWET-wet) | REWET vs. DRY | 0.09* | 0.25** |
| REWET vs. WET | 0.06 | − 0.03 |
Total Bacteria (DNA based)
The NMS ordination plot of the community structure of the total Bacteria again demonstrated a clear separation between the DRY and WET samples (Fig. 5c and d). At the end of the experiment, the REWET-dry samples were in-between the other variants and therefore exhibited a similar pattern to that observed for the active Bacteria, whereas the REWET-wet and WET samples could not be differentiated. The MRPP test indicated significant differences among all three treatments, with the highest A values in comparison with the DRY samples (Table 2). At the REWET-wet sampling point, DRY was significantly different from WET and REWET, with almost identical A values. As observed in the active community, the water content was the only physicochemical sediment parameter that correlated significantly with the NMS axis (Table 2). The biomass and cell count correlated mainly with the first axis in the dry cycle at the end of the experiment. At the end of the wet cycle, Corg and 16S rRNA gene copies also correlated with the NMS axes, but primarily with the second axis in this case.
DISCUSSION
Based on our experimental approach, we demonstrated that the hydrological regime of the sediment mostly caused two linked effects: (i) change in the microbial use of available organic carbon, and (ii) change in the microbial communities in sandy aquatic ecosystems. Exposure of the microbial communities in the sediment to desiccating and rewetting events affects the degree of allochtonous C respiration as shown with the stable isotope data (Fig. 1). Incorporation of OCallo in the biomass of Fungi, total heterotrophic bacteria, and Actinobacteria was shown in the PLFA data (Fig. 2). We observed concurrent changes in the biota composition and increased bacterial activities that were fairly consistent with our process rate findings (Figs 3–5). Furthermore, desiccation of the sediment led to increased bacterial activities and shifts in microbial community composition and also affected the uptake of OCallo by Fungi, total heterotrophic bacteria and Actinobacteria (Fig. 2). In general, the OCallo proved to be an effective C source because the microorganisms continued to use it even after 11 weeks.
The permanent wet system (WET) in this study reflected the natural, permanently flooded conditions in a lake. The DRY treatment represented an environment exposed to drought, whereas REWET reflected an environment exposed to fluctuating water regimes, as is commonly found in the littoral zone, especially of small lakes and kettle holes (Premke et al. 2016). DRY and REWET therefore represent stressed lake ecosystems, and the responses to these conditions were monitored to better understand the effects of climate-change-related drought and rewetting events.
General microbial dynamics
The bacterial abundance of our experiment was similar to the abundances observed by Zoppini et al. (2010), who studied a sandy aquatic environment that was subjected to hydrological fluctuations. These authors concluded that the abundance they found (approximately 109 cells per gram) was a consequence of the low nutrient and OM concentrations. In agreement with this conclusion, the sandy sediments in our experiment also exhibited low P and OM concentrations.
In our study, the total bacteria had the highest rRNA gene copy numbers compared with Archaea. Actinobacteria constituted about 10% of the bacteria (Table 1), which was consistent with the proportions reported from river sediments: the relative share of Gram+ Bacteria (Actinobacteria and Firmicutes) in the bacterial community was 9–24% in a study conducted by Marxsen, Zoppini and Wilczek (2010). Moreover, the number of 16S rRNA gene copies of Archaea in relation to Bacteria was similar to that in another study, i.e. approximately 1% of the rRNA copies (Chan et al. 2005). Other studies confirmed this low abundance of Archaea in oxygenated sediments (e.g. 6% in Zepp Falz et al. 1999).
Desiccation and rewetting effects on microbial activity and abundance
Drought and rewetting events exerts a significant ecological selection pressure on microbial communities (Schimel 1999). For instance, in soils rapid changes in water potential create an osmotic shock in Bacteria, causing cell lysis and bacterial death. Microbial biomass can decrease by 17–58% as a consequence of a rewetting shock.
The microbial groups we investigated (Bacteria, Actinobacteria and Archaea) clearly responded to the water level cycling in the REWET treatment: the dry cycles in REWET were accompanied by higher 16S rRNA copy numbers than the wet cycles, and DRY exhibited higher values than WET. In conclusion, the changes of the abiotic conditions that occurred during desiccating promoted microbial growth over longer time periods (comparing DRY and WET after 77 days), but also in the short term (comparing REWET-dry at d74 to REWET-wet at d77).
Marxsen, Zoppini and Wilczek (2010) noted that Actinobacteria, and Gram+ Bacteria in general, possess a strong cell wall that withstands the osmotic pressure that accompanies desiccation and rewetting events. However, the majority of Actinobacteria are strict aerobes that decrease in abundance with increasing soil moisture content (Fierer et al. 2005; Cruz-Martinez et al. 2009). The highest moisture contents were present in WET and in the wet cycles of REWET, and as expected, Actinobacteria were less active under wet conditions. However, the activity of Actinobacteria clearly correlated with the water content of the treatments (Fig. 4a), which suggests an oxygen availability gradient.
Microbial community shifts induced by water level changes
The T-RFLP patterns demonstrated that only the most extreme hydrological changes (WET and DRY) significantly induced a shift in the active and total bacterial communities, which is consistent with the real-time PCR results. REWET results were intermediate in values for both DNA- and RNA-based patterns, indicating that no particular new community developed as a consequence of the repeated drying–rewetting cycles. This pattern is in contrast with our assumption (iii) in which we expect that the bacterial community in the REWET system would adapt over time and thus develop a characteristic community different from WET and DRY due to the severe and permanent changes to which it has been exposed.
One possible explanation for the characteristics of the T-RFLP patterns was the nutrient supply in the treatments. The experiment was designed to reflect nutrient parameters similar to those of the lake we sampled: low in phosphorus and organic matter in a sandy sediment. TP values in our experiment were comparable to those of oligotrophic lakes. Previous studies revealed that the bioavailable fraction does not exceed 60% of the TP and is often considerably less (Sonzogni et al. 1982), which suggests P limitation in our study. However, in other experiments, nitrate mobilization occurred in the transition from dry to wet interfaces (Butturini et al. 2003), and dissolved organic carbon (DOC) drastically changed in content and composition during rewetting (Vazquez et al. 2007).
The added leaf litter contained nutrients, and the microbes might benefit from the release of these nutrients over the course of leaf litter decomposition. However, leaf litter decomposition is reduced in freshwater systems with low nutrient concentrations and accelerated with greater availability of P (Gulis and Suberkropp 2003). Additionally, these authors found that microbial respiration, fungal and bacterial biomass, and the sporulation rate of aquatic hyphomycetes increased along with higher decomposition rates, indicating that P-limiting conditions affect microbial communities, which in turn affect the carbon turnover.
If the microfauna were nutrient limited throughout our experiment, the development of new community structures could be hindered, and the decomposition rate of leaf litter might be low compared with P-enriched systems. However, as P-limitation often occurs in natural freshwater systems (Hecky and Kilham 1988; Elser et al. 2007), our experiment suits natural conditions well because we do not overestimate the impacts of leaf litter decomposition and water fluctuations on the microbial community. The effect of nutrient limitation could have been even stronger in our WET treatment compared with our DRY and REWET treatments. In a natural freshwater system, water movements advectively transport nutrients into the sediment, thus fuelling microbial activity (Huettel, Ziebis and Forster 1996). Strong water flow occurs in REWET whenever the cylinders are lifted in and out of the water, and small water movements can occur in DRY when the water drains out of the pores in the course of drying. However, in the WET microcosm, no such transport occurs, and only diffusion can occur.
Tracking the C turnover in assimilation and respiration
By tracking labelled C through the microbial food web via the detection of 13C incorporated into PLFA biomarkers, we demonstrated that OCallo is an important source for benthic microorganisms. We acknowledge that carbon isotope fractionation might be different under different environmental conditions and with different bacterial metabolic pathways thus complicating the interpretation of the isotopic composition of biomarkers. Most PLFA biomarkers, however, show rather constant depletion relative to the whole microbial biomass whereas some others are more variable (Boschker and Middelburg 2002). In addition, changes in respiratory carbon isotope fractionation might lead to variation in whole microbial biomass carbon isotope composition and such variation might partially bias the interpretation of the carbon isotope incorporation. However, the application of a strongly labelled substrate, as done in our study, minimizes these potential errors.
In general, assimilation of OCallo occurred in all treatments. Microbial organisms differ in their ability to mineralize OC sources and in their turnover rates. This difference is considered to be most pronounced between Fungi and Bacteria. Bacteria are characterized by higher turnover rates than Fungi (del Giorgio and Cole 1998; del Giorgio 2005), but have a higher nutrient demand for their metabolisms. Thus, Bacteria have the ability to respire fresh, high nutritional carbon sources much faster, allowing them to outcompete Fungi under nutrient depletion. However, Fungi are more capable of relying on low-nutrient, complex carbon sources such as leaf litter. In addition, Bacteria are thought to rely on leaf litter colonization by Fungi before they can break down leaf litter carbon. Stable isotope analyses of the PLFA biomarker support the general assumption that some Gram+ Bacteria (16:0) and Fungi (18:1ω9) prefer complex organic carbon sources such as leaf litter in comparison with other bacterial groups (Fig. 2). However, we acknowledge that the replications of the given PLFA data are not always in the optimal range (Prosser 2010) and as such potential limitation of the results need to be taken into account.
Measurements of CO2 fluxes and their isotopic ratios in the headspace revealed that CO2 emissions were significantly greater in the DRY treatment than in REWET-wet and REWET-dry (Fig. 1a), whereas the use of OCallo was significantly lower in DRY than in REWET (Fig. 1b). However, even though respiration behaviour differs in the two REWET treatments, stable isotope analysis revealed that OC used for respiration in both treatments originates more strongly from the allochthonous OC source as compared with the other two treatments (Fig. 1b). In contrast, the high respiration in DRY appears to receive the OC source from C stored in the sediment as indicated by the lower share of OCallo (Fig. 1b). As such, OCallo was intensively used by microorganisms only under REWET conditions, showing that changes in hydrological regimes increased the substrate availability of OCallo. However, the use of OCallo did not lead to an increase in respiration rate. These results thus agree in some aspects and in others contrast with recent findings in the literature suggesting that allochthonous organic matter supports a portion of the respiration in aquatic ecosystems in many lakes and rivers (Hanson et al. 2003; Sobek et al. 2006; Jonsson et al. 2007; Karlsson, Ask and Jansson 2008).
The reduced metabolic activity is also indicated by the immediate reduction in CO2 fluxes once REWET entered the wet cycle. These findings are in accordance with results from wetlands where CO2 emissions were lowest at the highest water table (Chimner and Cooper 2003). However, these patterns are inconsistent with the results found for soils where the respiration rate increases after rewetting events (Xiang et al. 2008).
Dry soils have been found to display bursts of respiration after rewetting, a phenomena known as the ‘Birch effect’ (Birch 1958). The physical mechanism of the Birch effect is a rapid increase in water potential that releases cellular components of microbes, resulting in an increased C-supply for the remaining microorganisms (Birch 1958; Griffiths and Birch 1961; Jarvis et al. 2007). In contrast, our experiment show different results: sediments under REWET conditions exhibited higher CO2 emission rates and higher microbial activity in the dry phase rather than the wet phase (Figs 1a and 3a). One explanation could be that the sediments did not approach the same conditions in soil that triggers the Birch effect, e.g. the REWET sediments did not get to the dryness required to experience the Birch effect. Another possibility is that there was a local increase of nutrient concentration in the desiccating sediments resulting from the decrease of pore water concentrating the remaining nutrients. This is known to boost microbial growth and carbon processing and, in our case, results in an increase of respiration and microbial community activity during desiccating cycles (Fig. 3). Additionally, in contrast with soils, sediment redox conditions (e.g. anoxic to oxic or vice versa) can change dramatically during desiccation and thus favour OM decomposition. Repeated rewetting could possibly reduce the C flush to the physiology of the decomposer community, making them less vulnerable to drying, and the microbial communities can adapt to the dry cycles by resisting the changes in osmotic potential (Lundquist et al. 1999; Mikha, Rice and Milliken 2005). This effect could be due to less substrate availability, and after high CO2 production, the stock of labile C for respiration becomes lower.
Carbon turnover under different hydrological conditions
Microbial activity and C turnover were consistently low in the submerged WET system, and thus the incubated leaves were utilized to a lesser extent for respiration. There is a possibility that the litter in the wet system had been decomposed at the very beginning of our experiment and that at the time of sampling the litter substrate was already exhausted and thus the observed activity was low. We consider that highly unlikely since in comparing the dry and the wet cycle in the REWET treatment it is obvious that relative respiration rates and thus metabolic activity was reduced in sediments. Moreover, the WET system was not subjected to water table changes after the sediment was collected from the lake. Convection induced by the aeration moved only the water layer and was probably not sufficient to advectively transport nutrients into the sediment. The likely consequence is a steep gradient of nutrients and oxygen, which limits the overall productivity of the microbial community and the carbon turnover (Huettel, Ziebis and Forster 1996; Fischer, Wanner and Pusch 2002).
Throughout the experiment, the desiccating DRY treatment had sufficient water to maintain the highest microbial activity and respiration rates of any treatment. The DRY cylinders were lifted out of the water during the 77 days of incubation. After removal, the sediment still contained 17% water, which was only 15% less than WET. Under these conditions, microbial activity was promoted by desiccation and not hampered. The drying process appeared to be slow and might have occurred in successive steps. First, larger pores were drained gravimetrically; second, water in the smaller pores evaporated, and additionally, the C stock in the sediment became more available due to better oxygen penetration than in the other treatments. Therefore, one area after another was exposed to desiccation, and the impact of desiccation was prolonged for the duration of the experiment (accompanied by the described effects).
The REWET treatment was expected to increase the microbial activity and hypothesized to have the highest mineralization rates (CO2 emissions) due to the Birch effect. However, higher CO2 emissions were found in the dry stages of the REWET cycling (Fig. 1a), which can be explained by concentrated remaining nutrients in the pore water boosting microbial activity. The major carbon fraction utilized for respiration originated from the labelled leaf litter (Fig. 1b) and was possibly promoted by the repeated cycles of oxic–anoxic transitions deep in the sediment previously found to promote the degradation of organic matter (Hulthe, Hulth and Hall 1998).
The mechanism described above and/or oxygen availability in REWET indicates that processes associated with drying increases microbial activity and CO2 flux as in DRY. Due to the sediment rewetting, the drying effect was limited to certain regions in the REWET sediment, which explains the lower respiration rates of REWET compared with DRY. Due to the short phase of drying in REWET, only fast draining areas would be subjected to significant water losses. In time, these fast draining areas would become depleted in carbon, as they were frequently exposed to conditions that favour the degradation of organic substances. Regions that were still water saturated would therefore remain at low activity rates, as observed in the WET system.
In our study, we have demonstrated the impact of the shifts in hydrological regime on the microbial community and its associated C turnover with microbial methods (PLFA, cell counting, rRNA-based abundance and community structure of total and active microbial communities) and biogeochemical methods (stable isotope and gas measurements) in sandy sediments from temperate climate. Slow desiccation processes will more likely occur in Central European inland waters. We have shown that the impact of desiccation and rewetting results in complex effects and feedbacks in C turnover and microbial activity and community composition. We found that desiccation of the sediment led to stimulated bacterial growth and activity, while simultaneously, the microbial community composition remained relatively stable, from which we can infer that the communities are well-adapted to changes in hydrological regime and we should expect a compositional change only at the hydrological extremes (WET and DRY). With regards to the carbon dynamics, we consistently observed an increase in C mineralization in drying samples regardless of the water treatment regime. However, the fluctuating water regime led to an increase in respiration of OCallo without affecting total respiration flux. In summary, we have provided evidence that suggests the effects of drying threatens inland C stocks of water bodies under the predicted climate scenarios, and that the frequency of submerging events might actually hinder enhanced C mineralization.
Supplementary Material
Acknowledgments
We thank Sigune Weinert for technical assistance in RNA and DNA analyses, Bertram Gusovious for gas analyses, Marten Schmidt for helping to program the motor and set up the lifting system, and Frau Remus for preparing the samples for isotope analysis.
SUPPLEMENTARY DATA
FUNDING
Financial support was provided by the project (‘Connecting processes and structures driving the landscape carbon dynamics over scales’) financed by the .
Conflict of interest. None declared.
REFERENCES
- Amann RI, Ludwig W, Schleifer KH. Phylogenetic identification and in situ detection of individual microbial cells without cultivation. Microbiol Rev. 1995;59:143–69. doi: 10.1128/mr.59.1.143-169.1995. [DOI] [PMC free article] [PubMed] [Google Scholar]
- Attermeyer K, Hornick T, Kayler ZE, et al. Enhanced bacterial decomposition with increasing addition of autochthonous to allochthonous carbon without any effect on bacterial community composition. Biogeosciences. 2014;11:1479–89. [Google Scholar]
- Aufdenkampe AK, Mayorga E, Raymond PA, et al. Riverine coupling of biogeochemical cycles between land, oceans, and atmosphere. Front Ecol Environ. 2011;9:53–60. [Google Scholar]
- Becker R, Bubner B, Remus R, et al. Impact of multi-resistant transgenic Bt maize on straw decomposition and the involved microbial communities. Appl Soil Ecol. 2014;73:9–18. [Google Scholar]
- Billings WD, Luken JO, Mortensen DA, et al. Arctic Tundra – a source or sink for atmospheric carbon-dioxide in a changing environment. Oecologia. 1982;53:7–11. doi: 10.1007/BF00377129. [DOI] [PubMed] [Google Scholar]
- Birch HF. The effect of soil drying on humus decomposition and nitrogen availability. Plant Soil. 1958;10:9–31. [Google Scholar]
- Blackwood CB, Oaks A, Buyer JS. Phylum- and class-specific PCR primers for general microbial community analysis. Appl Environ Microbiol. 2005;71:6193–8. doi: 10.1128/AEM.71.10.6193-6198.2005. [DOI] [PMC free article] [PubMed] [Google Scholar]
- Blodau C. Evidence for a hydrologically controlled iron cycle in acidic and iron rich sediments. Aquat Sci. 2004;66:47–59. [Google Scholar]
- Boschker HTS, de Brouwer JFC, Cappenberg TE. The contribution of macrophyte-derived organic matter to microbial biomass in salt-marsh sediments: stable carbon isotope analysis of microbial biomarkers. Limnol Oceanogr. 1999;44:309–19. [Google Scholar]
- Boschker HTS, Middelburg JJ. Stable isotopes and biomarkers in microbial ecology. FEMS Microbiol Ecol. 2002;40:85–95. doi: 10.1111/j.1574-6941.2002.tb00940.x. [DOI] [PubMed] [Google Scholar]
- Bouillon S, Boschker HTS. Bacterial carbon sources in coastal sediments: a cross-system analysis based on stable isotope data of biomarkers. Biogeosciences. 2006;3:175–85. [Google Scholar]
- Buesing N. Bacterial counts and biomass determination by epifluorescence microscopy. In: Graça MS, Bärlocher F, Gessner M, editors. Methods to Study Litter Decomposition. Dordrecht: Springer Netherlands; 2005. pp. 203–8. [Google Scholar]
- Butturini A, Bernal S, Nin E, et al. Influences of the stream groundwater hydrology on nitrate concentration in unsaturated riparian area bounded by an intermittent Mediterranean stream. Water Resour Res. 2003;39:1110. [Google Scholar]
- Chan OC, Claus P, Casper P, et al. Vertical distribution of structure and function of the methanogenic archaeal community in Lake Dagow sediment. Environ Microbiol. 2005;7:1139–49. doi: 10.1111/j.1462-2920.2005.00790.x. [DOI] [PubMed] [Google Scholar]
- Chimner RA, Cooper DJ. Carbon dynamics of pristine and hydrologically modified fens in the southern Rocky Mountains. Canadian Journal of Botany-Revue Canadienne De Botanique. 2003;81:477–91. [Google Scholar]
- Cole JJ, Prairie YT, Caraco NF, et al. Plumbing the global carbon cycle: integrating inland waters into the terrestrial carbon budget. Ecosystems. 2007;10:171–84. [Google Scholar]
- Cruz-Martinez K, Suttle KB, Brodie EL, et al. Despite strong seasonal responses, soil microbial consortia are more resilient to long-term changes in rainfall than overlying grassland. Isme J. 2009;3:738–44. doi: 10.1038/ismej.2009.16. [DOI] [PubMed] [Google Scholar]
- del Giorgio PA, Cole JJ. Bacterial growth efficiency in natural aquatic systems. Annu Rev Ecol Syst. 1998;29:503–41. [Google Scholar]
- del Giorgio PA, Williams PJ. Respiration in aquatic ecosystems: from single cells to the biosphere. In: del Giorgio PA, Williams PJ, editors. Respiration in Aquatic Ecosystems. Oxford: Oxford University Press; 2005. pp. 267–303. [Google Scholar]
- den Heyer C, Kalff J. Organic matter mineralization rates in sediments: a within- and among-lake study. Limnol Oceanogr. 1998;43:695–705. [Google Scholar]
- Dunbar J, Ticknor LO, Kuske CR. Phylogenetic specificity and reproducibility and new method for analysis of terminal restriction fragment profiles of 16S rRNA genes from bacterial communities. Appl Environ Microbiol. 2001;67:190–7. doi: 10.1128/AEM.67.1.190-197.2001. [DOI] [PMC free article] [PubMed] [Google Scholar]
- Elser JJ, Bracken MES, Cleland EE, et al. Global analysis of nitrogen and phosphorus limitation of primary producers in freshwater, marine and terrestrial ecosystems. Ecol Lett. 2007;10:1135–42. doi: 10.1111/j.1461-0248.2007.01113.x. [DOI] [PubMed] [Google Scholar]
- Evtimova VV, Donohue I. Quantifying ecological responses to amplified water level fluctuations in standing waters: an experimental approach. J Appl Ecol. 2014;51:1282–91. [Google Scholar]
- Fierer N, Jackson JA, Vilgalys R, et al. Assessment of soil microbial community structure by use of taxon-specific quantitative PCR assays. Appl Environ Microbiol. 2005;71:4117–20. doi: 10.1128/AEM.71.7.4117-4120.2005. [DOI] [PMC free article] [PubMed] [Google Scholar]
- Fischer H, Wanner SC, Pusch M. Bacterial abundance and production in river sediments as related to the biochemical composition of particulate organic matter (POM) Biogeochemistry. 2002;61:37–55. [Google Scholar]
- Fromin N, Pinay G, Montuelle B, et al. Impact of seasonal sediment desiccation and rewetting on microbial processes involved in greenhouse gas emissions. Ecohydrology. 2010;3:339–48. [Google Scholar]
- Frostegård A, Tunlid A, Bååth E. Microbial biomass measured as total lipid phosphate in soils of different organic content. J Microbiol Methods. 1991;14:151–63. [Google Scholar]
- Gerull L, Frossard A, Gessner MO, et al. Variability of heterotrophic metabolism in small stream corridors of an early successional watershed. J Geophys Res Biogeosci. 2011;116:G02012. [Google Scholar]
- Grasshoff K, Emrhardt M, Kremling K. Methods of Seawater Analysis. 2nd edn. New York: Verlag Chemie; 1983. p. 419. [Google Scholar]
- Griffiths E, Birch H. Microbiological changes in freshly moistened soil. Nature. 1961;189:424. [Google Scholar]
- Gulis V, Suberkropp K. Leaf litter decomposition and microbial activity in nutrient-enriched and unaltered reaches of a headwater stream. Freshwater Biol. 2003;48:123–34. [Google Scholar]
- Hanson PC, Bade DL, Carpenter SR, et al. Lake metabolism: relationships with dissolved organic carbon and phosphorus. Limnol Oceanogr. 2003;48:1112–9. [Google Scholar]
- Hecky RE, Kilham P. Nutrient limitation of phytoplankton in freshwater and marine environments: A review of recent evidence on the effects of enrichment. Limnol Oceanogr. 1988;33:796–822. [Google Scholar]
- Hoelker F, Wurzbacher C, Weissenborn C, et al. Microbial diversity and community respiration in freshwater sediments influenced by artificial light at night. Philos Trans Roy Soc B Biol Sci. 2015;370 doi: 10.1098/rstb.2014.0130. [DOI] [PMC free article] [PubMed] [Google Scholar]
- Huettel M, Ziebis W, Forster S. Flow-induced uptake of particulate matter in permeable sediments. Limnol Oceanogr. 1996;41:309–22. [Google Scholar]
- Hulthe G, Hulth S, Hall POJ. Effect of oxygen on degradation rate of refractory and labile organic matter in continental margin sediments. Geochim Cosmochim Acta. 1998;62:1319–28. [Google Scholar]
- IPCC. Climate Change 2014: Mitigation of Climate Change. Contribution of Working Group III to the Fifth Assessment Report of the Intergovernmental Panel on Climate Change. Cambridge and New York: Cambridge University Press; 2014. [Google Scholar]
- Jarvis P, Rey A, Petsikos C, et al. Drying and wetting of Mediterranean soils stimulates decomposition and carbon dioxide emission: the “Birch effect”. Tree Physiol. 2007;27:929–40. doi: 10.1093/treephys/27.7.929. [DOI] [PubMed] [Google Scholar]
- Jonsson A, Algesten G, Bergstrom AK, et al. Integrating aquatic carbon fluxes in a boreal catchment carbon budget. J Hydrol. 2007;334:141–50. [Google Scholar]
- Karlsson J, Ask J, Jansson M. Winter respiration of allochthonous and autochthonous organic carbon in a subarctic clear-water lake. Limnol Oceanogr. 2008;53:948–54. [Google Scholar]
- Kayler ZE, Ganio L, Hauck M, et al. Bias and uncertainty of delta(CO2)-C-13 isotopic mixing models. Oecologia. 2010;163:227–34. doi: 10.1007/s00442-009-1531-6. [DOI] [PubMed] [Google Scholar]
- Kemnitz D, Kolb S, Conrad R. Phenotypic characterization of Rice Cluster III archaea without prior isolation by applying quantitative polymerase chain reaction to an enrichment culture. Environ Microbiol. 2005;7:553–65. doi: 10.1111/j.1462-2920.2005.00723.x. [DOI] [PubMed] [Google Scholar]
- Krysanova V, Arnold JG. Advances in ecohydrological modelling with SWAT-a review. Hydrologiques Hydrolog Sci J-J Des Sci. 2008;53:939–47. [Google Scholar]
- Kusel MMH, Sly PD, Holt PG. No day-care visits during the first year of life for infants with atopic parents? Reply. J Allergy Clin Immunol. 2008;121:535–6. doi: 10.1016/j.jaci.2007.07.064. [DOI] [PubMed] [Google Scholar]
- Lundquist EJ, Scow KM, Jackson LE, et al. Rapid response of soil microbial communities from conventional, low input, and organic farming systems to a wet/dry cycle. Soil Biology & Biochemistry. 1999;31:1661–75. [Google Scholar]
- Marxsen J, Zoppini A, Wilczek S. Microbial communities in streambed sediments recovering from desiccation. FEMS Microbiol Ecol. 2010;71:374–86. doi: 10.1111/j.1574-6941.2009.00819.x. [DOI] [PubMed] [Google Scholar]
- McClain ME, Boyer EW, Dent CL, et al. Biogeochemical hot spots and hot moments at the interface of terrestrial and aquatic ecosystems. Ecosystems. 2003;6:301–12. [Google Scholar]
- McCune B, Mefford MJ. PC-ORD. Multivariate Analysis of Ecological Data. 6th edn. Gleneden Beach, OR, USA: MjM Software; 2011. [Google Scholar]
- Mielke PW, Jr, Berry KJ. Permutation Methods: A Distance Function Approach. New York: Springer; 2001. Series in Statistics. [Google Scholar]
- Mikha MM, Rice CW, Milliken GA. Carbon and nitrogen mineralization as affected by drying and wetting cycles. Soil Biology & Biochemistry. 2005;37:339–47. [Google Scholar]
- Moore TR, Knowles R. The influence of water-table levels on methane and carbon-dioxide emissions from peatland soils. Can J Soil Sci. 1989;69:33–8. [Google Scholar]
- Muyzer G, Teske A, Wirsen CO, et al. Phylogenetic relationships of Thiomicrospira species and their identification in deep-sea hydrothermal vent samples by denaturing gradient gel electrophoresis of 16S rDNA fragments. Arch Microbiol. 1995;164:165–72. doi: 10.1007/BF02529967. [DOI] [PubMed] [Google Scholar]
- Parsons TR, Strickland JDH. Discussion of spectrophotometric determination of marine plankton pigments, with revised equations of ascertaining chlorophyll a and carotenoids. J Mar Res. 1963;21:155–63. [Google Scholar]
- Premke K, Attermeyer K, Augustin J, et al. The importance of landscape complexity for carbon fluxes on the landscape level: small-scale heterogeneity matters. WIREs Water. 2016 doi: 10.1002/wat2.1147. [DOI] [Google Scholar]
- Premke K, Graeve M. Metabolism and physiological traits of the deep sea amphipod Eurythenes gryllus. Vie Et Milieu Life Environ. 2009;59:251–60. [Google Scholar]
- Prosser JI. Replicate or lie. Environ Microbiol. 2010;12:1806–10. doi: 10.1111/j.1462-2920.2010.02201.x. [DOI] [PubMed] [Google Scholar]
- R Core Team. R: A Language and Environment for Statistical Computing. Vienna: R Foundation for Statistical Computing; 2015. http://www.R-project.org/ [Google Scholar]
- Reiche M, Haedrich A, Lischeid G, et al. Impact of manipulated drought and heavy rainfall events on peat mineralization processes and source-sink functions of an acidic fen. J Geophys Res Biogeosci. 2009;114:G02021. [Google Scholar]
- Romanova ND, Sazhin AF. Relationships between the cell volume and the carbon content of bacteria. Oceanology. 2010;50:522–30. [Google Scholar]
- Schimel D. Carbon cycle conundrums. Proc Natl Acad Sci USA. 2007;104:18353–4. doi: 10.1073/pnas.0709331104. [DOI] [PMC free article] [PubMed] [Google Scholar]
- Schimel D. The terrestrial biosphere and global change: Implications for natural and managed ecosystems. Nature. 1999;400:522–3. [Google Scholar]
- Sobek S, Soderback B, Karlsson S, et al. A carbon budget of a small humic lake: an example of the importance of lakes for organic matter cycling in boreal catchments. Ambio. 2006;35:469–75. doi: 10.1579/0044-7447(2006)35[469:acboas]2.0.co;2. [DOI] [PubMed] [Google Scholar]
- Sonzogni WC, Chapra SC, Armstrong DE, et al. Bioavailability of phosphorus inputs to lakes. J Environ Qual. 1982;11:555. [Google Scholar]
- Steger K, Premke K, Gudasz C, et al. Microbial biomass and community composition in boreal lake sediments. Limnol Oceanogr. 2011;56:725–33. [Google Scholar]
- Steger K, Premke K, Gudasz C, et al. Comparative study on bacterial carbon sources in lake sediments: the role of methanotrophy. Aquat Microb Ecol. 2015;76:39–47. [Google Scholar]
- Toewe S, Wallisch S, Bannert A, et al. Improved protocol for the simultaneous extraction and column-based separation of DNA and RNA from different soils. J Microbiol Methods. 2011;84:406–12. doi: 10.1016/j.mimet.2010.12.028. [DOI] [PubMed] [Google Scholar]
- Tranvik LJ, Downing JA, Cotner JB, et al. Lakes and reservoirs as regulators of carbon cycling and climate. Limnol Oceanogr. 2009;54:2298–314. [Google Scholar]
- Ulrich A, Becker R. Soil parent material is a key determinant of the bacterial community structure in arable soils. FEMS Microbiol Ecol. 2006;56:430–43. doi: 10.1111/j.1574-6941.2006.00085.x. [DOI] [PubMed] [Google Scholar]
- Vazquez E, Romani AM, Sabater F, et al. Effects of the dry-wet hydrological shift on dissolved organic carbon dynamics and fate across stream-riparian interface in a mediterranean catchment. Ecosystems. 2007;10:239–51. [Google Scholar]
- Wetzel RG, Likens GE. Limnological Analyses. 2nd edn. New York: Springer; 1991. p. S.39. [Google Scholar]
- Xiang S-R, Doyle A, Holden PA, et al. Drying and rewetting effects on C and N mineralization and microbial activity in surface and subsurface California grassland soils. Soil Biol Biochem. 2008;40:2281–9. [Google Scholar]
- Zepp Falz K, Holliger C, Großkopf R, et al. Vertical distribution of methanogens in the anoxic sediment of Rotsee (Switzerland) Appl Environ Microbiol. 1999;65:2402–8. doi: 10.1128/aem.65.6.2402-2408.1999. [DOI] [PMC free article] [PubMed] [Google Scholar]
- Zohary T, Ostrovsky I. Ecological impacts of excessive water level fluctuations in stratified freshwater lakes. Inland Waters. 2011;1:47–59. [Google Scholar]
- Zoppini A, Amalfitano S, Fazi S, et al. Dynamics of a benthic microbial community in a riverine environment subject to hydrological fluctuations (Mulargia River, Italy) Hydrobiologia. 2010;657:37–51. [Google Scholar]
Associated Data
This section collects any data citations, data availability statements, or supplementary materials included in this article.