Abstract
Woodlice efficiently sequester copper (Cu) in ‘cuprosomes' within hepatopancreatic ‘S' cells. Binuclear ‘B’ cells in the hepatopancreas form iron (Fe) deposits; these cells apparently undergo an apocrine secretory diurnal cycle linked to nocturnal feeding. Synchrotron-based µ-focus X-ray spectroscopy undertaken on thin sections was used to characterize the ligands binding Cu and Fe in S and B cells of Oniscus asellus (Isopoda). Main findings were: (i) morphometry confirmed a diurnal B-cell apocrine cycle; (ii) X-ray fluorescence (XRF) mapping indicated that Cu was co-distributed with sulfur (mainly in S cells), and Fe was co-distributed with phosphate (mainly in B cells); (iii) XRF mapping revealed an intimate morphological relationship between the basal regions of adjacent S and B cells; (iv) molecular modelling and Fourier transform analyses indicated that Cu in the reduced Cu+ state is mainly coordinated to thiol-rich ligands (Cu–S bond length 2.3 Å) in both cell types, while Fe in the oxidized Fe3+ state is predominantly oxygen coordinated (estimated Fe–O bond length of approx. 2 Å), with an outer shell of Fe scatterers at approximately 3.05 Å; and (v) no significant differences occur in Cu or Fe speciation at key nodes in the apocrine cycle. Findings imply that S and B cells form integrated unit-pairs; a functional role for secretions from these cellular units in the digestion of recalcitrant dietary components is hypothesized.
Keywords: iron, copper, speciation, µ-focus, synchrotron, isopod
1. Introduction
Approximately 30% of all proteins are considered to require a metal cofactor, usually a transition metal such as Cu, Fe, Mn or Zn [1]. Moreover, metal ions and proteins are also functionally interdependent in other ways, including metal-mediated control of gene expression [2], direct [3] and indirect [4] metal ion involvement in intracellular signalling, and the roles of certain proteins as metallochaperones [5] and metallotransporters [6]. The requisite selectivity of these molecular events crucially depends on discriminatory metal sensors [7]. It is almost inevitable that imbalances in the homeostasis of these essential transition metals can lead to cytotoxicity and disease processes in both invertebrates and vertebrates because surpluses of redox-active species often induce reactive oxyradical generation [8]. For example, elevated levels of Fe are associated with neurodegenerative conditions such as Alzheimer's disease [9], while the progressive liver degeneration in the genetic disorder Wilson's disease is characterized by gross Cu deposition within hepatocytes [10]. Thus, cells and organisms are both beneficiaries and hostages of the coordination chemistries and redox properties of metabolically essential transition metals.
In general, essential and non-essential metals are heterogeneously distributed among biological tissues and are often compartmentalized within individual cells as a function of their identities, life-stage or health [11,12]. Significant insights into the physiology and pathophysiology of metals can potentially, therefore, be provided by bio-imaging techniques [13–15]. While technically challenging, combining the mapping of metals within subcellular compartments and simultaneously determining their chemical states (i.e. ‘speciation’) is a necessary prelude to better understanding metal homeostasis [2]. Synchrotron-based X-ray absorption spectroscopy (XAS) bio-imaging, in different modes, can map metal distributions in a spatially resolved manner, as well as providing information about oxidation states and covalence numbers. In addition, this family of intense brightness techniques can furnish structural information about the identities of neighbouring atoms, as well as information about the bond lengths separating neighbouring atoms from the metal atom cores being probed spectroscopically [16], unique properties beyond the capabilities of X-ray analyses in electron and proton probe instruments [13].
Molecular-genetic evidence indicates that Cu and Fe transport and homeostatic pathways are highly conserved from yeast to mammals [17,18]. A corollary of this statement is that the interdependent features of the Cu and Fe transport networks in mammals are illuminated by observations in lower organisms. This principle has motivated major research efforts on Cu and Fe metabolism in yeast as a model system [8,19], but has not hitherto engendered equivalent detailed studies on the diverse, often highly discriminating, intracellular metal-sequestering organelles of invertebrates. We propose to address this shortcoming by describing spatially resolved Cu and Fe redox states as well as ligand-binding speciation in the midgut (hepatopancreas) of terrestrial isopods, whose constituent cells offer an impressive example of transition metal specificity, partitioning and homeostasis.
Terrestrial isopods (suborder Oniscidae; commonly and variously referred to as ‘woodlice’, ‘sowbugs' and ‘slaters') are the most successful crustacean land colonizers [20]. They have long been recognized as generalist detritivores [21], but recent observations suggest that they warrant the status of keystone fungal grazers in temperate woodland habitats [22]. The taxon evolved in shallow seas during the Early to Mid-Palaeozoic era (ca 541–440 Ma), a period during which oxidation conditions had resulted in Fe availability in seawater plummeting with concomitant rise in Cu availability [23]. It is highly plausible that the respiratory pigment of isopods, haemocyanin, evolved from phenoloxidase, a type 3 Cu protein, with the conversion from enzymatic to oxygen-binding functions being facilitated through occlusion of the catalytic site by a peptide domain [24]. Oxygen binding by haemocyanin involves pairs of Cu atoms becoming oxidized from Cu (I) to Cu (II). Haemocyanin is synthesized in a four-lobed tubular hepatopancreas, an organ containing the highest soft tissue Cu concentration recorded in any terrestrial animal under physiological conditions [25], a storage level that is orders of magnitude higher than that required to satisfy direct respiratory demands [26]. Cu assimilation efficiency and storage capacity in isopods evidently increases with the degree of adaptation to terrestrial habitats, perhaps because Cu is at least periodically difficult for woodlice to acquire [27].
Numerous studies have shown that the woodlouse hepatopancreas comprises two distinct cell types in roughly equal numbers and possibly forming functionally integrated units: (i) small conical ‘S' cells that are mainly absorptive, and basally contain numerous discrete Cu-storing organelles, the cuprosomes, with an S-donating matrix; and (ii) large binucleate ‘B’ cells projecting into the organ's lumen that are involved in absorption and secretion, and contain glycogen, prominent lipid droplets and multivesicular organelles with floccular Fe deposits sequestered [28–31] within a phosphate-rich matrix [25,28–31]. The half-life of S cells and their cuprosomes is relatively long, with some authors (e.g. [32]), but not all [33], claiming that Cu loss is negligible even in woodlice consuming a Cu-impoverished diet. The nature of the Cu-binding ligand chemistry of cuprosomes has not hitherto been described; Donker et al. [34] concluded that Porcellio scaber hepatopancreas may not contain thiol-rich metallothionein (MT), although Žnidaršič [35] did identify MT-like protein in the hindgut of the same woodlouse species. It is reasonable to hypothesize that cuprosomes not only immobilize Cu to protect the storage cell from the potential toxicity of this redox-active metal, but must also be able to release Cu to serve haemocyanin synthesis and phenoloxidase-related nutritional and immune function requirements. The cytology and metallome of B cells are even less well understood than those of S cells. Hames & Hopkin [36] reported that B cells of the predominantly nocturnal woodlice P. scaber and Oniscus asellus are morphologically plastic, undergoing a striking diurnal cycle during which the contents of the apical cytoplasm, including the Fe inclusions and lipid, are extruded at the end of the dark phase and well into the light phase in a manner reminiscent of apocrine secretion; this is followed by gradual restitution beginning towards the end of the light phase and completed during the dark phase when the cytoplasm becomes fully recharged. Thus, according to Hames & Hopkin [36], there appears to be a continuous daily cycle of Fe acquisition and excretion from B cells. By contrast, Lešer et al. [29], in a less temporally resolved study, also observed B-cell lipid droplet extrusion in P. scaber that did not appear to follow a distinctive daily pattern. If daily B-cell rhythmicity as described by Hames & Hopkin [36] does occur, it begs fundamental questions regarding either the metabolic wastefulness or metabolic functions of wholesale release of lipid and mineralized Fe into the midgut lumen. On the other hand if, as according to Lešer et al. [29], it does not occur, we are still left with unanswered questions relating to the chemical states and possible metabolic interactivity of Cu and Fe within the contiguous S and B cells.
The broad aim of this study was the in situ characterization of the distinct Cu-phile and Fe-phile organelles in two specialized epithelial cell types in order to better understand how transition metal storage and metabolism in woodlice contribute to their success as land colonizers, and also to explore the possibility that these organelles might provide tractable model systems for probing vital aspects of transition metal speciation and interactions at the subcellular level. Of all the available bio-imaging techniques, high-brightness and highly coherent synchrotron-based X-ray fluorescence (XRF) microscopy is uniquely capable of providing the necessary analytical sensitivity, spatial resolution and ability to determine metal oxidation states [15,16,37] to pursue these goals. Our study had a core specific aim: to determine in situ the oxidation states and ligand-binding speciation of Cu and Fe in the S and B cells of the hepatopancreas in laboratory-acclimated woodlouse (O. asellus) at two extreme nodes of the presumptive daily B-cell extrusion/restitution cycle, using preparative procedures that preserve simultaneously the integrity of cellular morphology and chemistry. We undertook an adjunct experiment using light microscope-based morphometry to determine the presence of a daily wave of apocrine secretory activity in the B cells of our cultured woodlice.
2. Material and methods
2.1. Whole hepatopancreas elemental analyses
Pooled hepatopancreas tubules (each replicate dissected from five individual Oniscus asellus) were digested in 2 ml boiling 16N HNO3 on a sand bath. Digests were made up to 10 ml with ultrapure water, and analysed in a JY Horiba Ultima-2 inductively coupled plasma optical emission spectrometer (ICP-OES). Five replicates of hepatopancreas were collected at 02.00 and 12.00 h, these intervals corresponding with the times at which the tubules for synchrotron-based imaging and analysis were taken. Analyses of a standard tissue (marine mussel, GBW 08571; State Bureau of Technical Supervision, China) indicated that the combined tissue-processing and analytical protocols yielded values within 8% of expectations.
2.2. Hepatopancreas morphometry
For the morphometry experiment, adult inter-moult woodlice (O. asellus; Crustacea, Isopoda, Oniscidae) were collected from an unpolluted reference site at Coopers Field, Bute Park, Cardiff, UK (NGR 317819 176785, 51°29′20.4″ N, 3°11′20.4″ W). Eight individuals were placed into each of 12 plastic pots (8 cm diameter, 5 cm high) with perforated lids. Dry, heat-sterilized soil from the sampling site had already been inserted into the pots to a depth of 2 cm and then moistened thoroughly with deionized water. Leaf litter (Acer pseudoplanatus) from Coopers Field was added to the pots as a food source. Soil moisture and food were checked at weekly intervals during the acclimation period, and replenished as required. The woodlice were maintained in their pots for four weeks in a Binder GmbH incubator (Tuttlingen, Germany) at 20°C, 75% humidity, and a 12 L : 12 D regime (light on at 11.45, light off at 23.45). After the four-week acclimation period, pots containing woodlice were removed from the incubator at 2-hourly intervals for 24 h. Single hepatopancreas tubules freshly dissected from six individuals at each sampling interval were fixed for at least 24 h in 10% neutral-buffered-formalin. After washing in phosphate-buffered saline, groups of six tubules were embedded and aligned in parallel in warm 1% agarose within proprietary cryo-moulds. (Grouping tubules in this way significantly reduced sectioning and staining effort, and thus efficiently facilitated the replication necessary for morphometric analysis.) The solidified agarose blocks were dehydrated in ethanol, wax-embedded, sectioned at a thickness of 8 µm in the mid-regions of the aligned tubules, mounted on glass slides, and stained in haematoxylin and eosin (H&E) for imaging and morphometric analysis using a Leica DMR light microscope interfaced with a computer furnished with Leica LAS imaging software. The samples collected at 10.00 and 14.00 h were inadvertently lost during histological processing. Epithelial thickness in each tubule was determined using the modelling approach as described by Lešer et al. [29].
Some unfixed tubules from randomly chosen individual woodlice were embedded within proprietary cryo-moulds in Optimal Cutting Temperature compound (OCT; Agar Scientific UK), frozen in liquid N2, and sectioned at 10 µm thickness in a Bright OFT5000 cryostat (chamber temperature of −20°C) in OCT-filled cryo-moulds, for laser confocal imaging. These cryostat sections were stained for DNA with DAPI (Ex and Em maxima = 358 nm and 461 nm, respectively; scanned using 495 nm laser line) and actin with Alexa Fluor® 488 nm phalloidin (Ex and Em maxima = 495 nm and 519 nm, respectively; scanned using 488 nm laser line). Cuprosomes were imaged in reflectance mode (488 nm, with a 10 nm detection band).
2.3. µ-Focus XAS in situ measurements in thin sections
In this experiment, woodlice were sampled from a standard laboratory culture in a controlled environment room (20°C, 75% humidity) under a 12 L : 12 D regime (light on at 06.00, light off at 18.00). Hepatopancreas samples for microfocus analyses were dissected and immediately processed from woodlice collected at 12.00 and 02.00 h (i.e. 6 h into the light and dark phases, respectively). These temporal ‘nodes' were initially chosen because they corresponded approximately to the mid-extrusion and mid-restitution phases of the diurnal apocrine cycle within the hepatopancreas as described by Hames & Hopkin [36]. The preparative procedure used was compared in a previous microfocus study on earthworms [38] with cryo-sectioning of unfixed fresh tissues, and was deemed to maintain faithfully both the morphological and compositional fidelity of tissues and cells to degrees permitting meaningful microfocus imaging, mapping and analysis. It involved gentle fixation for approximately 3 days in 70% alcohol of one or more tubules from individual woodlice, followed by glycol methacrylate embedding and transverse sectioning in the range of 2–10 µm. Sections were mounted on 25 × 50 mm spectroscopic-quality Spectrosil 2000® or fused quartz Vitreosil 077® glass slides (UQG Optics Ltd., Milton, Cambridge). Slides were inserted into the standard Diamond I18 beamline sample holder, orientated and imaged under brightfield illumination, then subjected to metal mapping and µ-focus spectroscopy, with different acquisition times and levels of spatial resolution, almost exclusively at ambient temperature.
XAS data were collected on beamline I18 at Diamond Light Source using a Si(111) double crystal monochromator, and the Kirkpatrick-Baez focusing mirrors, which provide a 3 µm spot size, were also used to remove harmonic contamination [39]. Calibration spectra for Cu, Fe and Zn foils were recorded in transmission mode. Data for the samples were collected in fluorescence mode using an Ortec (Oakridge, USA) 9-element Ge detector. Elemental distribution maps for Cu, Fe and Zn were acquired and processed essentially as described previously for Pb and Zn in sectioned earthworm tissues [40]; these were used to determine the areas to collect the XAS spectra. The XAS data were reduced in the program Athena [41], X-Ray Absorption Near Edge Structure (XANES) data were modelled as linear combinations of the XANES spectra of selected standards, collected previously and energy corrected using the calibration spectra [42]. The Extended X-ray Absorption Fine Structure (EXAFS) data were analysed using exact curved wave theory [43] in DL-Excurv [44]. Phaseshifts were derived in the program from ab initio calculations using Hedin–Lundqvist potentials and von Barth ground states [45]. The data were fitted for each sample by defining a theoretical model and comparing the calculated EXAFS spectrum with the experimental data. Shells of backscatterers were added around the absorber atom and by refining an energy correction Ef (the Fermi energy), the absorber–scatterer distance and the Debye–Waller factor for each shell, a least-squares residual (the R-factor [46]) was minimized. For fits with two shells, a reduced χ2-statistical test was used to check that inclusion of the additional fitting parameters was justified.
The stability under beam irradiation of the Cu, Fe and Zn signals was evaluated by collecting a series of consecutive XANES spectra under standard operational conditions from selected locations in S and B cells in the resin-impregnated tissue sections.
Some µXRF maps for P K-edge (2014 eV) and S K-edge (2308 eV) were acquired using a four element Si drift detector with a beryllium window (Hitachi Inc.) positioned close to the specimen. The relatively strong Ar K-edge (3.203 eV) signal from ambient air interferes with the P and S emissions; it was reduced but not eliminated by enclosing the specimen and detector inside a bespoke bag under flowing (300–400 ml min−1) He to give a largely He environment during analysis. No µXANES scans were collected at either the P or S K-edge. µXRF maps for these two anionic elements were used qualitatively to determine their co-distributions with the transition metals of interest.
3. Results
3.1. Elemental composition of whole hepatopancreas
There were no significant differences in the Cu, Fe, Zn and P concentrations in the hepatopancreas tubules of woodlice sampled at 02.00 and 12.00 h (table 1). Cu was the dominant transition metal with a concentration approximately ×6.5 higher than Fe, and approximately ×2 higher than Zn in these physiologically ‘normal’ samples. The concentrations of each of the Group 2 elements analysed (Mg, Ca, Sr, Ba) tended to be higher during the day (12.00 h) compared with the night (02.00 h); interestingly, metabolically essential Mg and Ca are recognized as predominantly extracellular in distribution. The concentration of K, a predominantly intracellular electrolyte, did not differ at the two time points.
Table 1.
Elemental concentrations (µg/g dry weight) in pooled samples of hepatopancreas from O. asellus sampled from a reference site (Pontcanna) at two key time points. Data are presented as mean ± s.e. (n = 5 in each case).
| treatment | Cu | Fe | Zn | P | Na | K | Mg | Ca | Sr | Ba |
|---|---|---|---|---|---|---|---|---|---|---|
| 02.00 h | 4948 ± 679 | 765 ± 86 | 2259 ± 516 | 1902 ± 152 | 12 108 ± 940 | 14 071 ± 951 | 2644 ± 176 | 4605 ± 959 | 114 ± 10 | 285 ± 20 |
| 12.00 h | 4825 ± 405 | 711 ± 118 | 2679 ± 377 | 2091 ± 58 | 15 736 ± 1694 | 13 929 ± 810 | 2713 ± 323 | 5706 ± 939 | 140 ± 18 | 536 ± 138 |
3.2. Hepatopancreas morphometry
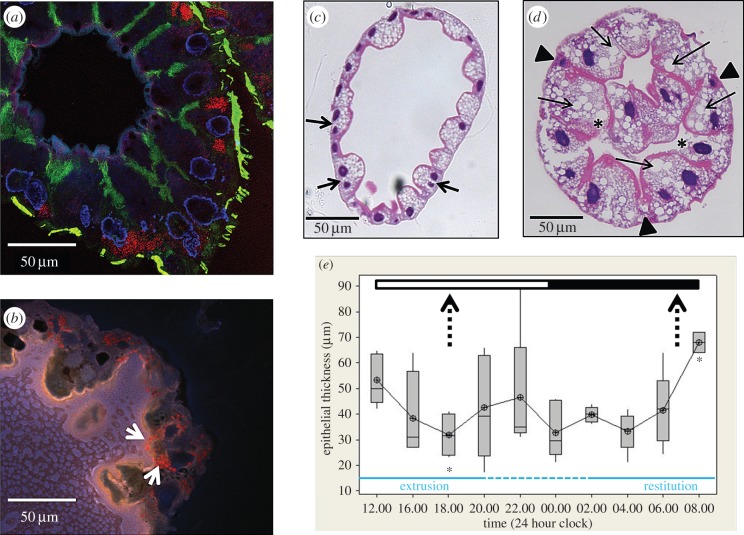
Epithelial thickness in the woodlouse hepatopancreas essentially reflects the height of the B cells protruding into the tubule lumen (figure 1a,b). Morphometric analysis at 2-hourly intervals provided evidence of a diurnal pattern of extrusion/restitution change in epithelial thickness (Kruskal–Wallis, p < 0.05) in woodlice acclimated to the experimental light regime (figure 1c–e). From the middle of the dark period (04.00 h), the mean epithelial thickness increased from its nadir of 33.2–68.0 µm at the end of the dark period (08.00 h). The B cells subsequently appeared to be more-or-less fully charged from around the night/day transition, rising to a peak at midday (12.00 h), from which point the thickness parameter fluctuated (reflecting considerable B-cell asynchrony, and inter-individual variability) but, nevertheless, tended to decline until the cytoplasmic restitution was initiated at night. Direct measurements of B-cell height confirmed this cyclical diurnal pattern (data not shown). A reversed light regime experiment (i.e. switching O. asellus from light : dark to dark : light over a four-week acclimation period) provided further evidence of rhythmicity; a distinct, albeit incomplete, shift in the pattern of cell morphology was observed with the extruded cells firmly confined to the light period and restitution peaking in the dark period (electronic supplementary material, figure S1).
Figure 1.
Morphology and morphometry of the hepatopancreas of O. asellus. (a) Confocal image of an unfixed, cryostat-sectioned hepatopancreas tubule immunofluorescently stained to illustrate general cell architecture. Note that nuclei are stained blue (DAPI) and actin filaments green (Alexa Fluor® 488 nm phalloidin). Cuprosomes (red) in the ‘S' cells were imaged in reflectance mode. The tubule was dissected from a woodlouse near the peak of its restitution phase. (b) Confocal image of part of an unstained cryostat section taken from alongside the section depicted in 1(a) showing autofluorescence only; no fluorescent markers were introduced. Punctate red staining within the cytoplasm of a B cell (white arrows) represents autofluorescent lipid-containing droplets (note that the lumen is the lighter, left-hand side of the image). This fluorescence had an unusually long Stokes shift, being excited by the UV laser and emitting in the red part of the spectrum. (c) Light micrograph of a transverse H&E-stained section of a tubule near the nadir of the extrusion phase; note the variability in the shapes of the binucelate B cells (arrows), but with all containing small lipid inclusions. (d) Light micrograph of a transverse H&E-stained section of a tubule near the climax of the restitution phase where the apical cytoplasm of the B cells is engorged with large lipid inclusions (arrows); note the B cells (asterisks) with disrupted apical membranes that are apparently undergoing apocrine secretion, and the S cells (arrowheads). (e) Box-plot of the modelled epithelial thickness of the hepatopancreas of acclimated woodlice measured (n = 6) at regular intervals during a 24 h period; the dark and light phases are depicted at the top, and the observed extrusion and restitution phases depicted at the bottom (with the ‘intermediate’ region where hepatopancreas morphology was variable indicated by a broken line); the broken vertical arrows pinpoint the equivalent physiological periods identified by Hames & Hopkin [36] where restitution bottoms out (left) and extrusion climaxes (right); the asterisks indicate that the two points in our morphometric dataset nearest the Hames and Hopkin physiological transition regions are significantly different (Mann–Whitney, p < 0.05).
3.3. µXAS in situ measurements: Cu, Fe and Zn K-edges in thin sections
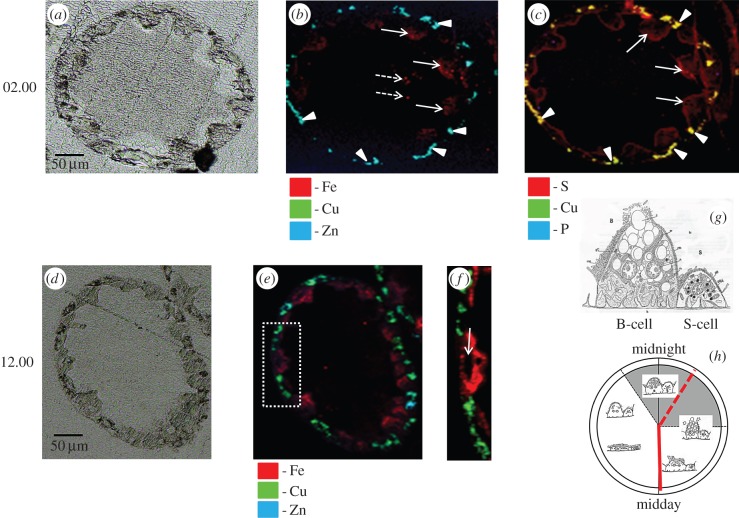
The µXRF maps more so than the corresponding unstained sections demonstrate that, in a given transverse optical plane, there is a fundamental symmetry in the arrangement of the two epithelial cells in the hepatopancreas, with each B cell flanked by two S cells (figure 2; electronic supplementary material, figures S2 and S3). µXRF maps indicate that Cu is concentrated as focal intracellular deposits in the basal cytoplasm of S cells in hepatopancreas tubules sampled at both 02.00 and 12.00 h (figure 2b,e,f; electronic supplementary material, figures S2b, S2c and S3). By contrast, Fe displayed a dispersed distribution pattern within B cells at both time intervals, but with an apparent bias towards the apical cytoplasm near the interval (02.00 h) when extrusion approaches completion and switches to restitution (figure 2b,e,f; electronic supplementary material, figures S2b, S2c and S3). Some images and µXRF maps (especially figure 2b; electronic supplementary material, figures S3a, S3b) provide evidence for the formation of large apical blebs in a number of B cells, with traces of diffuse material of apparently similar composition free in the lumen (figure 2b; electronic supplementary material, figure S3b). Cu was co-distributed with S, while Fe was co-distributed with P (cf. figure 2b,c). Zn was almost exclusively associated with Cu within the S cells of O. asellus hepatopancreas (figure 2b,e,f; electronic supplementary material, figures S2b, S2c and S3). Although the spatial resolution of the images obtained from the synchrotron is limited, some µXRF maps (e.g. electronic supplementary material, figure S2c) give the impression that the Cu-rich cytoplasm of S cells extends under the basal regions of the neighbouring B cells, indicating a close morphological intimacy between the two cell types.
Figure 2.
µXRF maps of element distributions in unstained methacrylate-embedded thin mid-tubule sections of woodlouse hepatopancreas. (a) Light micrograph of a transverse section from a woodlouse sampled at 02.00 h (i.e. the beginning of B-cell restitution during darkness). Note that the morphology of the sections used for µXRF is relatively unclear due to a lack of differential contrast in unstained, methacrylate-embedded sections. (b) Superimposed Cu, Fe and Zn µXRF maps of the section depicted in (a); note the co-distribution of Cu and Zn in S cells (arrowheads), and the distribution of diffuse Fe mainly in B-cell apical cytoplasm that might be undergoing blebbing (arrows), and some Fe signal within the tubule lumen (broken arrows). (c) Superimposed Cu, P and S µXRF maps of the section depicted in (a); note the co-distribution (yellow) of Cu and S in S cells (arrowheads), and the mainly apical distribution of P in B cells (arrows). (d) Light micrograph of a mid-tubule transverse section from a woodlouse at 12.00 h (i.e. at the beginning of B-cell extrusion during the day). (e) Superimposed Cu, Fe and Zn µXRF maps of the section depicted in (d); note that the transition metal distribution patterns are similar to those seen in (b). (f) Expanded view µXRF maps for the region delineated by a broken-lined rectangle in (e); note that Fe is distributed above and below the nuclear plane (arrow) of the prominent B cell, albeit mainly in the apical cytoplasm. (g) and (h) are schematic diagrams derived from Hames & Hopkin [36], illustrating the gross difference between B- and S-cell morphologies (g) and showing a ‘clock’ summarizing the diurnal cycle of apocrine secretion in B cells in relation to the light : dark regime with our two XAS sampling points superimposed upon it (h).
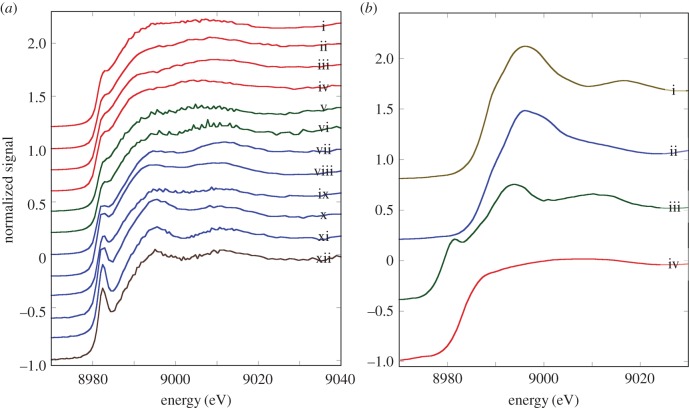
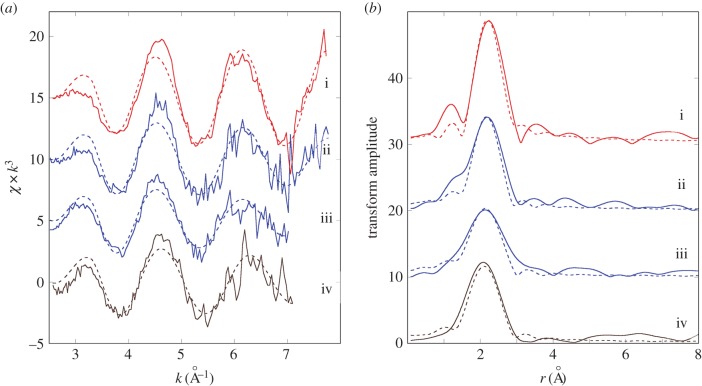
The Cu K-edge XANES spectra exhibit three main features: a peak (or shoulder) on the absorption edge at 8982.5 eV, the edge crest at 8995 eV and a peak at 9011 eV (figure 3a). For the XANES spectra of the model compounds, only Cu2O shows the first peak (figure 3b), and its height in the spectra derived from methacrylate-embedded sections of woodlouse hepatopancreas correlates with the contribution from Cu2O in the XANES fitting (table 2). Moreover, the Cu edge values (8980 and 8981 eV) determined for spectra collected from S cells correspond well with literature values obtained for the maximum of the first derivative of XANES from a number of Cu(I) compounds (ranging from 8980.9 to 8983.1 eV) compared with Cu(II) compounds (8984.4 to 8988.0 eV) (electronic supplementary material, table S1). In the majority of cases, B-cell spectra displayed a higher contribution from the characteristic Cu(I) peak than did the spectra derived from S cells, perhaps suggesting that the B cells contain mixed Cu species albeit with a dominant S-bound phase. Calculated Cu K-edge values from B cells (8980.9 and 8981.0 eV) confirm the presence of reduced Cu(I) species in this cell type (electronic supplementary material, table S1). Both the XANES fitting (table 2) and the EXAFS fitting for four relatively noise-free spectra (figure 4a,b and table 3) showed that Cu, probably in its reduced Cu+ state, is mainly coordinated to S-donating ligands, with no indication of any outer shells. EXAFS indicated that there was no significant difference between the fit for an S cell at the time (02.00 h) roughly corresponding to the extrusion/restitution cross-over and the fits for B cells at the same time interval and near the restitution peak (12.00 h) (table 3). The data were not good enough to justify fitting the inner coordination sphere with a mixture of oxygen and sulfur scatterers.
Figure 3.
Comparative analysis of copper XANES spectra from S and B cells of the O. asellus hepatopancreas with model compounds. (a) Cu K-edge XANES spectra from: O. asellus S cells at 02.00 h (red; i–iv) and 12.00 h (green; v and vi); O. asellus B cells at 02.00 h (blue; vii–xi) and 12.00 h (brown; xii) clock time (see table 2 for the fit data). (b) Cu K-edge XANES spectra derived from model compounds: Cu(O2CCO2) (brown; i), Cu3(PO4)2 (blue; ii), Cu2O (green; iii) and CuS (red; iv).
Table 2.
K-edge (Cu, Fe) XANES fitting of spectra derived from the two cell types in O. asellus hepatopancreas sampled at 02.00 (un-shaded rows) and 12.00 h (shaded rows).
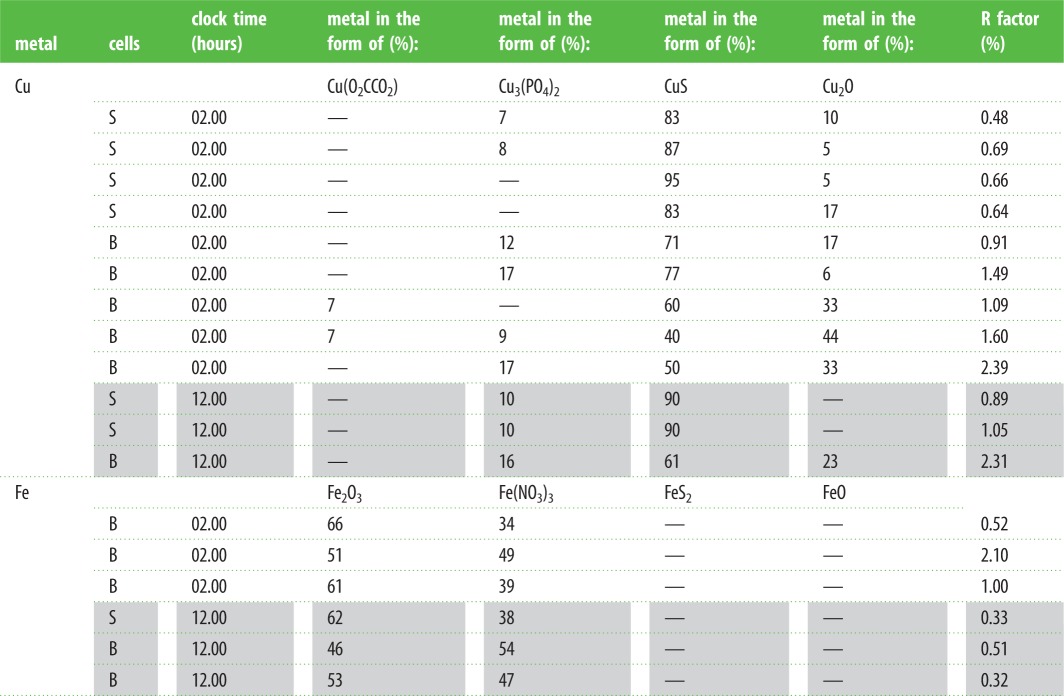 |
Figure 4.
Determination of copper speciation from S and B cells of the O. asellus hepatopancreas. (a) Cu K-edge EXAFS data (solid lines) and fits (broken lines) from: an O. asellus S cell at 02.00 h (red; i); and B cells at 02.00 h (blue; ii and iii) and 12.00 h (brown; iv) (see table 3 for corresponding quantitative data). (b) Fourier transforms of the Cu EXAFS data (solid lines) and fits (broken lines) depicted in figure 4a.
Table 3.
K-edge EXAFS data (Cu, Fe) derived from the two cell types in O. asellus sampled at 02.00 (un-shaded rows) and 12.00 h (shaded rows).
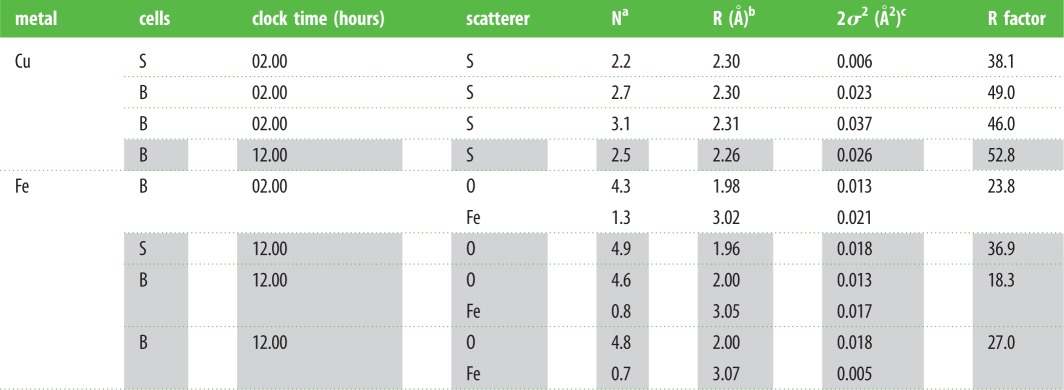 |
aNumber of scatterers ±25%.
bAbsorber–scatterer distance ±0.02 Å.
cDebye–Waller-type factor ±25%.
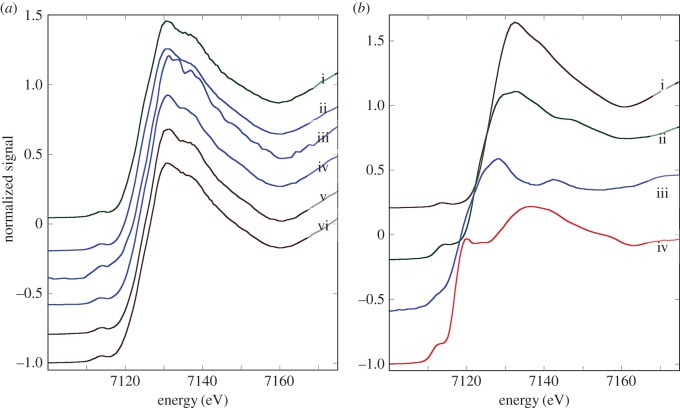
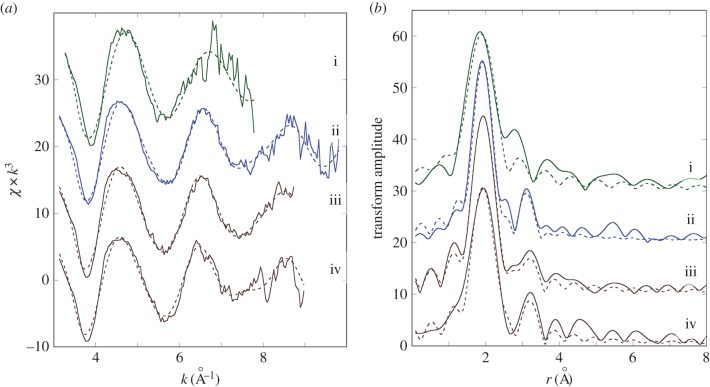
The Fe K-edge XANES spectra were all very similar, with a pre-edge feature (1s-3d) at 7117 eV, the edge crest at 7131 eV and a peak at 7137 eV (figure 5a). The Fe XANES spectra from model compounds (figure 5b) most strongly corresponding to those from hepatopancreas thin sections were acquired from octahedrally oxygen-bound Fe3+ models, Fe2O3 and Fe(NO3)3 (cf. figure 5a,b). The XANES fitting (table 2) showed predominantly oxygen coordination for Fe, which was confirmed by EXAFS fitting (table 3 and figure 6a,b). The Fe–O bond length of approximately 2 Å is consistent with mainly six-coordinate Fe3+. An outer shell of Fe scatterers at approximately 3.05 Å could be fitted for the three EXAFS spectra derived from B cells (one at 02.00 h and two at 12.00 h), possibly implying the presence of an iron oxyhydroxide phase. The short usable data range of the single S-cell spectrum (12.00 h) prevented any outer shell fitting for this sample. There were no significant observable differences in Fe ligand-speciation binding between S and B cells, either in the XANES (table 2) or the EXAFS (table 3) datasets.
Figure 5.
Comparative analysis of iron XANES spectra from S and B cells of the O. asellus hepatopancreas with model compounds. (a) Fe K-edge XANES spectra from: an O. asellus S cell at 12.00 h (green; i); and B cells at 02.00 h (blue; ii–iv) and 12.00 h (brown; v and vi) (see table 2 for the fit data). (b) Fe K-edge XANES spectra derived from model compounds: Fe(NO3)3 (brown; i), Fe2O3 (green; ii), FeO (blue; iii) and FeS2 (red; iv).
Figure 6.
Determination of iron speciation from S and B cells of the O. asellus hepatopancreas. (a) Fe K-edge EXAFS data (solid lines) and fits (broken lines) from: an O. asellus S cell at 12.00 h (green; i), and B cells at 02.00 h (blue; ii) and 12.00 h (brown; iii and iv) (see table 3 for corresponding quantitative data). (b) Fourier transforms of the Fe EXAFS data (solid lines) and fits (broken lines) depicted in figure 6a.
XANES and EXAFS spectra (data not shown) indicated that Zn is predominantly bound by O-donating ligands, with a relatively minor S-bound phase. This implies that while Zn is distinctly co-distributed with Cu within S cells (figure 2b,e,f; electronic supplementary material, figures S2b, S2c and S3), the cell may sequester redox-inactive Zn in two major pools. The electronic supplementary material, figure S2c provides spatial evidence that there is a shared Cu + Zn compartment, as well as separate Cu-only and Zn-only compartments in individual S cells. (The issue of Zn speciation under physiological and hyper-accumulation conditions is the subject of a separate detailed XAS study [47].)
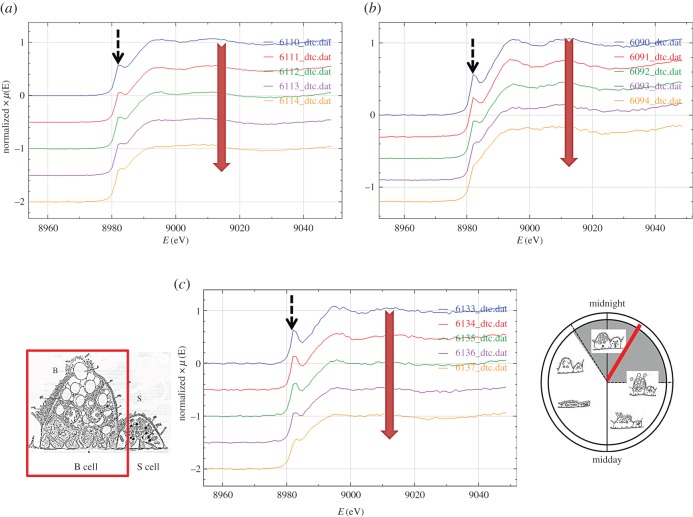
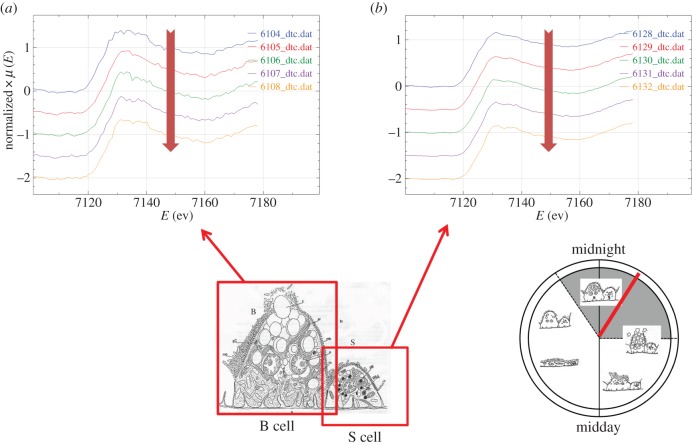
Sequential analyses of a given spot on randomly selected hepatopancreas sections yielded some indication that the Cu XANES signal derived from B cells was initially stable under irradiation, but then showed some progressive erosion of the shoulder on the absorption edge at 8982.5 eV from the third spectrum onwards (figure 7a–c). Flattening after three or more acquisition scans of the Cu XANES signal derived from S cells was more subtle, possibly because the edge feature at 8982.5 eV was less pronounced (electronic supplementary material, figure S4a–c). Fe XANES spectra from both cell types were stable under repeated irradiation (figure 8a,b). Zn XANES spectra derived from S cells revealed some evidence of radiation-induced change in later scans (electronic supplementary material, figures S5a and S5b). Overall, these qualitative observations provide confidence in the biological veracity of the acquired qualitative and quantitative XAS data.
Figure 7.
Radiation sensitivity of Cu speciation assessed by collecting a sequential series of five XANES spectra from given regions in three different B cells (a–c). The thin methacrylate-embedded sections were obtained from a woodlouse sampled at 02.00 h. In each panel, the large down-pointing vertical arrow indicates that the top spectrum was collected first and the lowest spectrum last. Note that the shoulder on the absorption edge at 8982.5 eV (broken arrows), while remaining visible, is progressively eroded from the third acquired spectrum onwards.
Figure 8.
Radiation sensitivity of Fe speciation assessed by collecting a sequential series of five XANES spectra from given regions in a B cell (a) and in an S cell (b). The thin methacrylate-embedded sections were obtained from a woodlouse sampled at 02.00 h. In both panels, the large down-pointing vertical arrow indicates that the top spectrum was collected first and the lowest spectrum last. Note that successive spectra remain very similar.
4. Discussion
Hames & Hopkin [36] qualitatively examined the fine structure of the S and B cells of two terrestrial isopod species (O. asellus and P. scaber) at hourly intervals over a 24 h period, and concluded that while the morphology of the S cells remained unchanged, B-cell morphology displayed the hallmarks of a diurnal pattern of apocrine secretion. By contrast, Lešer et al. [29] morphometrically examined the hepatopancreatic epithelium of P. scaber at four time points during a 24 h period and observed that neither epithelium thickness nor lipid droplet abundance differed significantly, although lipid droplets were concentrated conspicuously in B-cell apical cytoplasm 2 h into the light phase. Our findings on O. asellus, using the morphometric method described by Lešer et al. [29], were in general agreement with those of Hames & Hopkin [36]. Indeed, we also found that a cyclical apocrine pattern was evident, albeit less pronounced, in woodlice exposed to a reversed lighting regime for four weeks (electronic supplementary material, figure S1). It is difficult to reconcile the disparities relating to the presence or the absence of a B-cell apocrine cycle linked to a diurnal trophic pattern, but it is germane that according to Lešer et al. [29] the properties of the hepatopancreas epithelium are altered progressively after transference from favourable field conditions to laboratory culture where, for example, the diet is typically less heterogeneous. Other potential confounding factors are weak synchronicity in the B-cell population at certain time points, as well as a relatively high degree of inter-individual variation apparent in our morphometry dataset that probably reflects asynchronous feeding patterns. In any debate about the existence and pattern of apocrine secretion in isopod B cells, it is not inconsequential that these cells are binucleate. ‘Normal’ binucleate cells that are involved in forms of apocrine secretion are fairly common in insect taxa [48] where, according to Anhe & Azeredo-Oliveira [49], the additional genetic material is essential to drive cell restitution after the extensive secretory phase. Also pertinent is that a daily cycle of changes in haemolymph osmolality, ammonia and glucose levels linked to nocturnal feeding has been recorded in a semi-terrestrial isopod [50]. Moreover, Nakamura & Wright [51] recently described a diurnal cycle of glutamine storage and ammonia excretion in fully terrestrial isopods, probably associated with cyclical absorption and subsequent catabolism of dietary proteins.
In this study, whole hepatopancreas analyses, and in situ Cu and Fe K-edge µXAS analyses, did not reveal any striking temporal differences in metal content or ligand-binding speciation at the two selected time points (i.e. 6 h into the light and dark phases, respectively). Given the variations in cell morphology alluded to above, and the replication constraints imposed by the intrinsically low throughput of XAS micro-beam analysis, this may not be surprising.
Wieser [27] remarked that the woodlouse S cell is so densely packed with Cu-rich vesicles that it is difficult to envisage these small cells having the capacity to do anything other than sequester and store Cu. If we assume that the bulk of hepatopancreatic Cu resides in S cells, and that the estimated average volume fraction of these cells including the nucleus during the daily cycle is 20%, then extrapolating from tubule content of 5000 µgCu g−1 dry weight indicates that Cu represents approximately 2.5% (i.e. 25 000 µgCu g−1) of S-cell dry mass. To put this estimated value into a broader physiological context, liver and kidney with maximum values of approximately 60 µg g−1 dry weight are the most Cu-rich mammalian organs [52]. The stated theoretical Cu requirement of 44 µgCu ml−1 for haemocyanin in marine decapod crustaceans [53] implies that the hepatopancratic Cu reserves of terrestrial isopods, even if their physiological availability is only partial, probably exceed direct respiratory demands by orders of magnitude. But, in addition to acting as a respiratory pigment, haemocyanin in P. scaber can be activated to perform a role as a phenoloxidase [54]. Phenoloxidases facilitate the sclerotization of post-moult proteins and serve as key components of the primary immune cascade in arthropods [24]. They are also important in alimentary physiology; of direct relevance to this study, phenoloxidases have been shown to degrade phenolics and lignocelluloses in the isopod hindgut [21,55]. Because it has been postulated that only a fraction of phenoloxidase activity in woodlouse hindgut is attributable to gut flora [56], it is plausible that the hepatopancreas epithelia are another potential source of the Cu-containing enzyme. At the present time, the definitive molecular nature of the dominant Cu storage fractions in woodlouse hepatopancreas is not known. While not excluding the possibility that thiol-rich MTs may be involved in Cu storage, Donker et al. [34] favoured a role for haemocyanin and/or its metabolites. Since crystallographic study [57] shows that arthropod prophenoloxidase has the ‘canonical’ three di-nuclear Cu centre, with each Cu ion coordinated to non-thiol histidine, our µXANES and µEXAFS observations tend to suggest the involvement of Cu sequestering roles for MT-like peptides [58] in isopod S cells. It is pertinent that Engel & Brouwer [59] presented evidence that Cu-MT in a marine crustacean can transfer Cu to the active site of apohaemocyanin. Hopkin [60] stated unequivocally that wholesale voiding of cuprosomes from S cells into the lumen does not occur. The previously unsuspected detection of Cu in the apocrine B cells might lend credence to the hypothesis that the hepatopancreas exports Cu-containing molecules into the hepatopancreas lumen via this cell type, although our microfocus findings did not implicate a type 3 Cu protein.
Iron is the transition metal ion with the greatest variety of binding sites in proteins [58]. However, hardly any attention has previously been devoted to the coordination chemistry or functional aspects of Fe in woodlouse hepatopancreas. We detected Fe in both epithelial cell types, where its redox state and coordination chemistry was very different to that of Cu; Fe was always found as Fe3+ with predominantly O-coordination. To the extent that the hepatopancreas is a distinctly oxic environment [61], the Fe3+ oxidation state was not unexpected. The notion that Fe is regularly released along with lipid droplets from B cells into the alimentary lumen appears well-founded [36], whether a well-defined diurnal cycle of apocrine secretion occurs or not. Leaf litter rich in recalcitrant lignocelluloses is ingested by terrestrial woodlice and is ultimately digested by enzymes derived from litter-colonizing microflora and by endosymbionts [56] as well as from truly endogenous sources. Elegant work on wood-decaying fungi [62,63] shows that polysaccharide depolymerization by oxyradicals generated via Fenton-type reactions, involving Fe2+ and Fe3+ as well as Cu2+, is an important prelude facilitating access of enzymes to the dietary substrates. The micro-oxic/anoxic conditions prevailing in the radial centre of the posterior hindgut of woodlice [61] provide the reducing environment conducive to these reactions. However, the digestibility of cellulose is suppressed by Fe3+-mediated oxidation and cellulases can be inhibited by Fe3+ [64,65] but, again, reducing conditions in proximity to alimentary sites of lignocellulose digestion to monomeric products would promote enzyme activities. Polyphenols (tannins) ingested in large quantities by woodlice can not only potentially inhibit digestive enzyme activity by precipitation [66], but can also scavenge oxyradicals and block Fenton reactions by binding Fe2+ and Cu1+ [67,68]. It is known that the gut fluids of marine [69] and terrestrial isopods are rich in surfactants [70]. Surfactants are diverse in composition and sources, but they are often lipid derivatives [71]. Apart from facilitating the transport of hydrophobic digested lipids towards absorptive gut surfaces [72], they are known to counteract protein binding by polyphenols and, thus, can liberate the activities of phenoloxidases, catalases and other gut enzymes [70]. It is an intriguing possibility that lipid droplets regularly secreted by hepatopancreas B cells in harmony with the trophic cycle provide a continuous source of surfactant substrate and contribute, along with metallo-compound secretions, towards the efficient digestion of recalcitrant dietary macromolecules.
In conclusion, the findings of this study contribute to the general notion that alimentary function in woodlice such as O. asellus is a multifactorial network of interactions involving secretions from structurally and functionally differentiated regions of the invertebrate's alimentary canal, the activities of regionally specialized members of its microbiome, and ingested biotic and abiotic materials. More specifically, the findings call for a re-appraisal of the relationships between the hepatopancreatic B and S cells. These very specialized epithelial cells have to date been examined by a variety of microscopic and relatively insensitive microprobe analytical methods as if they are free-standing entities. High-resolution µXRF mapping with a high-brightness synchrotron beam suggests otherwise: a sounder hypothesis views them as morphologically integrated functional units. This view is supported by the intimacy of the highly infolded basal membranes of neighbouring cells [36] and the hitherto unsuspected ‘sharing’ of common Cu and Fe ligand-binding species within both cell types. The new paradigm envisages the partners forming these functional units having particular roles, with the S cells serving as dominant metal acquisition/storage hubs, while the B cells are primarily engaged in distribution logistics involving metals, metallo-compounds including pro-enzymes, and lipids. The paradigm should engender the formulation of novel hypotheses that can be tested with the full spectrum of contemporary bio-imaging and ‘omics' tools.
Supplementary Material
Acknowledgements
We thank: Dr Tina Geraki for technical support and advice at I18, Erin Holloway for tissue digestion assistance, Dr Mike Taylor for advice on histology, Lindsey Axe for light microscopy and morphometry support, Mike O'Reilly for providing incubators, and Martyn Kille for fieldwork assistance.
Data accessibility
Raw spectral data associated with figures 2–8 and electronic supplementary material, figures S2–S5 are available from Dryad Digital Repository using the following link: http://dx.doi.org/10.5061/dryad.8734c.
Authors' contributions
P.K. conceived and designed (with A.J.M.) the study; was main operator of the I18 synchrotron beamline; archived and managed the synchrotron datasets; and interpreted (with A.J.M.) the observations. A.J.M. wrote the first draft of the manuscript; supervised the fieldwork and morphometry; did the tissue dissections and cryo-microtomy; and assisted the operation of the synchrotron. K.A.P. supported confocal imaging, morphometry and tissue-processing for synchrotron analyses; and contributed to the writing and editing of final drafts of the manuscript. J.F.W.M. was I18 beamline manager; contributed to data interpretation and to the use of synchrotron standards/controls; and contributed to and edited the manuscript. D.H. performed the morphometry (under A.J.M.'s supervision). P.G. processed methacrylate-embedded sections for microfocus X-ray analyses. A.H. supported confocal microscopy imaging. D.S. produced stained histological sections for morphometry. I.M. performed the ICP element analyses on digested bulk tissues. J.M.C. performed the mathematical analyses of XANES and EXAFS data derived from I18; and contributed to and edited the manuscript.
Competing interests
We declare we have no competing interests.
Funding
Synchrotron work was supported by two Beamtime Awards (SP7837-1 and SP7837-2), Diamond Light Source Ltd. to P.K. and A.J.M. The study was facilitated by the award (to P.K. and A.J.M.) of a NanoFATE Collaborative Project (CP-FP 247739; 2010–2014) under the 7th Framework Programme of the European Commission (FP7-NMP-ENV-2009, Theme 4), that also supported K.A.P. P.K. and A.J.M. would like to thank Cardiff University for facilities and support of D.H., A.H., I.M. and D.S. Diamond Light Source Ltd., Harwell Science and Innovation Campus provided facilities and support of J.F.W.M. P.G. was supported by Smith & Nephew, York, and J.M.C. by the University of Manchester.
References
- 1.Dupont CL, Butcher A, Valas RE, Bourne PE, Caetano-Anolles G. 2010. History of biological metal utilization inferred through phylogenomic analysis of protein structures. Proc. Natl Acad. Sci. USA. 107, 10 567–10 572. (doi:10.1073/pnas.0912491107) [DOI] [PMC free article] [PubMed] [Google Scholar]
- 2.James SA, de Jonge MD, Howard DL, Bush AI, Paterson D, McColl G. 2013. Direct in vivo imaging of essential bioinorganics in Caenorhabditis elegans. Metallomics 5, 627–635. (doi:10.1039/c3mt00010a) [DOI] [PubMed] [Google Scholar]
- 3.Yamasaki S, et al. 2007. Zinc is a novel intracellular second messenger. J. Cell Biol. 177, 637–645. (doi:10.1083/jcb.200702081) [DOI] [PMC free article] [PubMed] [Google Scholar]
- 4.Evstatiev R, Gasche C. 2012. Iron sensing and signalling. Gut 61, 933–952. (doi:10.1136/gut.2010.214312) [DOI] [PubMed] [Google Scholar]
- 5.Robinson NJ, Winge DR. 2010. Copper metallochaperones. Annu. Rev. Biochem. 79, 537–562. (doi:10.1146/annurev-biochem-030409-143539) [DOI] [PMC free article] [PubMed] [Google Scholar]
- 6.Nevo Y, Nelson N. 2006. The NRAMP family of metal-ion transporters. Biochim. Biophys. Acta Mol. Cell Res. 1763, 609–620. (doi:10.1016/j.bbamcr.2006.05.007) [DOI] [PubMed] [Google Scholar]
- 7.Waldron KJ, Rutherford JC, Ford D, Robinson NJ. 2009. Metalloproteins and metal sensing. Nature 460, 823–830. (doi:10.1038/nature08300) [DOI] [PubMed] [Google Scholar]
- 8.Nevitt T, Ohrvik H, Thiele DJ. 2012. Charting the travels of copper in eukaryotes from yeast to mammals. Biochim. Biophys. Acta Mol. Cell Res. 1823, 1580–1593. (doi:10.1016/j.bbamcr.2012.02.011) [DOI] [PMC free article] [PubMed] [Google Scholar]
- 9.Pithadia AS, Lim MH. 2012. Metal-associated amyloid-beta species in Alzheimer's disease. Curr. Opin. Chem. Biol. 16, 67–73. (doi:10.1016/j.cbpa.2012.01.016) [DOI] [PubMed] [Google Scholar]
- 10.Ala A, Walker AP, Ashkan K, Dooley JS, Schilsky ML. 2007. Wilson's disease. Lancet 369, 397–408. (doi:10.1016/S0140-6736(07)60196-2) [DOI] [PubMed] [Google Scholar]
- 11.Dean KM, Qin Y, Palmer AE. 2012. Visualizing metal ions in cells: an overview of analytical techniques, approaches, and probes. Biochim. Biophys. Acta. 1823, 1406–1415. (doi:10.1016/j.bbamcr.2012.04.001) [DOI] [PMC free article] [PubMed] [Google Scholar]
- 12.Korbas M, Blechinger SR, Krone PH, Pickering IJ, George GN. 2008. Localizing organomercury uptake and accumulation in zebrafish larvae at the tissue and cellular level. Proc. Natl Acad. Sci. USA. 105, 12 108–12 112. (doi:10.1073/pnas.0803147105) [DOI] [PMC free article] [PubMed] [Google Scholar]
- 13.Penner-Hahn JE. 2013. Technologies for detecting metals in single cells. Metallomics and the cell: metal ions in life sciences, vol. 12 Dordrecht, The Netherlands: Springer. [DOI] [PubMed] [Google Scholar]
- 14.Qin Z, Caruso JA, Lai B, Matusch A, Becker JS. 2011. Trace metal imaging with high spatial resolution: applications in biomedicine. Metallomics. 3, 28–37. (doi:10.1039/C0MT00048E) [DOI] [PubMed] [Google Scholar]
- 15.Vogt S, Ralle M. 2013. Opportunities in multidimensional trace metal imaging: taking copper-associated disease research to the next level. Anal. Bioanal. Chem. 405, 1809–1820. (doi:10.1007/s00216-012-6437-1) [DOI] [PMC free article] [PubMed] [Google Scholar]
- 16.Ortega R, Deves G, Carmona A. 2009. Bio-metals imaging and speciation in cells using proton and synchrotron radiation X-ray microspectroscopy. J. R. Soc. Interface 6, S649–S658. (doi:10.1098/rsif.2009.0166.focus) [DOI] [PMC free article] [PubMed] [Google Scholar]
- 17.Jo WJ, Loguinov A, Chang M, Wintz H, Nislow C, Arkin AP, Giaever G, Vulpe CD. 2008. Identification of genes involved in the toxic response of Saccharomyces cerevisiae against iron and copper overload by parallel analysis of deletion mutants. Toxicol. Sci. 101, 140–151. (doi:10.1093/toxsci/kfm226) [DOI] [PubMed] [Google Scholar]
- 18.Rustici G, van Bakel H, Lackner DH, Holstege FC, Wijmenga C, Bahler J, Brazma A. 2007. Global transcriptional responses of fission and budding yeast to changes in copper and iron levels: a comparative study. Genome Biol. 8, R73 (doi:10.1186/gb-2007-8-5-r73) [DOI] [PMC free article] [PubMed] [Google Scholar]
- 19.De Freitas J, Wintz H, Kim JH, Poynton H, Fox T, Vulpe C. 2003. Yeast, a model organism for iron and copper metabolism studies. Biometals 16, 185–197. (doi:10.1023/A:1020771000746) [DOI] [PubMed] [Google Scholar]
- 20.Hornung E. 2011. Evolutionary adaptation of oniscidean isopods to terrestrial life: structure, physiology and behavior. Terr. Arthropod Rev. 4, 95–130. (doi:10.1163/187498311X576262) [Google Scholar]
- 21.Zimmer M. 2002. Nutrition in terrestrial isopods (Isopoda: Oniscidea): an evolutionary-ecological approach. Biol. Rev. 77, 455–493. (doi:10.1017/S1464793102005912) [DOI] [PubMed] [Google Scholar]
- 22.Crowther TW, Stanton DW, Thomas SM, A'Bear AD, Hiscox J, Jones TH, Voriskova J, Baldrian P, Boddy L. 2013. Top-down control of soil fungal community composition by a globally distributed keystone consumer. Ecology 94, 2518–2528. (doi:10.1890/13-0197.1) [DOI] [PubMed] [Google Scholar]
- 23.Williams RJP, Rickaby REM. 2012. Evolution‘s destiny. Co-evolving chemistry of the environment and life Cambridge, UK: Royal Society of Chemistry. [Google Scholar]
- 24.Decker H, Schweikardt T, Nillius D, Salzbrunn U, Jaenicke E, Tuczek F. 2007. Similar enzyme activation and catalysis in hemocyanins and tyrosinases. Gene 398, 183–191. (doi:10.1016/j.gene.2007.02.051) [DOI] [PubMed] [Google Scholar]
- 25.Hopkin SP, Martin MH. 1984. Heavy metals in woodlice. Symp. Zool. Soc. Lond. 53, 143–166. [Google Scholar]
- 26.Dallinger R, Wieser W. 1977. Flow of copper through a terrestrial food-chain. 1. Copper and nutrition in isopods. Oecologia 30, 253–264. (doi:10.1007/BF01833632) [DOI] [PubMed] [Google Scholar]
- 27.Wieser W. 1968. Aspects of nutrition and the metabolism of copper in isopods. Am. Zool. 8, 495–506. (doi:10.1093/icb/8.3.495) [DOI] [PubMed] [Google Scholar]
- 28.Hopkin SP, Martin MH. 1982. The distribution of zinc, cadmium, lead and copper within the hepatopancreas of a woodlouse. Tissue Cell 14, 703–715. (doi:10.1016/0040-8166(82)90060-X) [DOI] [PubMed] [Google Scholar]
- 29.Lešer V, Drobne D, Vilhar B, Kladnik A, Znidarsic N, Strus J. 2008. Epithelial thickness and lipid droplets in the hepatopancreas of Porcellio scaber (Crustacea: Isopoda) in different physiological conditions. Zoology (Jena) 111, 419–432. (doi:10.1016/j.zool.2007.10.007) [DOI] [PubMed] [Google Scholar]
- 30.Morgan AJ, Gregory ZDE, Winters C. 1990. Responses of the hepatopancreatic B-cells of a terrestrial isopod, Oniscus asellus, to metals accumulated from a contaminated habitat: a morphometric analysis. Bull. Environ. Contam. Toxicol. 44, 363–368. (doi:10.1007/BF01701216) [DOI] [PubMed] [Google Scholar]
- 31.Tkalec ŽP, et al. 2011. Micro-PIXE study of Ag in digestive glands of a nano-Ag fed arthropod (Porcellio scaber, Isopoda, Crustacea). Nucl. Instrum. Meth. B 269, 2286–2291. (doi:10.1016/j.nimb.2011.02.068) [Google Scholar]
- 32.Hopkin SP. 1990. Species-specific differences in the net assimilation of zinc, cadmium, lead, copper and iron by the terrestrial isopods Oniscus asellus and Porcellio scaber. J. Appl. Ecol. 27, 460–474. (doi:10.2307/2404294) [Google Scholar]
- 33.Weißenburg M, Zimmer M. 2003. Balancing nutritional requirements for copper in the common, woodlouse, Porcellio scaber (Isopoda: Oniscidea). Appl. Soil Ecol. 23, 1–11. (doi:10.1016/S0929-1393(03)00019-2) [Google Scholar]
- 34.Donker MH, Koevoets P, Verkleij JAC, Vanstraalen NM. 1990. Metal-binding compounds in hepatopancreas and hemolymph of Porcellio scaber (Isopoda) from contaminated and reference areas. Comp. Biochem. Phys. C 97, 119–126. (doi:10.1016/0742-8413(90)90181-8) [Google Scholar]
- 35.Žnidaršič N, Tušek-Žnidarič M, Falnoga I, Ščančar J, Štrus J. 2005. Metallothionein-like proteins and zinc-copper interaction in the hindgut of Porcellio scaber (Crustacea: Isopoda) exposed to zinc. Biol. Trace Elem. Res. 106, 253–264. (doi:10.1385/BTER:106:3:253) [DOI] [PubMed] [Google Scholar]
- 36.Hames CAC, Hopkin SP. 1991. A daily cycle of apocrine secretion by the B-cells in the hepatopancreas of terrestrial isopods. Can. J. Zool. 69, 1931–1937. (doi:10.1139/z91-267) [Google Scholar]
- 37.Hu LG, He B, Wang YC, Jiang GB, Sun HZ. 2013. Metallomics in environmental and health related research: current status and perspectives. Chinese Sci. Bull. 58, 169–176. (doi:10.1007/s11434-012-5496-1) [Google Scholar]
- 38.Morgan AJ, Kille P, Bennett A, O'Reilly M, Fisher P, Charnock JM. 2013. Pb and Zn imaging and in situ speciation at the geogenic/biogenic interface in sentinel earthworms using electron microprobe and synchrotron micro-focus X-ray spectroscopy. Environ. Pollut. 173, 68–74. (doi:10.1016/j.envpol.2012.10.001) [DOI] [PubMed] [Google Scholar]
- 39.Mosselmans JF, et al. 2009. I18: the microfocus spectroscopy beamline at the Diamond Light Source. J. Synchrotron Radiat. 16, 818–824. (doi:10.1107/S0909049509032282) [DOI] [PubMed] [Google Scholar]
- 40.Morgan AJ, et al. 2013. In situ metal imaging and Zn ligand-speciation in a soil-dwelling sentinel: complementary electron microprobe and synchrotron microbeam X-ray analyses. Environ. Sci. Technol. 47, 1073–1081. (doi:10.1021/es302633f) [DOI] [PubMed] [Google Scholar]
- 41.Ravel B, Newville M. 2005. ATHENA, ARTEMIS, HEPHAESTUS: data analysis for X-ray absorption spectroscopy using IFEFFIT. J. Synchrotron Radiat. 12, 537–541. (doi:10.1107/S0909049505012719) [DOI] [PubMed] [Google Scholar]
- 42.Salt DE, Prince RC, Baker AJM, Raskin I, Pickering IJ. 1999. Zinc ligands in the metal hyperaccumulator Thlaspi caerulescens as determined using X-ray absorption spectroscopy. Environ. Sci. Technol. 33, 713–717. (doi:10.1021/es980825x) [Google Scholar]
- 43.Gurman SJ, Binsted N, Ross I. 1984. A rapid, exact curved-wave theory for EXAFS calculations. J. Phys. C. Solid State. 17, 143–151. (doi:10.1088/0022-3719/17/1/019) [Google Scholar]
- 44.Tomic S, Searle BG, Wander A, Harrison NM, Dent AJ, Mosselmans JFW. 2005. New Tools for the Analysis of EXAFS: The DL EXCURV Package. Council for the Central Laboratory of the Research Councils Technical. Report No.: DL-TR-2005-001.
- 45.Hedin L, Lundqvist S. 1969. Effects of electron–electron and electron–phonon interactions on the one-electron states of solids. Solid State Phys. 23, 1–181. (doi:10.1016/S0081-1947(08)60615-3) [Google Scholar]
- 46.Binsted N, Strange RW, Hasnain SS. 1992. Constrained and restrained refinement in EXAFS data analysis with curved wave theory. Biochemistry 31, 12 117–12 125. (doi:10.1021/bi00163a021) [DOI] [PubMed] [Google Scholar]
- 47.Morgan AJ, Mosselmans JFW, Charnock JM, Gunning P, McDonald I, Powell K, Kille P. Submitted. ‘Same party, different friends’. Ligand-specific partitioning of essential (Cu, Fe, Zn) and non-essential (Pb) metals within metallo-organelles in two terrestrial isopod species.
- 48.Radhakrishnan P, Marchini D, Taylor PW. 2009. Ultrastructure of male reproductive accessory glands and ejaculatory duct in the Queensland fruit fly, Bactrocera tryoni (Diptera: Tephritidae). Arthropod Struct. Dev. 38, 216–226. (doi:10.1016/j.asd.2008.09.004) [DOI] [PubMed] [Google Scholar]
- 49.Anhe AC, Azeredo-Oliveira MT. 2008. Cytochemical characterization of Triatoma infestans and Panstrongylus megistus salivary gland cells (Hemiptera, Reduviidae, Triatominae). Micron 39, 1126–1133. (doi:10.1016/j.micron.2008.06.003) [DOI] [PubMed] [Google Scholar]
- 50.Carefoot TH, Wright J, Pennings SC, Ziegler A, Zimmer M, Uglow RF, Danford AR, Danko JP. 2000. Hemolymph homeostasis in relation to diel feeding activity and microclimate in the prototypal land isopod Ligia pallasii. Can. J. Zool. 78, 588–595. (doi:10.1139/z99-234) [Google Scholar]
- 51.Nakamura M, Wright JC. 2013. Discontinuous ammonia excretion and glutamine storage in littoral Oniscidea (Crustacea: Isopoda): testing tidal and circadian models. J. Comp. Physiol. B 183, 51–59. (doi:10.1007/s00360-012-0694-3) [DOI] [PubMed] [Google Scholar]
- 52.Linder MC, Wooten L, Cerveza P, Cotton S, Shulze R, Lomeli N. 1998. Copper transport. Am. J. Clin. Nutr. 67, 965S–971S. [DOI] [PubMed] [Google Scholar]
- 53.Depledge MH. 1989. Re-evaluation of metabolic requirements for copper and zinc in decapod crustaceans. Mar. Environ. Res. 27, 115–126. (doi:10.1016/0141-1136(89)90003-2) [Google Scholar]
- 54.Jaenicke E, Fraune S, May S, Irmak P, Augustin R, Meesters C, Decker H, Zimmer M. 2009. Is activated hemocyanin instead of phenoloxidase involved in immune response in woodlice? Dev. Comp. Immunol. 33, 1055–1063. (doi:10.1016/j.dci.2009.05.005) [DOI] [PubMed] [Google Scholar]
- 55.King AJ, Cragg SM, Li Y, Dymond J, Guille MJ, Bowles DJ, Bruce NC, Graham IA, McQueen-Mason SJ. 2010. Molecular insight into lignocellulose digestion by a marine isopod in the absence of gut microbes. Proc. Natl Acad. Sci. USA 107, 5345–5350. (doi:10.1073/pnas.0914228107) [DOI] [PMC free article] [PubMed] [Google Scholar]
- 56.Zimmer M. 1999. The fate and effects of ingested hydrolyzable tannins in Porcellio scaber. J. Chem. Ecol. 25, 611–628. (doi:10.1023/A:1020962105931) [Google Scholar]
- 57.Li Y, Wang Y, Jiang H, Deng J. 2009. Crystal structure of Manduca sexta prophenoloxidase provides insights into the mechanism of type 3 copper enzymes. Proc. Natl Acad. Sci. USA 106, 17 002–17 006. (doi:10.1073/pnas.0906095106) [DOI] [PMC free article] [PubMed] [Google Scholar]
- 58.Andreini C, Bertini I, Rosato A. 2009. Metalloproteomes: a bioinformatic approach. Acc. Chem. Res. 42, 1471–1479. (doi:10.1021/ar900015x) [DOI] [PubMed] [Google Scholar]
- 59.Engel DW, Brouwer M. 1987. Metal regulation and molting in the blue crab, Callinectes sapidus: metallothionein function in metal metabolism. Biol. Bull. 173, 239–251. (doi:10.2307/1541876) [DOI] [PubMed] [Google Scholar]
- 60.Hopkin SP. 1990. Critical concentrations, pathways of detoxification and cellular ecotoxicology of metals in terrestrial arthropods. Funct. Ecol. 4, 321–327. (doi:10.2307/2389593) [Google Scholar]
- 61.Zimmer M, Brune A. 2005. Physiological properties of the gut lumen of terrestrial isopods (Isopoda: Oniscidea): adaptive to digesting lignocellulose? J. Comp. Physiol. B 175, 275–283. (doi:10.1007/s00360-005-0482-4) [DOI] [PubMed] [Google Scholar]
- 62.Martinez D, et al. 2009. Genome, transcriptome, and secretome analysis of wood decay fungus Postia placenta supports unique mechanisms of lignocellulose conversion. Proc. Natl Acad. Sci. USA 106, 1954–1959. (doi:10.1073/pnas.0809575106) [DOI] [PMC free article] [PubMed] [Google Scholar]
- 63.Vanden Wymelenberg A, et al. 2010. Comparative transcriptome and secretome analysis of wood decay fungi Postia placenta and Phanerochaete chrysosporium. Appl. Environ. Microbiol. 76, 3599–3610. (doi:10.1128/AEM.00058-10) [DOI] [PMC free article] [PubMed] [Google Scholar]
- 64.Tejirian A, Xu F. 2010. Inhibition of cellulase-catalyzed lignocellulosic hydrolysis by iron and oxidative metal ions and complexes. Appl. Environ. Microbiol. 76, 7673–7682. (doi:10.1128/AEM.01376-10) [DOI] [PMC free article] [PubMed] [Google Scholar]
- 65.Wang MY, Mu ZM, Wang JL, Hou SL, Han LJ, Dong YM, Xiao L, Xia RR, Fang X. 2013. The identification of and relief from Fe3+ inhibition for both cellulose and cellulase in cellulose saccharification catalyzed by cellulases from Penicillium decumbens. Bioresource Technol. 133, 507–512. (doi:10.1016/j.biortech.2013.01.172) [DOI] [PubMed] [Google Scholar]
- 66.Martin MM, Martin JS. 1984. Surfactants: their role in preventing the precipitation of proteins by tannins in insect guts. Oecologia 61, 342–345. (doi:10.1007/BF00379632) [DOI] [PubMed] [Google Scholar]
- 67.Perron NR, Garcia CR, Pinzon JR, Chaur MN, Brumaghim JL. 2011. Antioxidant and prooxidant effects of polyphenol compounds on copper-mediated DNA damage. J. Inorg. Biochem. 105, 745–753. (doi:10.1016/j.jinorgbio.2011.02.009) [DOI] [PubMed] [Google Scholar]
- 68.Perron NR, Wang HC, DeGuire SN, Jenkins M, Lawson M, Brumaghim JL. 2010. Kinetics of iron oxidation upon polyphenol binding. Dalton Trans. 39, 9982–9987. (doi:10.1039/c0dt00752h) [DOI] [PubMed] [Google Scholar]
- 69.Tugwell S, Branch GM. 1992. Effects of herbivore gut surfactants on kelp polyphenol defenses. Ecology 73, 205–215. (doi:10.2307/1938732) [Google Scholar]
- 70.Zimmer M. 1997. Surfactants in the gut fluids of Porcellio scaber (Isopoda: Oniscidea), and their interactions with phenolics. J. Insect Physiol. 43, 1009–1014. (doi:10.1016/S0022-1910(97)00074-7) [DOI] [PubMed] [Google Scholar]
- 71.Smoot JC, Mayer LM, Bock MJ, Wood PC, Findlay RH. 2003. Structures and concentrations of surfactants in gut fluid of the marine polychaete Arenicola marina. Mar. Ecol. Prog. Ser. 258, 161–169. (doi:10.3354/meps258161) [Google Scholar]
- 72.Voparil IM, Mayer LM, Jumars PA. 2008. Emulsions versus micelles in the digestion of lipids by benthic invertebrates. Limnol. Oceanogr. 53, 387–394. (doi:10.4319/lo.2008.53.1.0387) [Google Scholar]
Associated Data
This section collects any data citations, data availability statements, or supplementary materials included in this article.
Supplementary Materials
Data Availability Statement
Raw spectral data associated with figures 2–8 and electronic supplementary material, figures S2–S5 are available from Dryad Digital Repository using the following link: http://dx.doi.org/10.5061/dryad.8734c.


