Abstract
The mechanisms behind the destruction of the adrenal glands in autoimmune Addison’s disease remain unclear. Autoantibodies against steroid 21-hydroxylase, an intracellular key enzyme of the adrenal cortex, are found in over 90% of patients, but these autoantibodies are not thought to mediate the disease. Here we demonstrate highly frequent 21-hydroxylase specific T cells detectable in 20 patients with Addison’s disease. Using overlapping 18aa peptides spanning the full length of 21-hydroxylase, we identified immunodominant CD8+ and CD4+ T cell responses in a large proportion of Addison’s patients both ex-vivo and after in-vitro culture of peripheral blood lymphocytes up to 20 years after diagnosis. In a large proportion of patients, CD8+ 21-hydroxylase specific T cells and CD4+ 21-hydroxylase specific T cells were very abundant and detectable in ex-vivo assays. HLA class-I tetramer-guided isolation of 21-hydroxylase specific CD8+ T cells showed their ability to lyse 21-hydroxylase positive target cells, consistent with a potential mechanism for disease pathogenesis. These data indicate strong cytotoxic T lymphocyte responses to 21-hydroxylase often occur in-vivo, and that reactive cytotoxic T lymphocytes have substantial proliferative and cytolytic potential. These results have implications for earlier diagnosis of adrenal failure and ultimately a potential target for therapeutic intervention and induction of immunity against adrenal cortex cancer.
INTRODUCTION
Autoimmune Addison’s disease is caused by the destruction of the adrenal cortex, and can occur either in isolation or as part of Autoimmune Polyendocrine syndromes type 1 or 2 (APS-1 and APS-2) 1-3. The target antigen for Addison’s disease was identified over 20 years ago by Winqvist et al. as steroid 21-hydroxylase (21-OH), a key intracellular steroidogenic enzyme exclusively expressed in the adrenal cortex 4 Rapidly this seminal finding was translated into clinical practice; assay of 21OH-antibodies (21-OH-Ab) is the most important biomarker for autoimmune Addison’s disease present in over 90% of patients 5. 21-OH-Ab are typically present years before clinical disease is evident and may be found when testing individuals who are at risk of developing Addison’s disease i.e. patients who have another autoimmune disease or have a relative with Addison’s disease. Pre-clinical adult patients with 21-OH-Ab, however, only have a cumulative risk of about 20% of developing overt Addison’s disease, if adrenal function is normal at the start of the observation 6. Thus, a significant proportion of individuals with 21-OH-Ab continue to remain disease free.
Histological studies of adrenal glands from deceased Addison’s disease patients show significant mononuclear cell infiltration into the adrenal gland 7, and, since 21-OH is an intracellular enzyme, autoantibodies are unlikely to directly mediate destruction of the adrenal gland. Also, as demonstrated during pregnancy, 21-OH-Ab transferred from a mother with Addison’s disease did not cause disease in the child 8. Instead 21-OH-Ab are more likely to be an indication of T cell mediated destruction of the adrenal cortex perhaps mediating or augmenting antigen presentation 9.
It was first shown by Freeman et al. that Peripheral Blood Mononuclear Cells (PBMCs) from Addison’s disease patients, but not controls, proliferated in response to adrenal proteins 10 and this observation was followed by a study showing that PBMC proliferation and IFNγ secretion occurred particularly in the presence of 21-OH 9. More recently Rottembourg et al. established that a significant proportion of HLA-B8+ patients have circulating T cells that are specific for a dominant 21-OH peptide 11. However, there remains a need for comprehensive epitope mapping to show which epitopes on 21-OH are targeted by T cells in Addison’s disease patients with different haplotypes, and importantly whether these cells are functionally capable of destroying the adrenal cortex.
To address these questions, we used 18mer overlapping synthetic peptides spanning the entire 21-OH protein and demonstrated that T cells from Addison’s disease patients, unlike healthy controls, responded to the pool of 21-OH peptides. Such responses were mainly dominated by MHC class I restricted CD8+ T cells and focused on immunodominant regions on 21-OH. We extended these findings by demonstrating that HLA-A2 restricted 21-OH specific CD8+ T cell clones generated from an Addison’s patient are capable of lysing HLA-A2 target cells transduced with lentiviral vectors encoding the full length 21-OH protein and HLA-A2+ 21-OH+ tumor cells, thus providing important insights into the pathogenesis and progression of Addison’s disease.
MATERIALS AND METHODS
Patients and controls
Blood samples were taken from 21-OH-Ab-positive Addison’s Disease Patients attending hospital clinics in Sweden, Norway, Germany and the UK and their characteristics are shown in Table I. Eight patients were analyzed from Bergen, Norway (EH), seven patients from Newcastle, UK (SHP), four from Frankfurt am Main, Germany (KB) and one from Stockholm, Sweden (SB). Local ethical approval was verified and approved by the ethical committee for the EURADRENAL studies and informed consent obtained. Inclusion criteria for patients were a clinical diagnosis of primary adrenal insufficiency and presence of 21-OH-Ab at onset. For comparison, blood samples from adult healthy volunteers from the UK and Norway were used and all the volunteers were anonymized.
Table 1. Patient characteristics, 21-OH antibody titers and HLA haplotypes.
21-OH antibody titers were classified as + (11 – 100), ++ (101 – 1,000) and +++ (1,001 – 10,000).
| Patient | Gender | Age at Diagnosis | Disease duration at sampling (years) | 21-OH Ab titre | HLA-A | HLA-B | HLA-C | HLA-DRB1 | HLA-DQB1 |
|---|---|---|---|---|---|---|---|---|---|
| Patient 1 | F | 59 | 0.5 | ++ | A*02 | B*07, B*15 | C*03, C*07 | DRB1*04, DRB1*09 | DQB1*03 |
| Patient 2 | F | 40 | 2 | ++ | A*01, A*03 | B*08, B*18 | C*05, C*07 | DRB1*03 | DQB1*02 |
| Patient 3 | F | 18 | 2 | ++ | A*01, A*32 | B*07, B*08 | C*07 | DRB1*03, DRB1*15 | DQB1*02, DQB1*06 |
| Patient 4 | F | 35 | 1 | ++ | A*01 | B*08 | C*07 | DRB1*03 | DQB1*02 |
| Patient 5 | F | 52 | 1 | ++ | A*01, A*02 | B*04, B*08 | C*03, C*07 | DRB1*03, DRB1*04 | DQB1*02 |
| Patient 6 | F | 23 | 1 | ++ | A*01, A*03 | B*04, B*08 | C*03, C*07 | DRB1*03, DRB1*04 | DQB1*02, DQB1*03 |
| Patient 7 | F | 17 | 1 | ++ | A*02, A*68 | B*08, B*44 | C*05, C*07 | DRB1*03, DRB1*15 | DQB1*02, DQB1*06 |
| Patient 8 | F | 18 | 2 | ND | A*01 | B*08, B*15 | C*07 | DRB1*03, DRB1*11 | DQB1*02, DQB1*03 |
| Patient 9 | M | 22 | 2 | ++ | A*01, A*03 | B*07, B*08 | C*07 | DRB1*03, DRB1*15 | DQB1*02, DQB1*06 |
| Patient 10 | F | 54 | 4 | ++ | A*01, A*24 | B*08, B*35 | C*04, C*07 | DRB1*03, DRB1*07 | DQB1*02, DQB1*03 |
| Patient 11 | F | 36 | 1 | ++ | A*02, A*26 | B*07, B*15 | C*03, C*07 | DRB1*03, DRB1*12 | DQB1*03 |
| Patient 12 | F | 56 | 1 | ++ | A*02 | B*08, B*15 | C*03, C*07 | DRB1*04 | DQB1*03 |
| Patient 13 | M | 25 | 3 | ++ | A*02, A*24 | B*27, B*44 | C*02, C*05 | DRB1*04 | DQB1*04, DQB1*05 |
| Patient 14 | M | 17 | 2 | +++ | A*01, A*03 | B*08, B*15 | C*03, C*07 | DRB1*08, DRB1*14 | DQB1*02, DQB1*04 |
| Patient 15 | M | 18 | 2 | + | A*01, A*02 | B*27, B*44 | C*02, C*05 | DRB1*03, DRB1*08 | DQB1*03, DQB1*06 |
| Patient 16 | F | 45 | 4.5 | + | A*32, A*66 | B*07, B*35 | C*04, C*07 | DRB1*04, DRB1*13 | DQB1*03, DQB1*05 |
| Patient 17 | F | 24 | 3.5 | +++ | A*02 | B*35, B*37 | C*02 | DRB1*04, DRB1*16 | DQB1*03, DQB1*05 |
| Patient 18 | F | 18 | 2 | ++ | A*01, A*02 | B*08, B*40 | C*07 | DRB1*04, DRB1*15 | DQB1*02, DQB1*03 |
| Patient 19 | F | 39 | 17 | ++ | A*01, A*02 | B*08, B*40 | C*03, C*07 | DRB1*03, DRB1*12 | DQB1*02, DQB1*06 |
| Patient 20 | F | 33 | 19 | ++ | A*31 | B*40, B*51 | C*03, C*15 | DRB1*03, DRB1*15 | DQB1*02, DQB1*03 |
| Control 1 | _ | _ | N/A | N/A | A*02, A*03 | B*07, B*44 | C*05, C*07 | DRB1*04, DRB1*15 | DQB1*03, DQB1*06 |
| Control 2 | _ | _ | N/A | N/A | A*02, A*29 | B*44 | C*05, C*16 | DRB1*07, DRB1*12 | DQB1*02, DQB1*03 |
| Control 3 | _ | _ | N/A | N/A | A*02, A*11 | B*44 | C*04, C*05 | DRB1*04, DRB1*13 | DQB1*03, DQB1*06 |
| Control 4 | _ | _ | N/A | N/A | A*02, A*03 | B*07, B*57 | C*06, C*07 | DRB1*07, DRB1*15 | DQB1*06 |
| Control 5 | _ | _ | N/A | N/A | A*02, A*32 | B*08, B*14 | C*07, C*08 | DRB1*03, DRB1*07 | DQB1*02 |
| Control 6 | _ | _ | N/A | N/A | A*23, A*25 | B*13,B*44 | C*05, C*06 | DRB1*04, DRB1*07 | DQB1*02, DQB1*03 |
| Control 7 | _ | _ | N/A | N/A | A*24 | B*07, B*35 | C*04, C*07 | DRB1*03, DRB1*13 | DQB1*02, DQB1*06 |
Patient HLA haplotype
DNA was extracted from patient PBMCs for haplotyping using the Qiagen DNAeasy kit and haplotyping conducted by the sequencing facility at the Weatherall Institute for Molecular Medicine.
21-OH Peptides
Overlapping 18aa peptides that span the whole 21-OH sequence were synthesized by facilities at the Weatherall Institute of Molecular Medicine and are listed below in Table S1. Peptides were dissolved in DMSO at a concentration of 40μg/ml and were used either individually or as a combined pool.
T cell culture assay
Patient cells were stimulated at 6 × 10⁶/ well with 1μg/ml 21-OH peptide pool in RH-10 (RPMI-1640 pH 7.4 supplemented with 10% Human Serum, 1% Penicillin Streptomycin, 1% L-Glutamine, 1% Non Essential Amino Acids, 1% Sodium Pyruvate, 1% HEPES and 0.1% 2-Mercaptoethanol). Cells were initially pulsed in 200μl for 1 hour before the volume was increased to 2ml and IL-7 was added at 25ng/ml. On Day 3 cells were fed with RH-10 containing 1000IU/ml IL-2 (Pharmacia) and continued to be fed and/or split as necessary with IL-2 containing medium until Day 13 when they were washed to remove IL-2 and rested overnight in RH-10, in preparation for the intracellular staining (ICS) assay.
FACS staining
Cells were stained for intracellular cytokine secretion after 14 days in culture. 200,000 cells were pulsed with individual peptides or the pool of peptides at 10μg/ml for 5 hours, with 10μg/ml Brefeldin A (eBiosciences) added after the first hour to prevent cytokine secretion into the supernatant. Cells were washed and stained for the surface markers CD8 APC-H7, CD4 PerCP, and CD3 V500 (BD) together with LIVE/DEAD viability marker (Invitrogen) diluted in PBS for 30 minutes on ice, then washed and fixed with fixation solution (eBioSciences) for a further 30 minutes on ice or left overnight at 4°C. Cells were permeabilised by washing with permeabilisation buffer (eBioSciences) and stained with the intracellular antibody IFNγ FITC (eBiosciences) diluted in the permeabilisation buffer for 30 minutes on ice. Cells were washed with PBS and resuspended in FACS buffer for acquisition by flow cytometry. The presence of CD107 on the T cell surface was assessed by the addition of PE conjugated CD107 (BD) antibody at the same time as Brefeldin A. CD4+ and CD8+ T cell responses to the peptide diluent DMSO were negligible and below 0.001%.
Flow cytometry and gating strategy
Cells were acquired by flow cytometry on FACS CANTO II and samples analyzed using Flowjo (TreeStar). Cells were gated to remove doublets, then separated into Live CD3+ CD4+ or CD8+ cells and analyzed separately for their cytokine positivity.
Ex-vivo ELISPOT assay
Plates were coated overnight at 4°C with 4μg/ml capture Ab (MabTech) in coating buffer (SIGMA). Plates were washed twice with RPMI-1640 then incubated for 1hour at 37°C with 200μl of blocking buffer (RPMI-1640 +10% human serum). After washing plates three times, cells were added in triplicate at 500,000/well with 10μg/ml peptide in X-Vivo 15 serum-free medium (Lonza) and incubated for 18 hours at 37°C. Plates were washed with wash buffer (distilled water + 0.05% Tween-20) followed by distilled water before adding 0.2μg/ml biotin detection antibody (MabTech) diluted in PBS, then incubated for 2 hours at 37°C. Plates were washed again and 1μg/ml Streptavidin-ALP (MabTech) diluted in PBS added then incubated for a further hour at room temperature. Finally, plates were washed once more before developing by adding 100μl of substrate solution and incubated for 10 minutes in the dark at room temperature. Development was stopped by rinsing plates thoroughly with cold water and the plates left to dry completely before counting spots using an AID ELISPOT Reader.
HLA-Class I tetramers
Monomers were made by refolding the HLA-A2 or HLA B8 heavy chain and β2m proteins with the 21-OH342-350 peptide (LLNATIAEV) or the 21-OH428-435 peptide (EPLARLEL) together at 4°C for 40 hours 12. The refold mixture was then concentrated to approximately 8ml using a Nitrogen gas pressured stir cell with a pre-soaked ultrafiltration 150mm membrane (Millipore) before being biotinylated with a BirA enzyme overnight, followed by FPLC separation to remove aggregates. The concentration of the eluted monomer was measured by BCA assay and aliquots stored at −80°C. Monomers were tetramerised using Streptavidin-APC (eBioscience) before being used to stain T cells.
Granzyme B ELISA
Granzyme B secretion was measured by ELISA in the supernatant after overnight co-culture of 20,000 CTL with 40,000 target cells. ELISA plates were precoated overnight with Anti-Granzyme B antibody before being washed and loaded with supernatants overnight at 4°C. Plates were washed and incubated with the biotin Antibody followed by extavidin Peroxidase and developed using TMB solution (SIGMA).
21-OH Lentivirus constructs
RNA was extracted from 21-OH expressing NCI H295 cells using the Qiagen RNAeasy kit and cDNA synthesized using the RETROSCRIPT kit. The 21-OH fragment was amplified from prepared cDNA using the forward primer (CGCGGATCCACCATGCTGCTCCTGGGCCTGCTG) and the reverse primer (CCGCTCGAGCTGGCTCTGGCCCGGGCTGTG), containing the BamH1 and Xho1 restriction sites. The insert was digested using BamH1 and Xho1 and ligated into a GFP lentiviral vector, which was then used to transform competent DH5alpha bacteria.
Lentiviral particles were made by combining the GFP-21-OH lentivector, pMDG and the Gag-pol expressor with Fugene ®6 transfection reagent (Promega), then adding dropwise to 293T cells, which had been grown to 90% confluency. Supernatants containing viral particles were collected after 2 days and used to transduce B cells. Cells were sorted for GFP positivity and cultured for a further two weeks before being used in functional assays.
VITAL Assay
The vital assay was performed as previously described 13. Briefly, 150,000 21-OH Green Fluorescence Protein (GFP) transduced cells were placed together with 150,000 untransduced B cells that had been labeled with CellTracker™ Orange CMTMR (5-(and-6)-(((4-chloro-methyl)benzoyl)amino)tetramethylrhodamine; Invitrogen) in flat bottomed 96 well plates and co-cultured with 21-OH specific T cell clones overnight at different effector: target ratios. Cells were then washed and stained with Invitrogen Live/Dead dye and acquired by flow cytometry to determine killing of target cells. Equal numbers of CMTMR labeled untransduced B cells were placed in a well containing the 21-OH GFP B cells and co-cultured with 21-OH342-350 T cell clone at different effector: target ratios. The target cell survival was calculated as the percentage of GFP positive cells compared to the CMTMR positive cells, and the target cell lysis was calculated as 100 minus the cell survival percentage.
RESULTS
High frequency of 21-OH specific CD8+ and CD4+ T cells in PBMCs from Addison’s disease patients
In order to assess the overall T cell responses to 21-OH in Addison’s disease patients, PBMCs were obtained from Addison’s disease patients with high titer of 21-OH–Ab. HLA haplotype revealed a high proportion of patients expressing HLA-A2, HLA-A1 and HLA-B8 (Table I). The frequency of 21-OH specific CD4+ and CD8+ T cells was then measured by intracellular staining for IFNγ in response to re-stimulation with the individual peptides or with the pool of peptides for 13 days.
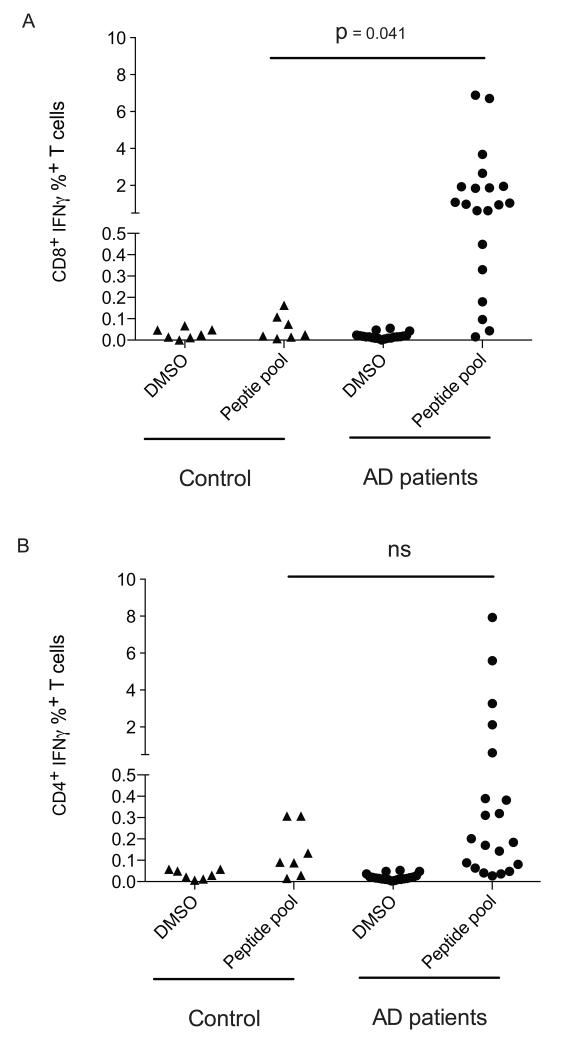
We found that most of 20 Addison’s disease patients analyzed in this study had high numbers of 21-OH specific CD8+ and CD4+ T cells as compared to the baseline values found in healthy controls (Fig. 1). Of note, although the magnitude of 21-OH specific CD8+ T cell responses appeared greater than the magnitude of 21-OH specific CD4+ T cell responses (Fig. 1), since these experiments were performed after stimulating PBMC once in vitro with a pool of overlapping 18-mer peptides, the relative frequency of 21-OH specific CD8+ and CD4+ T cell responses cannot be compared.
Figure 1. 21-OH specific T cells are detectable in Addison’s disease patients.
The production of IFN-γ from CD8+ (A) and CD4+ (B) T cells in response to 21-OH was assessed by culturing PBMCs from healthy controls or Addison’s patients for 14 days in the presence of a pool of peptides spanning the full length 21-OH protein, followed by stimulation for 12 hours with the 21-OH peptide pool (peptide pool) or with DMSO (DMSO). T cells were surface stained for CD4 and CD8 expression, then stained intracellularly for the production of IFN-γ. P-values were determined using an unpaired T test. Each dot corresponds to a different patient. Controls and pat ients have different symbols.
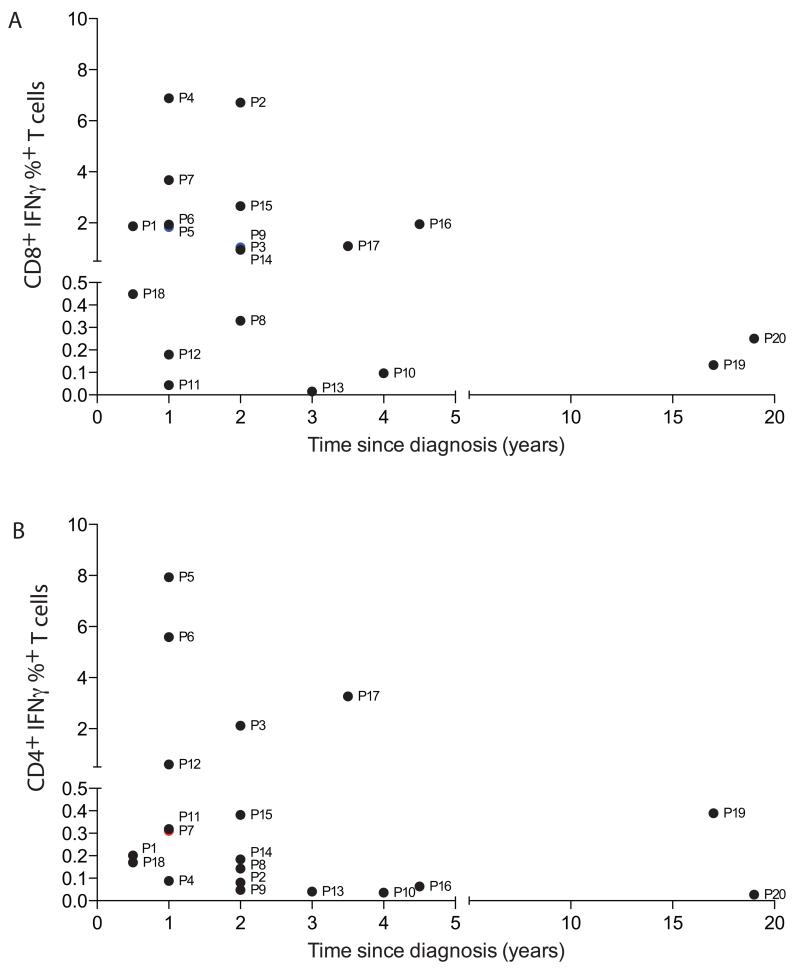
In order to assess the longevity of 21-OH specific T cell responses, we compared the frequency of 21-OH specific T cell responses in patients that had been diagnosed with Addison’s disease for up to 20 years (Fig. 2). We observed that whilst the magnitude of the 21-OH specific T cell response decreased over time, we were still able to detect responses in the majority of our samples from 1 to 2 years since diagnosis. Similar results were observed by ex-vivo ELISPOT using patients’ PBMC, including both both 21-OH specific CD4+ and CD8+ T cell responses (Fig. S3 and S4).
Figure 2. 21-OH specific T cells can be identified for many years after diagnosis in the peripheral blood of Addison’s disease patients.
21-OH specific T cell responses, as defined by the frequency of IFN-γ positive T cells upon stimulation with the 21-OH peptide pool, were analyzed at different time points after diagnosis in Addison’s Disease patients. Panel A indicates the frequency of 21-OH specific CD8+ T cells, while panel B indicates 21-OH specific CD4+ T cells. Each symbol represents a different patient, corresponding to the order shown in Table 1.
T cell responses are targeted to immunodominant 21-OH regions
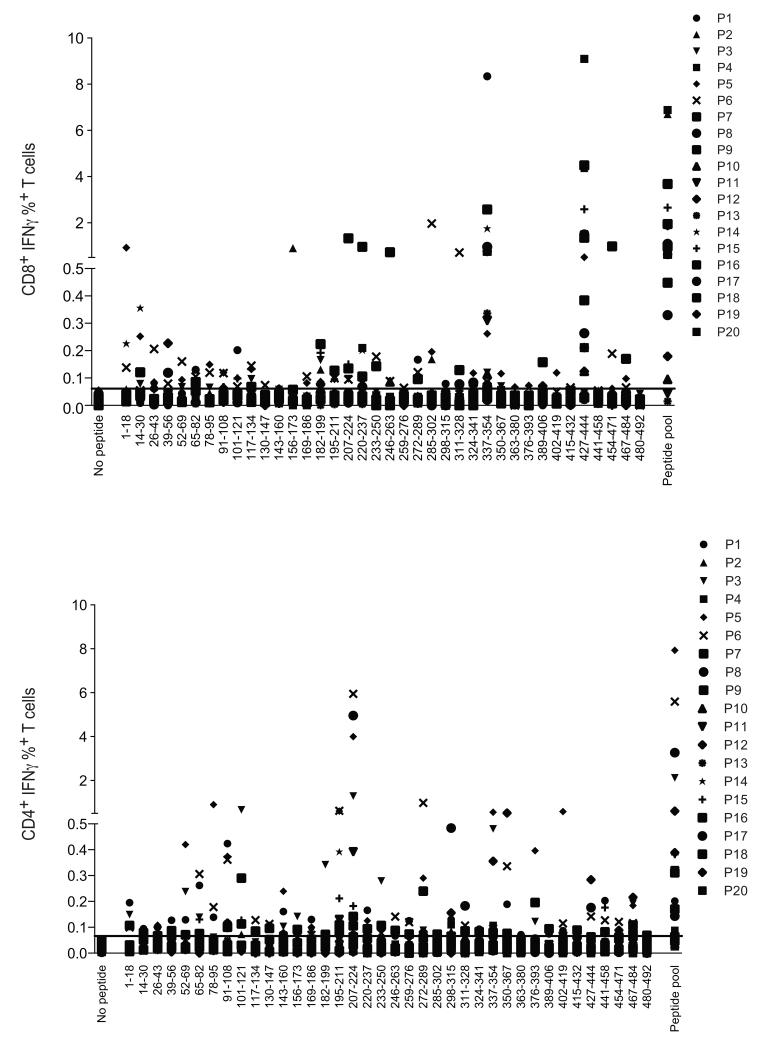
Having established the presence of frequency CD8+ and CD4+ T cell responses to 21-OH in patients with Addison’s disease, we next mapped the peptide epitopes recognized by the 21-OH specific T cells. PBMCs that had been expanded with the pool of 21-OH peptides were tested against each individual overlapping peptide before measuring the IFNγ secretion by intracellular staining and flow cytometry. The majority of patients revealed CD8+ T cells capable of recognizing 21-OH337-354 and/or 21-OH428-445 (Fig. 3A and Fig. S1A). In contrast, a number of CD4+ T cells recognized the peptide 21-OH 207-224 (Fig. 3B and Fig. S1B).
Figure 3. Immunodominance and epitope mapping of 21-OH specific T cell responses.
Percentage of 21-OH specific CD8+/CD3+ (top panel) and CD4+/CD3+ (bottom panel) T cells, as defined by IFN-γ intracellular staining. T cell responses were measured after in vitro T cell expansion with 21-OH overlapping peptides spanning the full-length 21-OH protein followed by stimulation with either individual peptides (amino acid sequence shown in the figure) or pool of all peptides (peptide pool). Negative control samples in DMSO (no peptide) are shown in each panel. Each symbol represents a different patient, corresponding to the order shown in Table 1. Horizontal straight line indicates the cut off value for positive responses, as defined by percentage values above the mean value of the percentage of IFN-γ secretion plus 3 times the standard deviation. Such values were 0.061% and 0.066% for CD8+ and CD4+ T cell responses, respectively.
T cell responses to dominant 21-OH peptides are detectable ex vivo
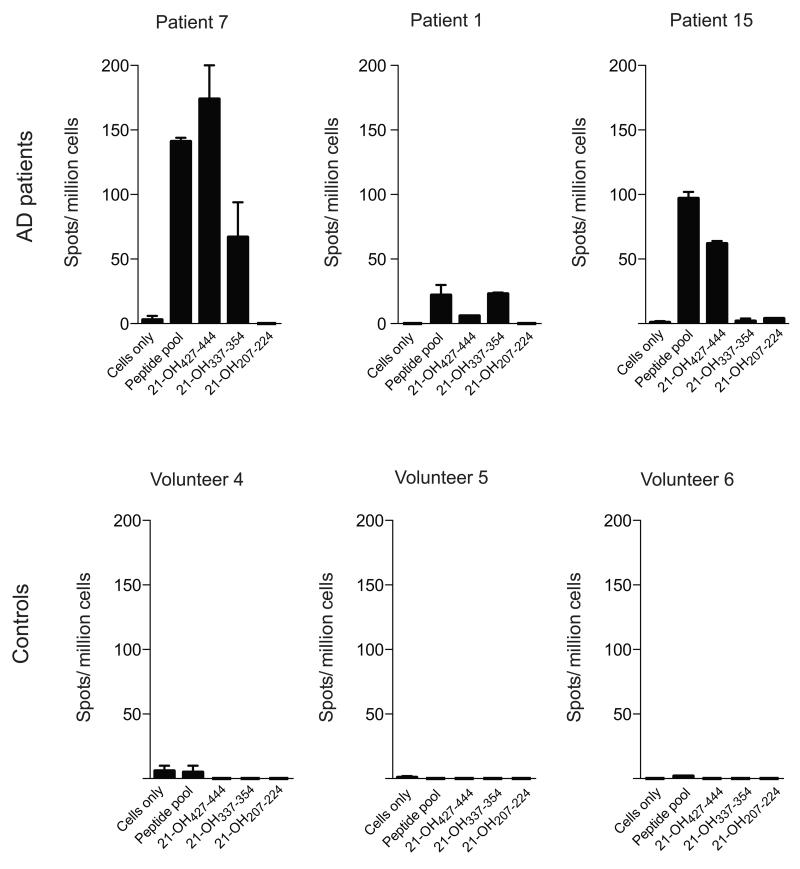
Whilst the recall assay response is indicative of a memory T cell response to 21-OH in Addison’s patients, this assay remains semi-quantitative and does not represent the actual frequency of 21-OH specific T cells in Addison’s disease patients. To gain a better understanding of the magnitude of 21-OH specific T cells, we performed ex-vivo ELISPOT assays in duplicate with the immunodominant peptide identified during the recall assay (Fig. 4). We found that the patients showed responses in the ex-vivo assay that were specific to the same peptides recognized in the recall assay, demonstrating that the T cell responses were not being biased to particular peptides during the bulk culturing with the pool of peptides. The ex-vivo frequency of 21-OH specific T cell responses (ranging from ~ 0.001% to 0.01%) was similar to melanoma specific CD8+ T cell responses observed in cancer patients 12. As shown above, we confirmed the longevity of 21-OH specific responses, as ex-vivo ELISPOT assays demonstrated the presence of 21-OH specific responses after many years after diagnosis (Fig. S3). Cumulative ex-vivo ELISPOT data are shown in Fig. S4. To further characterize the relative frequency of CD8+ and CD4+ 21-OH specific T cell responses, CD4+ and CD4− T cells were sorted from PBMC from patient 5 and patient 15 and tested in ex-vivo ELISPOT assays for their ability to recognize the pool of 21-OH peptides (Fig. S3). Extending the results shown in Fig. S2, the results in Fig. S3 of the experiments demonstrated that PBMCs from patient 15 have a detectable ex-vivo ELISPOT response against the pool of 21-OH peptides, while PBMC from patient 5 have a much lower frequency of 21-OH specific T cells. Separation of CD4+ and CD4− T cells showed that the ex-vivo 21-OH specific T cell response seen in patient 15 was mainly dominated by CD4− 21-OH specific T cells and that 21-OH specific CD4+ T cell responses could only be detected after enriching T cell cultures for CD4+ T cells (Fig. S3).
Figure 4. Addison’s Disease patients show strong ex-vivo T cell responses to 21-OH.
Ex-vivo ELISPOT assay with PBMCs from Addison’s disease patients (top panel) or healthy controls (lower panel) upon stimulation with pool of overlapping overlapping peptides spanning the full length 21-OH protein (peptide pool) or indicated peptides. Number of spots per million cells are shown on the Y axis. Results from 3 representative patients are shown. Bars represent Standard Error of the mean (SEM).
Functional evidence that 21-OH specific CD8+ T cells are antigen specific cytotoxic lymphocytes
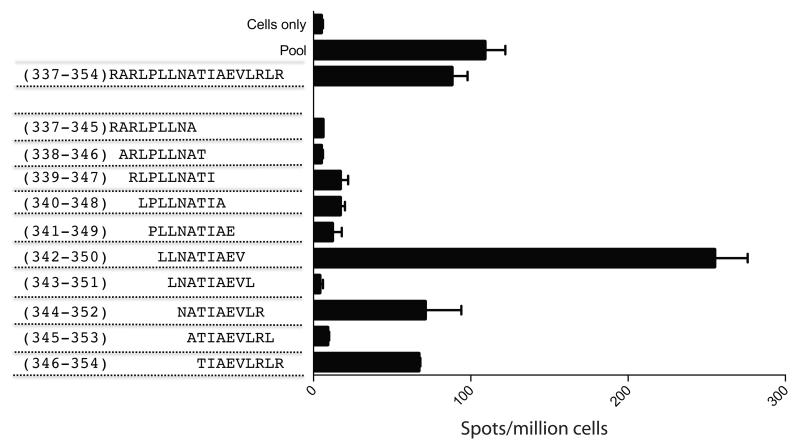
Specificity and HLA restriction of T cell responses were confirmed by staining T cell lines and clones with HLA A2 and HLA B8 tetramers loaded with 342-350 21-OH peptide and 428-435 21-OH peptide, respectively (Fig. S5). HLA-A2 tetramer sorted 21-OH342-350 specific CD8+ T cells were assayed for their ability to recognize 21-OH expressing cells. Firstly, we used overlapping 9mers spanning the immunodominant peptide 21-OH337-354 to identify the epitope. The peptide 21-OH342-350 (LLNATIAEV) elicited the strongest response (Fig. 5). Then, using HLA-A2 tetramers loaded with the peptide 21-OH342-350, we were able to sort a panel of CD8+ T cell lines and clones (Fig. S5) and tested their specificity and functional activity (Fig. 6, Fig. 7 and Fig. S6).
Figure 5. Identification of the immunodominant optimal length 21-OH337-354 peptide.
PBMCs from patient 7 were rested overnight and stimulated with the indicated peptides in duplicate wells in an ELISPOT assay and spots per million cells were counted.
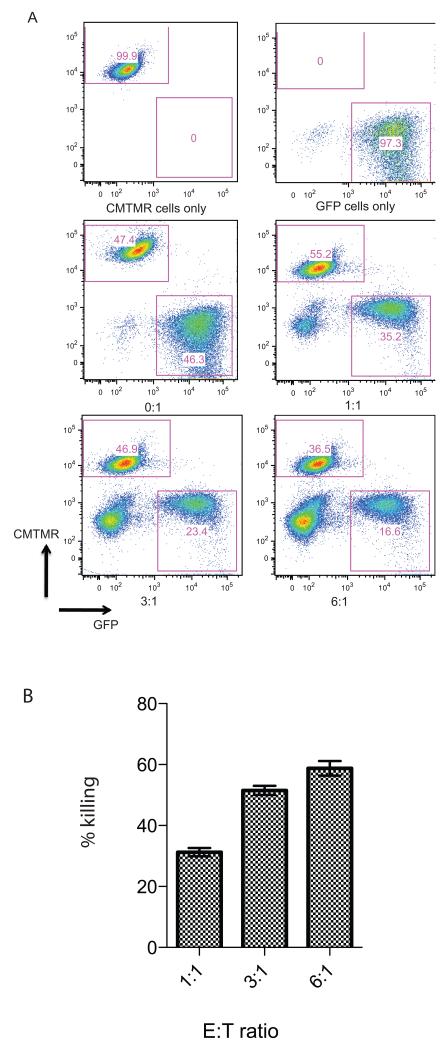
Figure 6. Ability of 21-OH specific T cells to lyse target cells expressing full-length 21-OH protein.
HLA-A2 restricted 21-OH342-350 specific T cell clone was co-incubated overnight at indicated E:T ratios with B cells either transduced with lentiviral vector encoding the full-length 21-OH protein and GFP or with CMTMR labeled untransduced B cells. Panel A shows FACS staining. Top two panels show target cells in the absence of the 21-OH342-350 specific T cell clone. Bottom four panels show co-cultures between T cell clone and target cells at the indicated E/T ratios. Increasing numbers of T cells are shown in the bottom left corner of each dot plot. The percentage of GFP+ and CMTMR+ labeled cells is shown in each dot plot. Panel B shows percentage of specific lysis of 21-OH positive target cells.
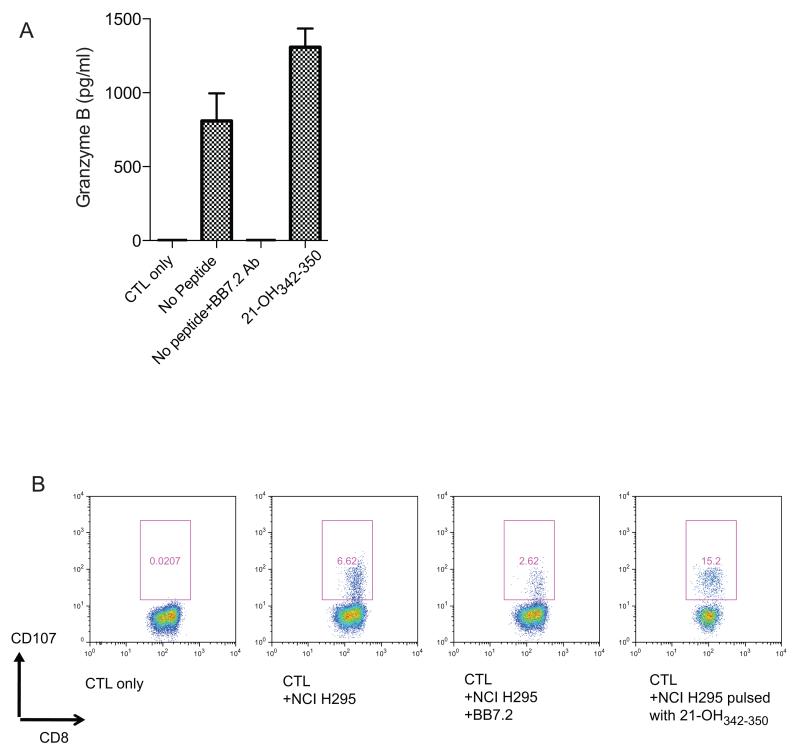
Figure 7. Functional activity of 21-OHspecific CD8+ T cells.
(A) ELISA with granzyme B specific antibody from supernatant of the HLA-A2 restricted 21-OH342-350 specific T cell clone co-cultured with the HLA-A2+ 21-OH expressing tumor cell line NCI H295 in the presence of absence of the HLA-A2 blocking antibody BB7.2. Positive control with NCI H295 cells pulsed with peptide 21-OH342-350 is shown. (B) Increased expression of CD107 on the surface of the HLA-A2 restricted 21-OH342-350 specific T cell clone co-cultured with the HLA-A2+ 21-OH expressing tumor cell line NCI H295 in the presence of absence of the HLA-A2 blocking antibody BB7.2. Positive control with NCI H295 cells pulsed with peptide 21-OH342-350 is shown. The results are representative of two experiments.
HLA-A2/21-OH342-350 tetramer+ CD3+CD8+ cells recognized targets pulsed with nanomolar concentrations of the 21-OH342-350 peptide, but not with irrelevant peptides (Fig. S6). These data provide direct evidence that HLA-A2/21-OH342-350 peptide tetramer+ CD3+CD8+ cell populations derived from PBMC of Addison’s disease patients contain HLA-A2–restricted CD8+ T cells recognizing peptide 21-OH342-350. In addition, T cells were able to lyse HLA A2+ target cells transduced with a lentiviral vector encoding the full length 21-OH, thus confirming their cytotoxic capacity (Fig. 6).
To further confirm the functional capability of 21-OH342-350 specific T cells we co-cultured the clones with a HLA-A2 expressing tumor line, NCI H29514 and found an increase in CD107 expression and Granzyme B secretion in the supernatant as measured by ELISA. NCI H295 recognition was reduced in the presence of the HLA-A2 blocking antibody BB7.2 (Fig. 7). Since this experiment was performed using the CD8+ T cell clone shown in Fig. S5, the observation that CD107 expression was not completely abolished by BB7.2 may be due to the recycling of CD107 to the cell surface.
DISCUSSION
In this study we show strong and long-lasting T cell responses against a few specific peptides derived from 21-OH, the major adrenal cortex cell autoantigen. We have measured the frequency, phenotype and functional activity of 21-OH-specific CD8+ and CD4+ T cells in the PBMCs of Addison’s patients directly ex vivo and after in vitro culture. Our results show that 21-OH-specific CD8+ and CD4+ T cells are often present in high numbers in PBMC, are antigen-experienced, and are capable of massive expansion when exposed to the appropriate cytokines, generating highly cytolytic T cell populations. The ability of 21-OH specific CD8+ T cell clones to recognize endogenous 21-OH protein may therefore be directly linked to the progression of Addison’s disease.
It has previously been established that T cells target autoantigens and cause destruction in other organ-specific autoimmune diseases such as type 1 diabetes, myasthenia gravis and multiple sclerosis 15,16. However, it has often been difficult to characterize such autoreactive T cells, as they are present at a very low frequency in peripheral blood. Addison's disease offers an opportunity to better understand why the immune system in organ-specific autoimmunity often targets intracellular proteins with a tissue-specific expression and often key enzymatic functions in the tissues involved, e.g. thyreoperoxidase in autoimmune thyroiditis, glutamic acid decarboxylase in type 1 diabetes or steroid side-chain cleavage enzyme in autoimmune oophoritis 17.
The high frequency of 21-OH specific T cells, comparable to the frequency of tumor specific T cells observed in melanoma patients 12 and their long-term persistence after diagnosis is therefore unexpected and it is consistent with the possibility that 21-OH specific T cells are continuously stimulated in vivo by mechanisms, which need to be further investigated. It is tempting to speculate that this may be caused by non-adrenal expression of 21-OH 18 or that some remnants of the adrenal cortex persist within AD patients, perhaps owing to continued proliferation from residual adrenal progenitor or stem cells, either of which could continue to stimulate the 21-OH specific T cells 19,20. Alternatively, the long-term persistence of 21-OH specific CD8+ and CD4+ T cells may be due to cross-reactive viral or bacterial epitopes, as suggested for other autoimmune disorders 21. It is not possible to draw firm conclusions about the relative difference in frequency of 21-OH specific CD8+ and CD4+ T cells, as the majority of the experiments to compare the frequency of 21-OH specific T cells were performed after stimulating PBMC in vitro with a pool of overlapping 18-mer peptides spanning the full-length 21-OH protein. The apparent higher frequency of CD8+ 21-OH specific T cells is consistent with previous observations demonstrating higher frequency of antigen specific CD8+ T cells specific for self 22 , virus 23 and cancer epitopes 24. However, higher frequency of virus specific CD4+ T cells has also been documented 25.
Interestingly, we found that T cell responses in Addison’s patients are clustered to just a few immunodominant 21-OH epitopes. A previous report had identified the HLA-B8 restricted epitope 21-OH431-438 11. Our results have confirmed and extended these findings by demonstrating that the response to peptide 21-OH431-438 is immunodominant, as it was detected in a large proportion of HLA B8+ patients. In addition, we identified a further HLA-A2-restricted dominant epitope at position 21-OH342-350.
Previous studies have indicated an association between Addison’s disease and the HLA DRB1*04- DQA1* 0301- DQB1* 0302 haplotype (as reviewed in 26) and the HLA DRB1*0404 restricted recognition of a peptide spanning the region 21-OH342-361 9. The results of our study, while confirming the presence of 21-OH specific CD4+ T cell responses, highlighted a significantly larger frequency of HLA-class I restricted CD8+ T cell response, with a strong bias towards T cell responses restricted by HLA-A2, HLA-A1 and HLA-B8.
Since only a minority of individuals with 21-OH-Ab develop disease within an observation period of up to 5 years 6, future investigations on T cell responses in these individuals and the ability to predict disease progression is of major importance, as it could provide diagnostic and therapeutic opportunities. A better understanding of the initiation of T cell responses at the molecular level in Addison’s disease may also open up a way to induce responses against adrenal cortex cancer, a 21-OH positive tumor with very poor prognosis often afflicting younger people.
In conclusion, we have identified immunodominant regions of 21-Hydroxylase and shown that 21-OH specific T cells recognize endogenous 21-OH protein and may therefore be directly linked to the progression of Addison’s disease. Unexpectedly, the persistence for many years of 21-OH T cell responses in the face of destroyed adrenal glands without remaining endogenous steroid production indicates the presence of remaining antigen stimulation perhaps by ectopic expression of 21-OH in other tissues or by pathogens expressing a cross-reactive epitope continuously stimulating the 21-OH specific T cells.
Supplementary Material
ACKNOWLEDGEMENTS
We gratefully acknowledge Tim Rostron for haplotyping of patient samples and Zhanru Yu for synthesizing all the peptides used in this manuscript. We also wish to thank Hemza Ghadbane and Yanchun Peng for technical support and reagents.
Footnotes
This work was supported by the EURADRENAL (Grant agreement number: 201167), The Wellcome Trust (084923 to V.C.), Cancer Research UK (Program Grant # C399/A2291 to V.C.), the Medical Research Council and by The Swedish Research Council and The NovoNordisk Foundation to O.K.
REFERENCES
- 1.Arlt W, Allolio B. Adrenal insufficiency. Lancet. 2003;361:1881–1893. doi: 10.1016/S0140-6736(03)13492-7. [DOI] [PubMed] [Google Scholar]
- 2.Betterle C, Zanchetta R. Update on autoimmune polyendocrine syndromes (APS) Acta Biomed. 2003;74:9–33. [PubMed] [Google Scholar]
- 3.Husebye ES, Allolio B, Arlt W, Badenhoop K, Bensing S, Betterle C, Falorni A, Gan EH, Hulting AL, Kasperlik-Zaluska A, Kämpe O, Løvås K, Meyer G, Pearce SH. Consensus statement on the diagnosis, treatment and follow-up of patients with primary adrenal insufficiency. J Int Med. 2014;275(2):104–15. doi: 10.1111/joim.12162. [DOI] [PubMed] [Google Scholar]
- 4.Winqvist O, Karlsson FA, Kämpe O. 21-Hydroxylase, a major autoantigen in idiopathic Addison's disease. Lancet. 1992;339:1559–1562. doi: 10.1016/0140-6736(92)91829-w. [DOI] [PubMed] [Google Scholar]
- 5.Erichsen MM, Løvås K, Skinningsrud B, Wolff AB, Undlien DE, Svartberg J, Fougner KJ, Berg TJ, Bollerslev J, Mella B, Carlson JA, Erlic H, Husebye ES. Clinical, immunological, and genetic features of autoimmune primary adrenal insufficiency: observations from a Norwegian registry. J Clin Endocrinol Metab. 2009;94:4882–4890. doi: 10.1210/jc.2009-1368. [DOI] [PubMed] [Google Scholar]
- 6.Coco G, Dal Pra C, Presotto F, Albergoni MP, Canova C, Pedini B, Zanchetta R, Chen S, Furmaniak J, Smith B. Rees, Mantero F, Betterle C. Estimated risk for developing autoimmune Addison's disease in patients with adrenal cortex autoantibodies. J Clin Endocrinol Metab. 2006;91:1637–1645. doi: 10.1210/jc.2005-0860. [DOI] [PubMed] [Google Scholar]
- 7.Irvine WJ, Stewart AG, Scarth LA. Clinical and immunological study of adrenocortical insufficiency (Addison's disease) Clin Exp Immunol. 1967;2:31–70. [PMC free article] [PubMed] [Google Scholar]
- 8.Betterle C. C. D. Pra, Pedini B, Zanchetta R, Albergoni MP, Chen S, Furmaniak J, Smith BR. Assessment of adrenocortical function and autoantibodies in a baby born to a mother with autoimmune polyglandular syndrome Type 2. J Endocrinol Invest. 2004;27:618–621. doi: 10.1007/BF03347492. [DOI] [PubMed] [Google Scholar]
- 9.Bratland E, Skinningsrud B, Undlien DE, Mozes E, Husebye ES. T cell responses to steroid cytochrome P450 21-hydroxylase in patients with autoimmune primary adrenal insufficiency. J Clin Endocrinol Metab. 2009;94:5117–5124. doi: 10.1210/jc.2009-1115. [DOI] [PubMed] [Google Scholar]
- 10.Freeman M, Weetman AP. T and B cell reactivity to adrenal antigens in autoimmune Addison's disease. Clin Exp Immunol. 1992;88:275–279. doi: 10.1111/j.1365-2249.1992.tb03073.x. [DOI] [PMC free article] [PubMed] [Google Scholar]
- 11.Rottembourg D, Deal C, Lambert M, Mallone R, Carel JC, Lacroix A, Caillat-Zucman S, le Deist F. 21-Hydroxylase epitopes are targeted by CD8 T cells in autoimmune Addison's disease. J Autoimmun. 2010;35:309–315. doi: 10.1016/j.jaut.2010.07.001. [DOI] [PubMed] [Google Scholar]
- 12.Romero P. P.R. Dunbar, Valmori D, Pittet M, Ogg GS, Rimoldi D, Chen JL, Liénard D, Cerottini JC, Cerundolo V. Ex vivo staining of metastatic lymph nodes by class I major histocompatibility complex tetramers reveals high numbers of antigen-experienced tumor-specific cytolytic T lymphocytes. J Exp Med. 1998;188:1641–1650. doi: 10.1084/jem.188.9.1641. [DOI] [PMC free article] [PubMed] [Google Scholar]
- 13.Hermans IF, Silk JD, Yang J, Palmowski MJ, Gileadi U, McCarthy C, Salio M, Ronchese F, Cerundolo V. The VITAL assay: a versatile fluorometric technique for assessing CTL- and NKT-mediated cytotoxicity against multiple targets in vitro and in vivo. J Immunol Methods. 2004;285:25–40. doi: 10.1016/j.jim.2003.10.017. [DOI] [PubMed] [Google Scholar]
- 14.Rainey WE, Bird IM, Mason JI. The NCI-H295 cell line: a pluripotent model for human adrenocortical studies. Mol Cell Endocrinol. 1994;100:45–50. doi: 10.1016/0303-7207(94)90277-1. [DOI] [PubMed] [Google Scholar]
- 15.Kent SC, Chen Y, Bregoli L, Clemmings SM, Kenyon NS, Ricordi C, Hering BJ, Hafler DA. Expanded T cells from pancreatic lymph nodes of type 1 diabetic subjects recognize an insulin epitope. Nature. 2005;435:224–228. doi: 10.1038/nature03625. [DOI] [PubMed] [Google Scholar]
- 16.Oshima M, Deitiker PR, Smith RG, Mosier D, Atassi MZ. T-cell recognition of acetylcholine receptor provides a reliable means for monitoring autoimmunity to acetylcholine receptor in antibody-negative myasthenia gravis patients. Autoimmunity. 2012;45:153–160. doi: 10.3109/08916934.2011.611550. [DOI] [PubMed] [Google Scholar]
- 17.Winqvist O, Gustafsson J, Rorsman F, Karlsson FA, Kämpe O. Two different cytochrome P450 enzymes are the adrenal antigens in autoimmune polyendocrine syndrome type I and Addison's disease. J Clin Investig. 1993;92:2377–2385. doi: 10.1172/JCI116843. [DOI] [PMC free article] [PubMed] [Google Scholar]
- 18.Zhou Z, Agarwal VR, Dixit N, White P, Speiser PW. Steroid 21-hydroxylase expression and activity in human lymphocytes. Mol Cell Endocrinol. 1997;127:11–18. doi: 10.1016/s0303-7207(96)03997-4. [DOI] [PubMed] [Google Scholar]
- 19.Wood MA, Hammer GD. Adrenocortical stem and progenitor cells: unifying model of two proposed origins. Mol Cell Endocrinol. 2011;336:206–212. doi: 10.1016/j.mce.2010.11.012. [DOI] [PMC free article] [PubMed] [Google Scholar]
- 20.Gan EH, MacArthur K, Mitchell AL, Hughes BA, Perros P, Ball SG, James RA, Quinton R, Chen S, Furmaniak J, Arlt W, Pearce SH. Residual adrenal function in autoimmune Addison's disease: Improvement following tetracosactide (ACTH1-24) treatment. J Clin Endocrinol Metab. 2014;99(1):111–8. doi: 10.1210/jc.2013-2449. [DOI] [PubMed] [Google Scholar]
- 21.Harkiolaki M, Holmes SL, Svendsen P, Gregersen JW, Jensen LT, McMahon R, Friese MA, van Boxel G, Etzensperger R, Tzartos JS, Kranc K, Sainsbury S, Harlos K, Mellins ED, Palace J, Esiri MM, van der Merwe PA, Jones EY, Fugger L. T cell-mediated autoimmune disease due to low-affinity crossreactivity to common microbial peptides. Immunity. 2009;30:348–357. doi: 10.1016/j.immuni.2009.01.009. [DOI] [PubMed] [Google Scholar]
- 22.Skowera A, Ellis RJ, Varela-Calviño R, Arif S, Huang GC, Van-Krinks C, Zaremba A, Rackham C, Allen JS, Tree TI, Zhao M, Dayan CM, Sewell AK, Unger WW, Drijfhout JW, Ossendorp F, Roep BO, Peakman M. CTLs are targeted to kill beta cells in patients with type 1 diabetes through recognition of a glucose-regulated preproinsulin epitope. J Clin Invest. 2008;118:3390–3402. doi: 10.1172/JCI35449. [DOI] [PMC free article] [PubMed] [Google Scholar]
- 23.Li CK, Wu H, Yan H, Ma S, Wang L, Zhang M, Tang X, Temperton NJ, Weiss RA, Brenchley JM, Douek DC, Mongkolsapaya J, Tran BH, Lin CL, Screaton GR, Hou JL, McMichael AJ, Xu XN. T cell responses to whole SARS coronavirus in humans. J Immunol. 2008;181:5490–5500. doi: 10.4049/jimmunol.181.8.5490. [DOI] [PMC free article] [PubMed] [Google Scholar]
- 24.Davis ID, Chen W, Jackson H, Parente P, Shackleton M, Hopkins W, Chen Q, Dimopoulos N, Luke T, Murphy R, Scott AM, Maraskovsky E, McArthur G, MacGregor D, Sturrock S, Tai TY, Green S, Cuthbertson A, Maher D, Miloradovic L, Mitchell SV, Ritter G, Jungbluth AA, Chen YT, Gnjatic S, Hoffman EW, Old LJ, Cebon JS. Recombinant NY-ESO-1 protein with ISCOMATRIX adjuvant induces broad integrated antibody and CD4(+) and CD8(+) T cell responses in humans. Proc Natl Acad Sci USA. 2004;101:10697–10702. doi: 10.1073/pnas.0403572101. [DOI] [PMC free article] [PubMed] [Google Scholar]
- 25.Wilkinson TM, Li CK, Chui CS, Huang AK, Perkins M, Liebner JC, Lambkin-Williams R, Gilbert A, Oxford J, Nicholas B, Staples KJ, Dong T, Douek DC, McMichael AJ, Xu XN. Preexisting influenza-specific CD4+ T cells correlate with disease protection against influenza challenge in humans. MNature Medicine. 2012;18:274–280. doi: 10.1038/nm.2612. [DOI] [PubMed] [Google Scholar]
- 26.Mitchell AL, Pearce SH. Autoimmune Addison disease: pathophysiology and genetic complexity. Nature reviews. Endocrinology. 2012;8:306–316. doi: 10.1038/nrendo.2011.245. [DOI] [PubMed] [Google Scholar]
Associated Data
This section collects any data citations, data availability statements, or supplementary materials included in this article.


