Abstract
Purpose
Ultrasound is known to overestimate kidney stone size. We explored measuring the acoustic shadow behind kidney stones combined with different ultrasound imaging modalities to improve stone sizing accuracy.
Materials and Methods
A total of 45 calcium oxalate monohydrate stones were imaged in vitro at 3 different depths with the 3 different ultrasound imaging modalities of conventional ray line, spatial compound and harmonic imaging. The width of the stone and the width of the acoustic shadow were measured by 4 operators blinded to the true size of the stone.
Results
Average error between the measured and true stone width was 1.4 ± 0.8 mm, 1.7 ± 0.9 mm, 0.9 ± 0.8 mm for ray line, spatial compound and harmonic imaging, respectively. Average error between the shadow width and true stone width was 0.2 ± 0.7 mm, 0.4 ± 0.7 mm and 0.0 ± 0.8 mm for ray line, spatial compound and harmonic imaging, respectively. Sizing error based on the stone width worsened with greater depth (p <0.001) while the sizing error based on the shadow width was independent of depth.
Conclusions
Shadow width was a more accurate measure of true stone size than a direct measurement of the stone in the ultrasound image (p <0.0001). The ultrasound imaging modality also impacted the measurement accuracy. All methods performed similarly for shadow size while harmonic imaging was the most accurate stone size modality. Overall 78% of the shadow sizes were accurate to within 1 mm, which is similar to the resolution obtained with clinical computerized tomography.
Keywords: nephrolithiasis, lithotripsy, ultrasonography, calculi
STONE size is an important factor in kidney stone management.1–4 In the United States computerized tomography or plain x-ray of the kidneys, ureters and bladder are the preferred options for stone detection and stone size measurement. Although known to overestimate stone size, ultrasound is inexpensive, portable and widely available, and does not expose patients to ionizing radiation. Up to 50% of small stones measured on US can be misclassified as greater than 5 mm.5 This is important as stones greater than 5 mm often require intervention, whereas those smaller than 5 mm may be managed with observation and may pass spontaneously.4 US techniques to improve stone sizing add momentum for greater adoption of US use for the management of kidney stones.6
On US kidney stones appear as hyperechoic objects with a posterior hypoechoic shadow. On-screen calipers are used to determine the stone size by directly measuring the distance across the width of the stone image. Recent literature has shown that system settings and US imaging modality can affect the appearance of the hyperechoic boundaries and, thus, the measured stone size.7 However, the edges of the acoustic shadow do not undergo the same distortion as the hyperechoic stone. In this study we investigated the acoustic shadow width as an alternative measure of stone size. We also explored the effect of the B-mode imaging modalities of conventional ray line, spatial compound, and harmonic imaging on stone and shadow width measurements.
MATERIALS AND METHODS
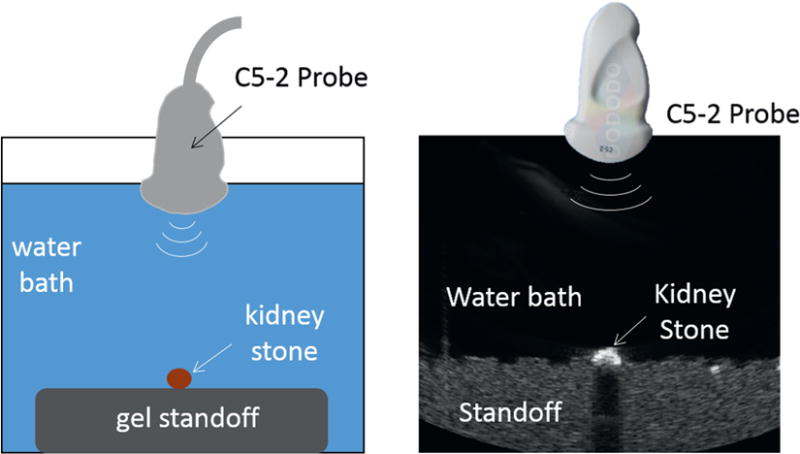
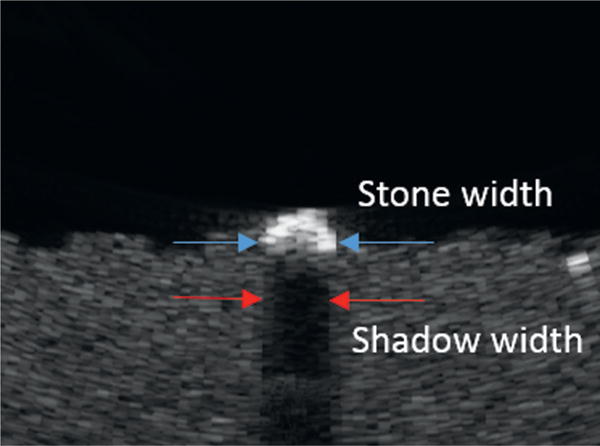
A total of 45 human calcium oxalate monohydrate stones were included in this study. The stones ranged in size from 1 to 10 mm, with an equal number of stones (5) per mm (eg 5 stones 1 to 2 mm, 5 stones 2 to 3 mm etc). Photographs were taken of the stones including a millimeter ruler for reference. The images were uploaded into MATLAB® for determining the true stone size. Each stone was then placed in a water bath, and US images were captured at transducer to stone depths of 6, 10 and 14 cm (fig. 1). From the digital images stone and shadow measurements were made by 4 reviewers blinded to the true stone size (fig. 2). The reviewers included a certified sonographer, 2 physician trainees and an engineer.
Figure 1.

Experimental setup. C5-2 array is used to image kidney stones placed on top of attenuative gel standoff in water bath.
Figure 2.

Stone width and shadow width measurements
Ultrasound Imaging Instrument
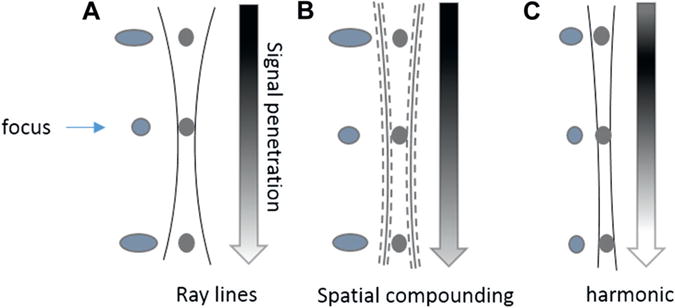
US images were captured with the Verasonics® data acquisition system (VDAS, Verasonics, Inc., Redmond, Washington) using a 128 element C5-2 curvilinear imaging probe (Philips Ultrasound, Bothell, Washington). The 3 B-mode imaging techniques included conventional (ray line) imaging, spatial compound imaging and harmonic imaging. All 3 techniques are available on current ultrasound systems with slight variations in how they are implemented. The primary characteristics that impact stone imaging and sizing are using a focus to enhance the signal-to-noise in a small region (conventional ray lines), averaging multiple image frames together to improve image uniformity (spatial compounding) and changing the frequency to increase image resolution (harmonic imaging). Similarities and differences of the techniques are illustrated in figure 3.
Figure 3.

Beam pattern for 3 imaging modalities. Vertical lines represent beam shape and, thus, resolution, for each of 3 modalities. Gray circles within beam represent stones and blue objects outside beam represent appearance of stone as function of resolution. Arrows represent signal-to-noise where black is high and white is low. In conventional ray line imaging resolution is enhanced at user selectable focus, at sacrifice of pre-focal and post-focal resolution (A). In spatial compound imaging, image uniformity is improved but shadowing can be reduced and stone and shadow boundaries defocused (represented by dotted edges of hourglass shaped beam) by compounding images that have different angles of approach to stone (B). Harmonic imaging is similar to ray line imaging but builds image from higher frequency signals to improve lateral resolution, at sacrifice of signal-to-noise and penetration depth (C). By setting focus much deeper to stone, beam is more uniform across depth.
Conventional Ray Line Imaging
Conventional ray line imaging is the most common US B-mode imaging approach. The resolution is enhanced at the user selectable focus at the sacrifice of the pre-focal and post-focal regions. The hourglass shape in figure 3 illustrates the change in resolution with depth. Placing the focus just proximal to the kidney stone gives the sharpest boundaries between the kidney stone and the surrounding medium.
Spatial Compound Imaging
In spatial compound imaging the uniformity of the image is improved by combining images from multiple angles. The drawbacks are that shadowing can be reduced and the stone and shadow boundaries defocused (represented by the dotted edges of the hourglass shaped beam of figure 3). Rather than construct the individual images from a narrow focused beam (ray lines), we used a plane wave on transmit where all the elements are phased together. This is intended to further improve image uniformity with depth. Because there is no focus, the resolution and signal-to-noise in the region around the stone are not enhanced. For this experiment the image was compounded from 7 plane waves angled evenly from −12 to +12 degrees.
Harmonic Imaging
Harmonic imaging is similar to ray line imaging but builds the image from higher frequency signals to improve the lateral resolution at the sacrifice of signal-to-noise and penetration depth. In addition, by setting a focus much deeper to the stone, the beam is more uniform across depths. For these experiments we transmitted at 2.25 vs 3.2 MHz for ray line and spatial compound imaging, and built the image from the signals received at 4.5 MHz.
Measurement Protocol
The stone was placed in a water bath on top of an agar tissue phantom. The transducer was mounted downward and oriented with the maximum measured width of the stone aligned with the long axis of the probe. Images were captured from all 3 imaging modalities with the transducer at 6, 10 and 14 cm from the stone. The digitized images were then recalled in a random order for the reviewers.
Stone width was measured as the greatest linear distance between the 2 hyperechoic edges. The posterior acoustic shadow width was measured as the distance between the 2 hypoechoic edges approximately 1 cm from the stone. If the stone or shadow was not apparent to the reviewer, no measurement was reported.
Statistical Analysis
The data were analyzed using a linear mixed effects model, with the main effects as the 3 imaging modalities, shadow vs stone measurement, depth and 2-way interactions. Tukey’s method was used to adjust for multiple comparisons of pairwise means. Interobserver variability was assessed using the interclass correlation coefficient, with a coefficient greater than 0.75 indicating excellent reproducibility among measurements.8 Two-sided p <0.05 was considered significant. Statistical analysis was performed using SAS® 9.4.
To determine the degree of misclassification of clinically significant stones the proportion of stones measured as greater than 5 mm when the true size was less than 5 mm was evaluated for each imaging technique. Similarly the proportion of stones that were misclassified as less than 5 mm when the true stone size was greater than 5 mm was determined. Stones with no discernable shadow were automatically assumed to be smaller than 4 mm.
RESULTS
There were 1,620 images of the 45 stones, and 4 reviewers, 3 depths and 3 imaging modalities. The errors in stone and shadow width measurements were statistically similar among users and, thus, the measurements were averaged for reporting here. Measurements that were absent because the stone or shadow could not be identified were omitted from the average.
Stone Width Measurements
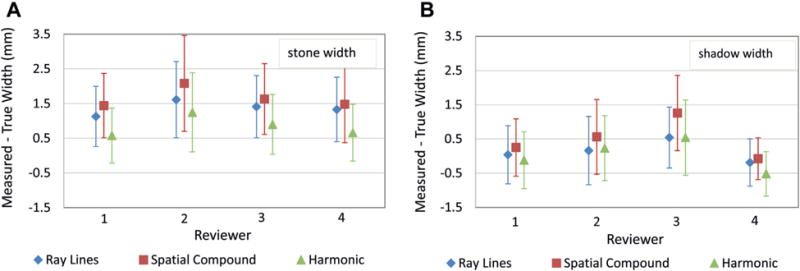
The error in stone size based on stone width measurements averaged over all 3 depths was 1.4 ± 0.8 mm, 1.7 ± 0.9 mm and 0.9 ± 0.8 mm for ray line, spatial compound and harmonic imaging, respectively (fig. 4, A). Stone width measurements overestimated stone size for all stones, depths and modalities. The overestimation was greatest for spatial compound imaging and least with harmonic imaging (p <0.0001). The increase in overestimation with depth was significant across steps for spatial compound imaging and from 10 to 14 cm for ray line imaging. The variability in measurement, as determined by the measurement standard deviation, increased with depth for all 3 imaging methods (p = 0.0002).
Figure 4.

Error ± SD in stone width measurement (A) and shadow width measurement (B) averaged over user and stones. Cases where all 4 reviewers could not make measurement were omitted.
The smallest stones, 1 to 2 mm, were difficult to detect on imaging. A stone width measurement was not reported for 15% (53 of 360) of the images for stones smaller than 3 mm, 48 of which were stones smaller than 2 mm. On average 40% (2 of 5) of the smallest stones in this study could not be identified by at least 1 reviewer using ray line or spatial compound imaging. No stones smaller than 2 mm could be identified by at least 1 reviewer using harmonic imaging. This was even more pronounced at 14 cm depth, where only 1 reviewer was able to identify any stones less than 2 mm regardless of the US imaging modality. A stone width measurement was reported for all images of stones larger than 3 mm.
Shadow Width Measurements
The error in stone size based on the shadow width measurements averaged over all 3 depths was 0.2 ± 0.7 mm, 0.4 ± 0.7 mm and 0.0 ± 0.8 mm for ray line, spatial compound and harmonic imaging, respectively (fig. 4, B). The shadow width was more accurate than stone width (p <0.0001) and the error for the shadow measurement was less than that of the stone measurement in 82% of the cases. The shadow measurement did not worsen with depth and, thus, had improved accuracy compared to measuring the stone width as depth increased. At greater depths blurring of the shadow boundaries increased with the averaging process of spatial compound imaging and visibility of the stone relative to the background tissue decreased with the reduced signal-to-noise of harmonic imaging.
A shadow measurement was not reported for 53% (385 of 720) of the images of stones less than 5 mm. On average the shadow was undetectable by at least 2 users for 80% of stones less than 4 mm (12 of 15). No shadow was detectable by any user for stones smaller than 2 mm. The greatest shadow contrast and most shadow measurements occurred with ray line imaging. A shadow was present for all images of stones larger than 5 mm.
Stone Overclassification and Under Classification
When measuring stone width the overclassification of stones as larger than 5 mm when the true stone size was 5 mm or less varied across depth and modality (see table). At 6 cm depth 3 stones (15%) were overclassified for all modalities. At 14 cm depth 10 stones (50%) were overclassified using spatial compound imaging. Average size overestimation for the misclassified stones was 2.2 ± 0.9 mm. Only 1 stone (5%) was misclassified as smaller than 5 mm when the true stone size was greater than 5 mm.
Table.
Number of stones 5 mm or smaller classified as larger than 5 mm based on stone width and shadow width out of 20
| No. Depth
|
|||
|---|---|---|---|
| 6 cm | 10 cm | 14 cm | |
| Stone width: | |||
| Ray lines | 3 | 4 | 6 |
| Spatial compound | 3 | 4 | 10 |
| Harmonic imaging | 3 | 4 | 5 |
| Shadow width: | |||
| Ray lines | 2 | 1 | 2 |
| Spatial compound | 2 | 3 | 2 |
| Harmonic imaging | 0 | 2 | 1 |
When measuring the shadow width the extent of overclassification also varied with depth and modality, but from zero up to 3 stones (15%) (see table). The average size overestimation for the misclassified stones was 0.8 ± 0.2 mm. Three stones (15%) were under classified as less than 5 mm when the true stone size was greater than 5 mm.
Interoperator Variability
For all 4 reviewers the most accurate measurements were made from the shadow (fig. 5). The error in stone size averaged over all 3 depths and modalities was 0.1 ± 0.9 mm, 0.3 ± 1.0 mm, 0.8 ± 1.1 and 0.2 ± 0.7 mm. In comparison, the error in stone size based on the stone width averaged over all 3 depths and modalities was 1.1 ± 0.9 mm, 1.7 ± 1.3 mm, 1.3 ± 1.0 and 1.2 ± 1.0 mm. Harmonic imaging was the most accurate and spatial compound imaging was the least accurate for each reviewer individually. The minimum intraclass correlation was 0.85 for the harmonic imaging shadow at 14 cm.
Figure 5.

Error ± SD in stone width measurement (A) and shadow width measurement (B) for each reviewer for all 3 imaging modalities. Cases where reviewer could not make measurement were omitted.
DISCUSSION
Stone size accuracy was significantly improved by measuring the acoustic shadow width. Using this technique the average error in stone size was less than 0.5 mm regardless of imaging method or depth. The error in stone size was less than 1 mm for 78% of the measurements vs 38% of the measurements based on stone width. This is similar to the 1.1 mm accuracy of computerized tomography imaging reported by Kishore et al.9 If these results can be replicated in human subjects, it would significantly improve the diagnostic accuracy of stone sizing with US. Use of the stone shadow would be easy to adopt and does not require additional equipment or software modifications to current ultrasound systems.
Similar to previous studies our results show that measuring stone width on US overestimates true stone size and that the extent of overestimation increases with depth.5,7,10 The average overestimation reported previously and here is on the order of 1.5 to 2.0 mm. Conventional ray line imaging is more accurate in measuring stone size than spatial compound imaging, but when measuring the stone directly the most accurate results were with harmonic imaging. However, signal-to-noise is an issue with harmonic imaging at greater depths.
In addition to improving stone size accuracy, the use of the shadow reduced the misclassification of stones as larger than 5 mm. Previously reported data showed more than 50% of potentially passable stones were misclassified.5 Depending on the imaging modality and depth, we found up to 50% misclassified with stone width measurements and only a maximum of 15% misclassified with the shadow width measurement. In our data the lack of shadow alone was an indicator of a stone less than 4 mm in width. An accurate stone measurement is important, especially around 5 mm, as it often affects counseling and decisions about potential treatment.
The results were consistent for all 4 reviewers who performed the measurements. Conventional (ray line) imaging resulted in the highest correlation among the users. Although stone size accuracy was improved with harmonic imaging and by measuring the acoustic shadow, variability increased across the users for these modalities.
Stone size accuracy was further improved in an exploratory analysis by taking the smaller of ray line shadow width or harmonic imaging stone width. With this approach the error in stone size was less than 1 mm for 84% of the measurements. The lack of a stone shadow combined with a ray line stone measurement less than 5 mm was also a reliable indicator of a stone less than 4 mm.
Researchers have suggested subtracting a set value, eg 1.5 to 2 mm, from all US size measurements to establish a more accurate indication of stone size. This approach is not as accurate as the shadow measurement, especially with the change in stone size accuracy with depth and system settings, as illustrated in figure 4.
This study is limited in that this was an in vitro model. It is designed to provide a baseline indication of methods to improve stone size accuracy without the beam diffraction, scattering and attenuation introduced by tissue. It is unclear if imaging through the intervening tissue might decrease the visibility or reliability of the shadow. Efforts are under way to validate the clinical utility of this method in human stone formers. It is expected that the findings across the different imaging modalities, and between stone and shadow, will be consistent in vivo. Only calcium oxalate stones were evaluated but most stones are acoustically similar. Lastly, specific algorithms for conventional ray line imaging, spatial compound imaging and harmonic imaging were used. Although these algorithms are customized across machines, the basic physics are the same and performance should be consistent.
CONCLUSIONS
Direct measure of stone width on US overestimates stone size. Stone size accuracy can be improved by measuring the acoustic shadow. If a shadow was not seen in these data it was a reliable indicator that the stone was smaller than 4 mm. Accuracy and precision were further increased by taking the smaller of the harmonic stone measurement or ray line shadow measurement.
Acknowledgments
Anna McClenny and Jeff Thiel provided assistance and reviewed the data for accuracy.
Supported by the National Institutes of Health NIDDK DK43881 and DK092197, and the National Space Biomedical Research Institute through NASA NCC 9-58. This material is the result of work supported by resources from the VA Puget Sound Health Care System, Seattle, Washington.
Abbreviations and Acronyms
- B-mode
brightness mode
- US
ultrasound
Footnotes
No direct or indirect commercial incentive associated with publishing this article.
The corresponding author certifies that, when applicable, a statement(s) has been included in the manuscript documenting institutional review board, ethics committee or ethical review board study approval; principles of Helsinki Declaration were followed in lieu of formal ethics committee approval; institutional animal care and use committee approval; all human subjects provided written informed consent with guarantees of confidentiality; IRB approved protocol number; animal approved project number.
References
- 1.Coe FL, Keck J, Norton ER. The natural history of calcium urolithiasis. JAMA. 1977;238:1519. [PubMed] [Google Scholar]
- 2.Ueno A, Kawamura T, Ogawa A, et al. Relation of spontaneous passage of ureteral calculi to size. Urology. 1977;10:544. doi: 10.1016/0090-4295(77)90097-8. [DOI] [PubMed] [Google Scholar]
- 3.Sterrett SP, Nakada SY. Medical expulsive therapy. Curr Opin Urol. 2008;18:210. doi: 10.1097/MOU.0b013e3282f51935. [DOI] [PubMed] [Google Scholar]
- 4.Miller OF, Kane CJ. Time to stone passage for observed ureteral calculi: a guide for patient education. J Urol. 1999;162:688. doi: 10.1097/00005392-199909010-00014. [DOI] [PubMed] [Google Scholar]
- 5.Ray AA, Ghiculete D, Pace KT, et al. Limitations to ultrasound in the detection and measurement of urinary tract calculi. Urology. 2010;76:295. doi: 10.1016/j.urology.2009.12.015. [DOI] [PubMed] [Google Scholar]
- 6.Smith-Bindman R, Aubin C, Bailitz J, et al. Ultrasonography versus computed tomography for suspected nephrolithiasis. N Engl J Med. 2014;371:1100. doi: 10.1056/NEJMoa1404446. [DOI] [PubMed] [Google Scholar]
- 7.Dunmire B, Lee FC, Hsi RS, et al. Tools to improve the accuracy of kidney stone sizing with ultrasound. J Endourol. 2015;29:147. doi: 10.1089/end.2014.0332. [DOI] [PMC free article] [PubMed] [Google Scholar]
- 8.Fleiss JL. The Design and Analysis of Clinical Experiments. New York: John Wiley & Sons Inc; 1986. [Google Scholar]
- 9.Kishore TA, Pedro RN, Hinck B, et al. Estimation of size of distal ureteral stones: noncontrast CT scan versus actual size. Urology. 2008;72:761. doi: 10.1016/j.urology.2008.05.047. [DOI] [PubMed] [Google Scholar]
- 10.Fowler KA, Locken JA, Duchesne JH, et al. US for detecting renal calculi with nonenhanced CT as a reference standard. Radiology. 2002;222:109. doi: 10.1148/radiol.2221010453. [DOI] [PubMed] [Google Scholar]


