

Abstract
The P23H-1 transgenic rat carries a mutated mouse opsin gene, in addition to endogenous opsin genes, and undergoes progressive photoreceptor loss that is generally characteristic of human autosomal dominant retinitis pigmentosa (RP). Here, we examined morphological changes correlated with visual function that is comparable to clinical application in the pigmented P23H-1 rat retina as photoreceptor degeneration progressed. We found that rod function was compromised as early as postnatal day 28 and was a good indicator for tracking retinal degeneration. Cone function was normal and did not change until the thickness of the photoreceptor layer was reduced by 75%. Similar to the threshold versus intensity curves used to evaluate vision of RP patients, light-adaptation curves showed that cone thresholds depended on the number of remaining functioning cones, but not on its length of outer segments (OS). By 1 year of age, both rod and cone functions were significantly compromised. Correlating with early abnormal rod function, rods and related secondary neurons also underwent progressive degeneration, including shortening of inner and OS of photoreceptors, loss of rod bipolar and horizontal cell dendrites, thickening of the outer Müller cell processes, and reduced density of pre- and postsynaptic markers. Similar early morphological modifications were also observed in cones and their related secondary neurons. However, cone function was maintained at nearly normal level for a long period. The dramatic loss of rods at late stage of degeneration may contribute to the dysfunction of cones. Attention has to be focused on preserving cone function and identifying factors that damage cones when therapeutic regimes are applied to treat retinal degeneration. As such, these findings provide a foundation for future studies involving treatments to counter photoreceptor loss.
Keywords: P23H mutation, Retinitis pigmentosa, Retinal degeneration, Rod and cone, Visual function
Introduction
There are a number of rodent models of human retinal diseases in which photoreceptors are lost at widely different rates (Dowling & Sidman, 1962; Pittler & Baehr, 1991; Humphries et al., 1997; D’Cruz et al., 2000; Machida et al., 2000; Zhang et al., 2001; Chang et al., 2002; Ambati et al., 2003; Zeiss et al., 2010). Much of the earlier work focused on photoreceptor changes only and excluded inner retinal modifications. Recently, there is a growing base of literature showing that several phases of change affect the inner retina, including early atrophy and late sprouting of neural processes and secondary vascular changes that lead to retinal laminar disruption and migration of cells beyond their usual compartment (Strettoi et al., 2002; Marc et al., 2003; Cuenca et al., 2004; Pignatelli et al., 2004; Wang et al., 2005a; Strettoi et al., 2010).
Although there are similarities among different animal models, there are also substantial differences. These differences raise the question about defining pathognomonic morphological features in different models, which are likely to be important indicators in the progress of specific human retinal degenerative diseases. Examining structure/function correlation in the various animal models and defining morphological features that may serve as limiting factors for specific functional parameters are an important goal. In particular, it is important to know when rescues with growth factors and gene- and cell-based therapies are compromised by second-order changes. For example, in any attempt to reconstruct the lost photoreceptor layer, will there be a particular time point at which the inner retina is no longer able to respond to a new input layer? This issue has been raised a number of times. Our previous study has shown that atrophied bipolar cell dendrites may sprout in response to a new photoreceptor layer; but this was a preliminary observation examining intervention at a single time point (Kwan et al., 1999).
To address these questions, it is important to examine a number of different mutant or transgenic animals with different rates of degeneration or different etiology and associated histopathology, especially to evaluate visual function with the similar technique as that used in retinitis pigmentosa (RP) patients. The Royal College of Surgeons (RCS) rat has been our primary model for investigating the morphological and functional changes and for evaluating treatment with cell-based therapies. The RCS rat harbors a mutation in the Mertk gene resulting in defective phagocytosis of photoreceptor outer segments (OS) by the retinal pigment epithelium (RPE) (Dowling & Sidman, 1962; D’Cruz et al., 2000; LaVail, 2001). This leads to retinal degeneration accompanying inner retinal changes and neovascularization (Villegas-Perez et al., 1998, Wang et al., 2003). We have shown that subretinal injection of RPE cells, Schwann cells, mesenchymal stem cells and neural progenitors at an early stage of the disease can substantially slow down vision loss (Lawrence et al., 2004; Wang et al., 2005b; Gamm et al., 2007; Wang et al., 2008; Lu et al., 2009; Lu et al., 2010). In addition, the secondary pathological changes are also largely limited in the graft-protected retinal area. Intervention at a later time still has efficacy but is not as effective as the early grafts, emphasizing that early intervention is the key to successful treatment.
As part of the requirement to ensure suitable time frames are used for intervention, it would be useful to characterize anatomical markers that may indicate functional changes. It is critical to evaluate functional changes with technique that is comparable to clinical application. Here, we investigated the P23H-1 rat; an animal model of autosomal dominant retinitis pigmentosa (adRP) caused by a mutation in the rhodopsin gene that changes a histidine to proline at codon 23 (Lewin et al., 1998). This mutation affects approximately 12% of patients with adRP in the U.S. population (Dryja et al., 1990; Berson et al., 1991a). The use of pigmented animals, heterozygous for the mutation in the rhodopsin gene, more closely resembles the human disease state than albino homozygous animals or is essential for some studies, such as transplantation, behavioral and some electrophysiological analyses (Leonard et al., 2007). We present data correlating the morphological findings with functional changes by measuring light-adaptation curves using our published protocol (Girman et al., 2005). The light-adaptation curves have striking similarities to the threshold-versus-intensity curves used to evaluate RP patients (Westheimer, 1967; Latch & Lennie, 1977; Sandberg & Berson, 1983; Jacobson et al., 1986; Sandberg et al., 2008).
Materials and methods
Animals
To produce a pigmented heterozygous P23H-1 rat, the homozygous P23H (line 1) albino rat strain (http://www.ucsfeye.net/mlavailRDratmodels.shtml) was backcrossed with Long Evans (LE) (Charles Rivers). The first generation of their offspring was used in this study. For comparison purposes, we used LE rats as controls. All rats were bred and reared in our animal laboratory and kept on a 12/12-h light/dark cycle. These studies were conducted with approval of the Institutional Animal Care Committee at the University of Utah; every procedure conformed to the National Institutes of Health guidelines.
Light adaptation study
The functional state of the retina in P23H-1 rats of different ages was evaluated by recording the multi-neuronal responses in the superior colliculus (SC) of anesthetized rats to focal, located in their receptive field, visual stimulation. We measured the luminance of the stimulating light spot eliciting minimal responses (luminance threshold) versus the increasing brightness of the whole visual field (background illumination, BI), by which the light-adaptation curves were created (Girman et al., 2005). To achieve a fully dark-adapted state, experimental animals were kept in complete darkness for at least 15 h before testing. All preparations were done under dim red light. These recordings were made in the pigmented P23H-1 rats of different ages: postnatal day (P) 28, P60, P180 and P360. To compare with normal controls, similar recordings were made in the LE rats at P60 and P360.
Morphological studies
For morphological examinations, P23H-1 rats were studied at the following ages: P21 (n = 3), P40 (n = 3), P60 (n = 3), P90 (n = 3), and P180 (n = 3). LE rats at P21 (n = 3), P40 (n = 3), P90 (n = 3), and P180 (n = 3) were used as controls. Rats were overdosed with sodium pentobarbital and perfused with phosphate buffered saline (PBS). The superior pole of each eye was marked with a suture to maintain orientation, and eyes were removed and immersed in 4% paraformaldehyde in PBS for 1 h before infiltrating with sucrose. Horizontal retinal sections were cut at 10-μm thickness on a cryostat. One set of sections was stained with cresyl violet for assessing the general retinal lamination. The primary antibodies used in this study are summarized in Table 1. Secondary antibodies were anti-mouse or rabbit IgG conjugated with FITC or Cy3 (Jackson Laboratories, INC). The immunocytochemistry protocols were used with our published protocol (Wang et al., 2005a); both P23H and LE retina were processed under the same condition. Confocal images were obtained from projections of eight single frames. TIFF images were produced using Adobe Photoshop software (Adobe).
Table 1.
Sources and working dilutions of antibodies used in this study
| Antigen | Antiserum | Working dilution | Source |
|---|---|---|---|
| PKCα | Rabbit anti-PKCα | 1:1000 | Sigma |
| Rhodopsin | Mouse anti-rhodopsin | 1:1000 | Dr. Molday, The University of British Columbia |
| Recoverin | Mouse anti-recoverin | 1:2000 | Dr. McGinnis, University of Oklahoma |
| Recoverin | Rabbit anti-recoverin | 1:5000 | Dr. McGinnis, University of Oklahoma |
| Calbindin | Rabbit anti-calbindin | 1:1000 | Swant, Marly, Switzerland |
| Parvalbumin | Rabbit anti-parvalbumin | 1:3000 | Swant, Marly, Switzerland |
| Vimentin | Mouse anti-vimentin | 1:1000 | Dako, Carpinteria, CA |
| Neurofilaments | Mouse anti-RT97 | 1:1000 | Dr. Morris, University of London |
| Cone arrestin | Rabbit anti-LUMIJ | 1:500 | Drs Zhu and Craft, University of Southern California |
| PSD-95 | Mouse anti-PSD-95 | 1:1000 | Millipore, Billerica, MA |
| Bassoon | Mouse anti-bassoon | 1:2000 | Stressgen, British Columbia, Canada |
| MGluR6 | Rabbit anti-mGluR6 | 1:2000 | Neuromics, Edina, MN |
Quantitative analysis
Nine retinal confocal images (from three animals at each experimental time point) near the optic nerve were taken for quantitative analysis. Micrographs were taken under a 40× oil immersion objective and enlarged using Adobe Photoshop. The length of OS, inner segments (IS) and axons (AX) of cone photoreceptors was measured in antibody cone arrestin-stained sections (10 cells/section, a total of 90 cones/time point). The densities of immunofluorescent puncta of bassoon, mGluR6 and PSD95-positive profiles were measured in the following way: micrographs were taken with 40× objective, enlarged using Photoshop. The number of puncta or profiles per 100 μm2 was counted. Three areas of 100 μm2 were selected for analysis from each side of the optic nerve for each image; a total of 36 areas of 100 μm2 were calculated for statistical analysis. The Student’s t-test was used to compare paired data from transgenic and age-matched control rats. The measurements of cones and the number of puncta or profiles of immunofluorescence were expressed as average ± S.D. (standard deviation). Data across ages were analyzed with the Kruskal–Wallis test.
Results
Neuronal changes
There was a progressive reduction in the thickness of the outer nuclear layer (ONL) in the P23H-1 retina compared with LE controls (Fig. 1A), the ONL was 10 cells thick at P21, 8 cells at P40, 5–6 cells at P60, 3–4 cells at P90, and 2–3 cells at P180 (Figs. 1B–1F). Retinal lamination order was maintained throughout the time points; however, both the inner plexiform layer (IPL) and the outer plexiform layer (OPL) became thinner with age. Like in the LE retina (Fig. 2A), rhodopsin staining was limited to OS in the P23H-1 retina up to P180 (Fig. 2B), no cell body staining was seen, which has been observed in other retinal degeneration models (Nir & Papermaster, 1989; Wang et al., 2005a). Both IS and OS became shorter and more disorganized with age as revealed by antibodies against recoverin and cone arrestin. In the LE retina (Fig. 2C), recoverin antibody stained ONL, OS, IS and ON cone bipolar cells (ON cone-BPCs, arrows in Fig. 2C). Although in the P23H-1 retina at P180 (Fig. 2D), ONL was reduced to 2–3 cells thick with disorganized IS and OS.
Fig. 1.

Retinal sections stained with cresyl violet. (A) Normal control LE retina at P90 showing the lamination of normal retina. (B–F) The ONL degenerated progressively in the P23H-1 retina: 10 cells thick at P21 (down pointing arrows), 8–9 layers at P40 (C), 4–5 layers at P60 (D), 3–4 layers at P90 (E), and 2–3 layers at P180 (F). The retinal lamination was maintained orderly through the experimental time points (Scale bar = 20 μm).
Fig. 2.
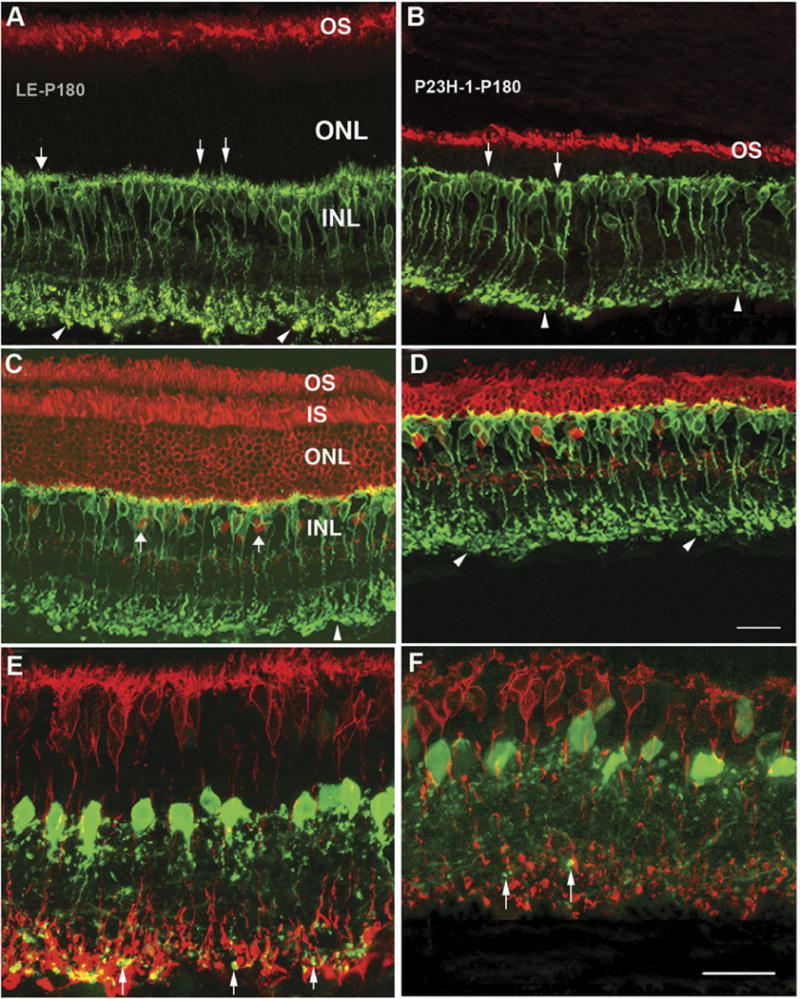
Confocal images from LE control (A, C, and E) and P23H-1 retinas (B, D, and F) at P180. Like in the LE retina (A), the rhodopsin positive OS were still evident in P23H-1 retina (B). There was reduction of OS, IS and the thickness of photoreceptor layers in P23H-1 retina as revealed by recoverin staining compared with LE control (red, D vs. C). The rod-BPCs revealed by PKCα (green) in P23H-1 retina were very different from the LE control (B and D vs. A and C): the dendrites were flatter and shorter (arrows), the axonal terminals were greatly reduced in density and complex (arrowheads); AX were also shorter. The lobular appendages of AII amacrine cells revealed by antibody against parvabumin (green) were reduced in density in P23H-1 retina (up pointing arrows) compared with the LE control (F vs. E) (scale bars = 20 μm).
The rod-bipolar cells (rod-BPCs) are the unique output cells of rod photoreceptors. As rods are lost, rod-BPCs also undergo modifications: at P21, their dendrites were no longer candelabra-like and were shorter compared with LE controls. With age, the majority of rod-BPCs lost their dendrites, and their AXs were also greatly reduced in length and their terminal varicosities were smaller (Figs. 2B, 2D, and 2F) compared with LE controls (Figs. 2A, 2C, and 2E).
AII amacrine cells are interneurons that pass the rod signal from rod-BPCs to cone-BPCs. We used an antibody against parvabumin to specifically label AII amacrine cells (Wassle et al., 1993, 1995). In the LE control retinas (Fig. 2E), AII amacrine cell bodies were located at the inner margin of the inner nuclear layer and a single stout primary dendrite descended into the IPL where it gave off several side branches as it ran toward the ganglion cell layer (GCL). The lobular appendages in the outer third of the IPL originated from the soma and the primary dendrite. Early changes were not obvious in the P23H-1 retina. However, at P180, the intensity of amacrine immunofluorescence was decreased in both the lobular appendages and the GCL, compared with the LE controls (Figs. 2E vs. 2F).
Cone photoreceptors also underwent progressive changes compared with age-matched LE controls. Cone photoreceptor, revealed by labeling for cone arrestin, has a short OS, a fat IS, a long AX and large axonal terminals (Fig. 3A). The cone terminal, called a cone pedicle (CP), has numerous invaginations each representing a site of glutamate output onto postsynaptic BPC dendrites. In the P23H-1 retina, noticeable changes at P21 including shortening of both OS (16.61 ± 4.36 vs. 19.54 ± 3.58) and AXs (48.95 ± 8.25 vs. 67.38 ± 5.09) and a reduction in size of the pedicles accompanied by fewer fine processes (Fig. 3B) were observed. From P40 (Fig. 3C) to P60 (Fig. 3D) and P90 (Fig. 3E), cone AX were greatly reduced in length (from 48.95 ± 8.25 at P21 to 6.53 ± 2.68 at P90), there were significant differences between P21 and P90 (P < 0.0001, n = 90, t-test) and age-matched LE controls (78.02 ± 12.81 at P90) (P < 0.0001, n = 90, t-test). Both IS and OS became shorter, and CPs decreased in size and complexity with age (Figs. 3H vs. 3G). At P180 (Fig. 3F), IS and OS were very short and disorganized, some cones had no AX or IS and OS; and CPs became even smaller and flatter, directly abutting cone cell bodies (Fig. 3F and Table 2).
Fig. 3.

Retinal sections from LE (A and G) and P23H-1 (B–H) eyes stained with cone arrestin. (A) Cone photoreceptors in the LE retina at P90: both IS and OS, AX and CPs were clearly labeled. (B) In the P23H-1 retina at P21, IS, OS and AX were shorter; the CPs were smaller compared with the LE control. With ages, OS and AX became shorter and shorter as seen in P40 (C), P60 (D) and P90 (arrows in D and E). At P180 (F), both OS and AX were even shorter or lacked AX; the IS were flatter, and the CPs were smaller and lacked puncta staining. (G) High-power image showing the CPs with puncta staining (arrows) in the LE retina at P90, while the CPs were smaller and lacked puncta staining (arrows in H) in the P23H-1 retina at P90 (abbreviation: OS: outer segments; IS: inner segments; AX: axons of cone; CPs: cone pedicles; scale bars = 20 μm).
Table 2.
Measurements were taken from cone arrestin stained sections, a total of 90 cones were measured using Image-plus program. The lengths were expressed as average ± S.D
| AX (μm) | OS (μm) | IS (μm) | |
|---|---|---|---|
| Cone (LE, P90) | 78.02 ± 12.81 | 19.91 ± 3.11 | 34.75 ± 9.19 |
| Cone (P23H-1, P21) | 48.95 ± 8.25 | 16.61 ± 4.36 | 34.52 ± 6.01 |
| Cone (P23H-1, P40) | 38.19 ± 8.53 | 12.51 ± 3.39 | 28.44 ± 6.68 |
| Cone (P23H-1, P90) | 6.53 ± 2.68 | 6.87 ± 2.90 | 24.35 ± 8.23 |
| Cone (P23H-1, P180) | 3.74 ± 2.76 | 2.69 ± 1.00 | 16.24 ± 5.18 |
Horizontal cell (HC) contacts both rod and cone photoreceptors, so it is not surprising they are affected by photoreceptor degeneration. There is one single type of HCs in the rodent retina. HC has a dendritic arborization arising from the cell body that is postsynaptic to cone terminals and an extensive axonal arborization connected to the cell body by a thin AX that is postsynaptic to rods. The AX of HC can be labeled with an antibody against neurofilament (RT-97) (Fig. 4A, upward arrows), and cell body and dendrites can be labeled with a calbindin D antibody (Fig. 4A, white triangles). Already by P21, calbindin D staining of HC dendrites revealed fewer, though larger dendritic tips (data not shown); at P40 (Fig. 4B, white triangles), the density of labeled HC dendritic tips was further reduced; and by P90 (Fig. 4C), both dendritic tips and axonal arborization had clearly reduced immunofluorescence. At P180, the dendritic arborization was further reduced; the AX band became much thinner, and some HC processes were growing outside the OPL, toward the outer and inner retina (left pointing arrows in Fig. 4D); HC bodies had also become displaced and moved toward the outer retina.
Fig. 4.

Confocal images from retinal sections (A–D) double stained with antibodies against neurofilament (red, for HC AX) and calbindin (green, for HC body and their dendrites). (A) LE retina at P90 showing the normal staining patterns of HC bodies, AX (up pointing arrows) and dendrites (white triangles). (B–D) In P23H-1 retinas, the HCs showed progressive changes with age: at P40, the dendrites of HCs were reduced in density (white triangles). Both AX and dendrites were further reduced in density at P90; cell body (up pointing arrow) and AX (left pointing arrow) were facing to inner retina, and the dendrites (white triangles) were also dramatically reduced in staining at P180. (E and F) Retinal section double stained with antibodies against vimentin (red, for Müller glia) and calbindin (green, for horizontal and amacrine cells). The processes of Müller glia cells were arrayed perpendicularly from the inner limiting membrane to part of the outer limiting membrane in the LE retina (E). In the P23H-1 retina at P180, there was distortion of the orderly array of Müller glia processes (double arrows) and thickened and disorganized outer Müller cell processes (scale bars = 20 μm).
Müller glial and vascular changes
Müller cells are the major supporting cells in the retina and can be revealed with an antibody to vimentin (Li et al., 1993, Sheedlo et al., 1995, Harada et al., 2000). In the LE retina, vimentin immunofluroescence reveals the typical morphology of Müller cells: their processes span the entire retina and form the inner and outer limiting membranes. Up to P60, Müller cells showed no obvious morphological change; however, the outer processes were evidently thicker and disorganized by P90 (data not shown). At P180, both inner and outer processes had thickened further and were disorganized compared with LE controls (Figs. 4E vs. 4F). It is noted that the thickness of retina was also dramatically reduced in the P23H-1 retina at this age. Up to P180, abnormal vascular changes were not observed in the P23H-1 retina (data not shown).
Changes in markers of connectivity and neurotransmitters
It has been shown that pathological changes in the retina cause redistribution and deaggregation of transmitter receptors (Chua et al., 2009). Thus, it was important to investigate the expression level and clustering of different receptors in the P23H-1 retina during the course of photoreceptor degeneration.
Presynaptic protein
Staining for synaptic ribbon protein, bassoon appeared as a dense band of punctate immunofluorescence in the OPL of the LE retina (Fig. 5A), whereas smaller puncta were distributed throughout the IPL with 3–4 bands of higher density (not shown). At the higher magnification in the OPL (Fig. 5F), the characteristic crescent shape of synaptic ribbons in rod terminals could be clearly discerned, while smaller puncta were associated with cone terminals, consistent with the smaller dimension of cone synaptic ribbons. In the P23H-1 retina, bassoon staining in the OPL was noticeably reduced in density even at P21, especially the rod-associated staining-between CPs (Fig. 5B). By P40, the bassoon-positive band was less dense compared with that at P21; clear gaps were seen between CPs (Fig. 5C), indicating loss of rod terminals. By P90, the bassoon staining became discontinuous (Figs. 5D and 5G). Retinal section double-stained with cone arrestin and bassoon showed that the puncta of bassoon staining were reduced in density, even around CPs (Figs. 5D and 5G), indicating a loss of normal active zones within cone terminals. At P180, there were only a few dispersed immunoreactive dots around CPs (Fig. 5E).
Fig. 5.

Retinal section double stained with antibodies against cone arrestin (red) and bassoon (green, for presynaptic protein). (A) Cone arrestin staining revealed the whole profile of cone photoreceptors (arrows indicating CPs) and bassoon staining revealed presynaptic protein in the cone (yellow) and rod terminals (green) in the LE retina at P90. (B–E) P23H-1 retina at P21, P40, P90 and P180, respectively. Bassoon staining became discontinuous with age and there were gaps among CPs. At P180, bassoon staining was mainly around CPs (white triangles in E) indicating loss of presynaptic protein in the rod terminals. (F and G) High power images showing CPs (arrows) and puncta staining of bassoon (triangles) in LE control (F) and P23H-1 (G) at P90. The density of bassoon-positive puncta staining was greatly reduced, even around CPs in P23H-1 retina, indicating loss of presynaptic protein in both rod and cone terminals (scale bars = 20 μm).
Metabotropic glutamate receptor 6
Metabotropic glutamate receptor 6 (mGluR6) is localized to the dendritic tips of rod- and cone ON-BPCs (Vardi & Morigiwa, 1997; Vardi et al., 1998, 2000). In the LE retina, mGluR6 immunofluorescence has two configurations in the OPL: one is continuous puncta in the outer OPL corresponding to the dendritic tips of rod-BPCs contacting rod spherules; and the other is clusters of immunofluorescence (up pointing arrows), each cluster representing the tips of multiple ON-cone BPC dendrites invaginating into a single CP located at the inner border of the OPL (Fig. 6A). Obvious reduction of mGluR6 staining especially that associated with rod-BPC dendrites was seen at P90 in the P23H-1 retina (Fig. 6B). Section double stained for bassoon and mGluR6 showed that the pairing of mGluR6 and bassoon became less obvious in P23H-1 retina as compared with LE controls. Counting mGluR6 immunofluorescence spots from 36 areas of 100 μm2 revealed that there was a significant reduction in mGluR6 immunofluorescence spots in the P23H-1 retina at P90 compared with age-matched LE controls (14.05 ± 4.91 vs. 33.4 ± 4.87, P < 0.0001, n = 36, t-test). By P180, mGluR6 immunofluorescence was discontinuous and cell body staining was clearly evident (Figs. 6D vs. 6C).
Fig. 6.

Confocal images showing mGluR6 (red) and PKCα (green) staining in the LE control and P23H-1 retinas at P90. In the LE retina (A), the continuous puncta in the outer OPL correspond to the dendritic tips of rod-BPCs (down pointing arrows), while the cluster in the inner border of the OPL represented the tips of multiple ON-cone bipolar dendrites invaginating into a single CP (up pointing arrows). In the P23H-1 retina (B), mGluR6 staining in the OPL was greatly reduced compared with LE control (B vs. A); and dislocation of mGluR6 in the cell bodies (right pointing arrows) was clearly evident (B). (C–D) Retinal section doubly stained with bassoon (green) and mGluR6 (red). In the LE retina (C), bassoon staining was paired with mGluR6 (arrows); while in the P23H-1 retina (D), there was progressive loss of both staining; and the pairing of mGluR6 and bassoon was less clear, the density was reduced and prominent cell body staining of mGluR6 was observed at P180. (E and F) Retinal section double stained with PSD-95 (green) and cone arrestin (red). The PSD-95 staining was staggered irregularly (triangles) and localized in the rod terminals in the LE retina (E); while in the P23H-1 retina, there was a dramatic reduction on the PSD-95 staining at P180 (arrows pointing CPs) (scale bars = 20 μm).
Postsynaptic density protein 95
Postsynaptic density protein 95 (PSD-95) is a component of the submembrane cytoskeletal network in photoreceptor terminals (Koulen et al., 1998). At other synapses in the central nervous system (CNS), it is a component of the postsynaptic density, but at photoreceptor terminals, it is localized presynaptically. In the LE retina, PSD-95 immunofluorescence was concentrated around the plasma membrane of rod spherules, which has a diameter of 1–2 μm and is staggered irregularly at the outer margin of the OPL. On section double stained with cone arrestin and PSD-95, there was little PSD-95 staining associated with CPs (Fig. 6E). In the P23H-1 retina, even at P21, the density of PSD-95 immunofluorescence was reduced compared with age-matched LE controls. By P40, PSD-95 positive staining formed a band of 1–2 layers, indicating clear loss of rod photoreceptor spherules. At P90, PSD-95 immunoreactivity was dramatically reduced compared with age-matched LE controls (4.95 ± 1.5 vs. 13.95 ± 2.84; P < 0.0001, n = 36, t-test). By P180, the PSD-95 staining was further reduced to a discontinuous layer (Fig. 6F).
Light adaptation
Light-adaptation curves recorded from the SC are very similar to the threshold versus intensity (TVI) curves used to evaluate vision in RP patients (Sandberg & Berson, 1983). In normal LE rats, the light-adaptation curves did not change from P60 to P360. Thresholds recorded at an “indefinite” BI point had minimal values equal to −3.5 log cd/m2. Thresholds started to increase at BI level of around −7.5 log cd/m2, elevated slowly as the BI increased up to −3 log cd/m2, and then showed rapid linear changes up to the brightest BI of −1.8 log cd/m2 tested in this study (Fig. 7). When the BI was −3 log cd/m2, the threshold also increased nearly 1 log cd/m2 (from −3.5 log cd/m2 to 2.5 log cd/m2). The light-adaptation curves recorded in the P23H-1 rats were very different from LE controls. Even at P28, the absolute dark-adapted threshold (−2.5 log cd/m2) was elevated by approximately 1 log unit. The thresholds were remained unchanged while the BI increased to approximately −4.5 log cd/m2 (flat branch of the light-adaptation curve at low levels of BI); while the thresholds started to elevate when the BI reached approximately −7.5 log cd/m2 in the LE rat. Thus, ambient light started to elicit light adaptation in the P23H-1 retina only when BI was around 3 log units (i.e., 1000 times) brighter than that elicited light adaptation in the normal LE retina. With age, the light-adaptation curves elevated slowly up to P180, which means there was little change of the light-adaptation curves from P28-P180. Until P360, the light-adaptation curves showed significant elevation (over 1 log cd/m2). The absolute dark-adapted threshold was about −1.25 log cd/m2 compared with −2.5 log cd/m2 at P28.
Fig. 7.

Light-adaptation curves recorded in P23H and LE rats of different ages. The minimal brightness of the flashing spot (3° in diameter) at which the multineuronal responses in the SC still are recordable is plotted versus the brightness of the background (whole-field illumination). On the left side of the vertical dotted line is the scotopic branch; the photopic branch is on the right side. In the P23H-1 rat, the absolute dark-adapted threshold was elevated by approximately 1 log unit even at P28. Rod function (scotopic branch) was clearly compromised at the early stage; however, the degeneration progressed slowly over the next several months (up to P180). Cone function (photopic branch) was nearly normal up to P180. At the advanced age (P360), both photopic and scotopic branches were elevated significantly compared with normal controls, indicating both cone and rod functions were severely compromised.
The difference in thresholds between LE and P23H diminished with BI increase, when BI increases to approximately −1.7 log cd/m2, the curves almost converged. Thus, at bright background, the test-flash response thresholds between LE and P23H rats differed much less than that at dim background.
Figure 7 showed that up to P180, the photopic branch of the light-adaptation curves in the P23H-1 rats showed no obvious changes relative to that in control LE rats. At P360, the photopic branch showed significant elevation, increasing over 1 log cd/m2. This result indicated that rod function in the P23H-1 rat was clearly compromised as early as P28, but deteriorated very slowly over the next several months. Cone function was maintained quite normally for a long time. However, in the older P23H-1 rats (P360), both rod and cone functions were significantly comprised.
Discussion
We have quantified morphological modifications as photoreceptor degeneration progresses in the pigmented P23H-1 rat. This model is heterozygous for the mutation in the rhodopsin gene, which closely resembles the human disease state. The functional evaluation by measuring light-adaptation curves is comparable to the TVI curve used in examining vision of RP patients. There were early changes in rods and rod-related pathways, which were correlated with early impaired rod function as revealed by light-adaptation curves. Thus, rod function was a good indicator for tracking retinal degeneration during the early stage of the disease. Although clear anatomical changes on cones and cone-related pathway were observed at the early stage of retinal degeneration, cone function was maintained at relatively normal levels up to P180, at which point the ONL was reduced by 75%; and the length of IS, OS and AX of cones were reduced significantly compared with that in the early time points. Attention has to be focused on preserving useful cone vision and identifying factors that damage cones during application of therapeutic regimes for retinal degeneration.
Inner retinal modifications as photoreceptors degenerate
The inner retinal modifications as photoreceptors degenerate in the P23H-1 retina are remarkably similar to those reported in other models of retinal degeneration, such as rd10, rd1 mice (Strettoi & Pignatelli, 2000; Strettoi et al., 2002; Jones et al., 2003; Cuenca et al., 2004), and crx-null mice (Pignatelli et al., 2004). Therefore, this form of remodeling/modification is a hallmark of the secondary effects of photoreceptor death, independent of the underlying genetic defect and the affected species. In fact, these pathological changes are also observed in RP patients: these include RPE cells migrating along blood vessels, forming the typical “bone spicule” and loss of retinal ganglion cells (RGC) (Milam et al., 1998; Humayun et al., 1999). However, the presence of an undigested OS tip-debris zone was observed only in the RCS rat, as was the sprouting of processes from HCs, rod-BPC dendrites, and Müller glia. As we reported previously, the sprouting was pronounced when the debris zone was present and absent when the debris zone was disappearing (except for HCs; Wang et al., 2005a). How the existence of a debris zone relates to neuronal sprouting is presently unclear. We did not observe loss of RGC associated with vascular pathology up to P180; however, a study in P23H-1 albino rats (which display faster degeneration) has revealed that RGC showed their first symptoms of degeneration at P180 and a significant loss at 1 year of age (Garcia-Ayuso et al., 2010). Like in the RCS rats and rd mice (Villegas-Perez et al., 1998; Wang et al., 2000; Wang et al., 2003), the RGC loss in the P23H-1 is also due to displaced inner retinal vessels that dragged and strangulated their axons.
Correlation between morphological modifications and visual function
The deterioration of rod and cone function tested by measuring light-adaptation curves followed a sequential pattern. The compromised rod function was detected at P28 and then deteriorated slowly until P180. Cone function was maintained at the normal level until P180; however, both rod and cone functions were severely damaged at advanced stage (P360). Rod threshold at P28 was elevated by about 1 log cd/m2 and did not change at BI increments up to −4.5 log cd/m2, while in the LE rat, thresholds started to elevate when the BI reached −7.5 log cd/m2. Thus, ambient light started to elicit light adaptation in the P23H-1 retina when the BI is 1000 times brighter than that which elicits light adaptation in the normal LE retina. Morphologically, there was progressive rod loss with age; the secondary neurons connected with rods also underwent early modifications, such as shorter dendrites of rod-BPCs, reduced dendritic tips of HCs, reduced density of rod-associated presynaptic protein, bassoon (Fig. 5B), and PSD-95 staining in the OPL. These early morphological changes correlated well with early compromised rod function. This early loss of rod transmission has a counterpart in a study of P23H albino rats where an early loss of glutamergic transmission has been reported (Marc et al., 2007). However, further threshold elevation was very slow over the next several months. Therefore, the dramatic morphological changes were not reflected by rod functional measurements, indicating there was a compensatory mechanism acting in the visual pathway. Like the changes in rods, cone photoreceptors also underwent progressive modification with age (Figs. 3B–3F). Even at P21 (Fig. 3B), cones already showed differences from the LE control; both IS and OS were shorter, and the CPs were also smaller. However, the light-adaptation curves showed that retina response to the bright background (−1.7 log cd/m2) was almost the same as the LE retina, and presumably cone function was maintained normally. At P180, both IS and OS were very short and disorganized, some cones had no AX or IS and OS, and CPs became even smaller and flatter directly abutting cone cell bodies (Fig. 3F and Table 2). In addition, cone-related secondary neurons and transmitters also underwent progressive modifications with age. Light-adaptation curves were still maintained at levels similar to that at P28. The disparity between the morphological and functional data suggests that some compensatory mechanism is acting on photoreceptors to stabilize the visual threshold despite the progressive retinal degeneration. The functional data revealed in the current light-adaptation study is in agreement with the result of electroretinogram (ERG) studies in the P23H-1 rat (Machida et al., 2000, Machida et al., 2008), showing that the b-wave threshold remained almost constant despite progressive ONL thinning and OS shortening. Photopic b-wave in the P23H-1 rat was normal until the ONL thinned beyond 50%. Our light-adaptation curve revealed that the photopic branch was comparable to normal LE rats at P180 when the ONL was reduced to 25% with obvious abnormal morphological changes of cones. The light-adaptation curves presented here are in good agreement with reports from Sandberg and Berson in RP patients (Sandberg & Berson, 1983). They reported that cone increment threshold depended on the number of remaining functioning cones (cone spatial density) but not on their OS length (cone optical density). Reduced cone spatial density is a major determinant of reduced visual acuity in RP. Our histological results indicated that the number of cones remained unchanged, but OS length was significantly reduced at P180 compared with the early time points.
It is interesting to note that cone function was not affected until the rod number was significantly reduced. The slow rod degeneration with initially normal cone function in the P23H-1 transgenic rat is consistent with clinical findings in P23H patients. An abnormal ERG is an early clinical manifestation in patients even without subjective clinical symptoms (Berson et al., 1991a; Berson et al., 1991b; Heckenlively et al., 1991; Sung et al., 1991).
An interesting observation from our current light-adaptation curves demonstrated that the threshold response to a flashing spot was elevated by approximately 1 log unit, whereas the BI at which the responses start showing adaptation increases by around 3 log units in the P23H-1 rat as compared with normal LE controls. Focal response (to the flashing spot) is mediated mainly by radial connections, and adaptation to the whole-field illumination is mediated by tangential (horizontal) intraretinal connections. If so, this suggests that radial connections are more resistant to functional loss with age than the horizontal connections.
It should be noted that we cannot separate responses that only came from rods or cones due to technical limitations. The inflexion point to divide mesopic and photopic branches is only speculative. We could presume that it is mainly rod responses under mesopic condition as cone responses are the main contributors on the photopic branch.
Preservation of cone vision
The mechanism of late cone dysfunction is not totally clear but is marked by abnormal expression of calbindin, cone arrestin, and cytochrome oxidase was associated with shortening of cone OS and cone dysfunction in aged human RP retinas (John et al., 2000; Zhang et al., 2003). It has been suggested that the spread of the disease from dying rods to genetically normal cones is a form of “bystander” effect, mediated by the gap junctions between rods and cones (Ripps, 2002). It has also been suggested that cones suffer from oxidative damage due to decreased oxygen consumption by rods or the loss of rod-derived cone survival factor as proposed by Sahel’s group (Leveillard et al., 2004; Chrysostomou et al., 2008; Lambard et al., 2010; Leveillard & Sahel, 2010). In their latest study (Yang et al., 2010), they showed that subretinal transplants of photoreceptors or total neural retina into P23H-1 rats significantly preserved cone function as scored by photopic ERG recording. Cones can be functional for a long term when animals were maintained under ambient conditions (Chrysostomou et al., 2008), reinforcing the light-regulated damage. Furthermore, a recent study found that dystrophic Xenopus laevis bovine P23H rods were metabolically active despite having completely lost their OS (Lee et al., 2012). It would be very informative to study whether there are dystrophic rod photoreceptors that are still metabolically active in the P23H rodent models and human patients. It would also be important to investigate the cytoprotective mechanisms responsible for this protected state and determine the best time for intervention. Our previous studies showed that rod-BPCs did regrow their dendrites and form new synaptic layers in response to new retinal grafts and there was even some functional benefit in the grafted eye over controls (Kwan et al., 1999).
The present study combined with other studies clearly shows the vulnerability of cones to the degeneration of rods. Therefore, it should be emphasized that preserving rods, identifying factors that damage cones and defining the host state that is still responsive to intervention are the rational strategies to preserving critical cone vision.
Acknowledgments
Authors are grateful to Dr. Sariah Allen for proof reading and comments. This work is supported by NIH R01 EY020488-02, W81XWH-DOD, Lincy Foundation, FFB, Fund from the Regenerative Medicine Institute at Cedars-Sinai Medical Center.
References
- Ambati J, Anand A, Fernandez S, Sakurai E, Lynn BC, Kuziel WA, Rollins BJ, Ambati BK. An animal model of age-related macular degeneration in senescent Ccl-2- or Ccr-2-deficient mice. Nature Medicine. 2003;9:1390–1397. doi: 10.1038/nm950. [DOI] [PubMed] [Google Scholar]
- Berson EL, Rosner B, Sandberg MA, Dryja TP. Ocular findings in patients with autosomal dominant retinitis pigmentosa and a rhodopsin gene defect (Pro-23-His) Archives of Ophthalmology. 1991a;109:92–101. doi: 10.1001/archopht.1991.01080010094039. [DOI] [PubMed] [Google Scholar]
- Berson EL, Rosner B, Sandberg MA, Weigel-DiFranco C, Dryja TP. Ocular findings in patients with autosomal dominant retinitis pigmentosa and rhodopsin, proline-347-leucine. American Journal of Ophthalmology. 1991b;111:614–623. doi: 10.1016/s0002-9394(14)73708-0. [DOI] [PubMed] [Google Scholar]
- Chang B, Hawes NL, Hurd RE, Davisson MT, Nusinowitz S, Heckenlively JR. Retinal degeneration mutants in the mouse. Vision Research. 2002;42:517–525. doi: 10.1016/s0042-6989(01)00146-8. [DOI] [PubMed] [Google Scholar]
- Chrysostomou V, Stone J, Stowe S, Barnett NL, Valter K. The status of cones in the rhodopsin mutant P23H-3 retina: Light-regulated damage and repair in parallel with rods. Investigative Ophthalmology and Visual Science. 2008;49:1116–1125. doi: 10.1167/iovs.07-1158. [DOI] [PubMed] [Google Scholar]
- Chua J, Fletcher EL, Kalloniatis M. Functional remodeling of glutamate receptors by inner retinal neurons occurs from an early stage of retinal degeneration. The Journal of Comparative Neurology. 2009;514:473–491. doi: 10.1002/cne.22029. [DOI] [PubMed] [Google Scholar]
- Cuenca N, Pinilla I, Sauve Y, Lu B, Wang S, Lund RD. Regressive and reactive changes in the connectivity patterns of rod and cone pathways of P23H transgenic rat retina. Neuroscience. 2004;127:301–317. doi: 10.1016/j.neuroscience.2004.04.042. [DOI] [PubMed] [Google Scholar]
- D’Cruz PM, Yasumura D, Weir J, Matthes MT, Abderrahim H, LaVail MM, Vollrath D. Mutation of the receptor tyrosine kinase gene Mertk in the retinal dystrophic RCS rat. Human Molecular Genetics. 2000;9:645–651. doi: 10.1093/hmg/9.4.645. [DOI] [PubMed] [Google Scholar]
- Dowling JE, Sidman RL. Inherited retinal dystrophy in the rat. The Journal of Cell Biology. 1962;14:73–107. doi: 10.1083/jcb.14.1.73. [DOI] [PMC free article] [PubMed] [Google Scholar]
- Dryja TP, McGee TL, Hahn LB, Cowley GS, Olsson JE, Reichel E, Sandberg MA, Berson EL. Mutations within the rhodopsin gene in patients with autosomal dominant retinitis pigmentosa. Proceedings of the National Academy of Sciences of the United States of America. 1990;88:9370–9374. doi: 10.1073/pnas.88.20.9370. [DOI] [PMC free article] [PubMed] [Google Scholar]
- Gamm DM, Wang S, Lu B, Girman S, Holmes T, Bischoff N, Shearer RL, Sauve Y, Capowski E, Svendsen CN, Lund RD. Protection of visual functions by human neural progenitors in a rat model of retinal disease. PLoS One. 2007;2:e338. doi: 10.1371/journal.pone.0000338. [DOI] [PMC free article] [PubMed] [Google Scholar]
- Garcia-Ayuso D, Salinas-Navarro M, Agudo M, Cuenca N, Pinilla I, Vidal-Sanz M, Villegas-Perez MP. Retinal ganglion cell numbers and delayed retinal ganglion cell death in the P23H rat retina. Experimental Eye Research. 2010;91:800–810. doi: 10.1016/j.exer.2010.10.003. [DOI] [PubMed] [Google Scholar]
- Girman SV, Wang S, Lund RD. Time course of deterioration of rod and cone function in RCS rat and the effects of subretinal cell grafting: A light- and dark-adaptation study. Vision Research. 2005;45:343–354. doi: 10.1016/j.visres.2004.08.023. [DOI] [PubMed] [Google Scholar]
- Harada T, Harada C, Nakayama N, Okuyama S, Yoshida K, Kohsaka S, Matsuda H, Wada K. Modification of glial-neuronal cell interactions prevents photoreceptor apoptosis during light-induced retinal degeneration. Neuron. 2000;26:533–541. doi: 10.1016/s0896-6273(00)81185-x. [DOI] [PubMed] [Google Scholar]
- Heckenlively JR, Rodriguez JA, Daiger SP. Autosomal dominant sectoral retinitis pigmentosa. Two families with transversion mutation in codon 23 of rhodopsin. Archives of Ophthalmology. 1991;109:84–91. doi: 10.1001/archopht.1991.01080010086038. [DOI] [PubMed] [Google Scholar]
- Humayun MS, Prince M, de Juan E, Jr, Barron Y, Moskowitz M, Klock IB, Milam AH. Morphometric analysis of the extramacular retina from postmortem eyes with retinitis pigmentosa. Investigative Ophthalmology and Visual Science. 1999;40:143–148. [PubMed] [Google Scholar]
- Humphries MM, Rancourt D, Farrar GJ, Kenna P, Hazel M, Bush RA, Sieving PA, Sheils DM, McNally N, Creighton P, Erven A, Boros A, Gulya K, Capecchi MR, Humphries P. Retinopathy induced in mice by targeted disruption of the rhodopsin gene. Nature Genetics. 1997;15:216–219. doi: 10.1038/ng0297-216. [DOI] [PubMed] [Google Scholar]
- Jacobson SG, Voigt WJ, Parel JM, Apathy PP, Nghiem-Phu L, Myers SW, Patella VM. Automated light- and dark-adapted perimetry for evaluating retinitis pigmentosa. Ophthalmology. 1986;93:1604–1611. doi: 10.1016/s0161-6420(86)33522-x. [DOI] [PubMed] [Google Scholar]
- John SK, Smith JE, Aguirre GD, Milam AH. Loss of cone molecular markers in rhodopsin-mutant human retinas with retinitis pigmentosa. Molecular Vision. 2000;6:204–215. [PubMed] [Google Scholar]
- Jones BW, Watt CB, Frederick JM, Baehr W, Chen CK, Levine EM, Milam AH, Lavail MM, Marc RE. Retinal remodeling triggered by photoreceptor degenerations. The Journal of Comparative Neurology. 2003;464:1–16. doi: 10.1002/cne.10703. [DOI] [PubMed] [Google Scholar]
- Koulen P, Fletcher EL, Craven SE, Bredt DS, Wassle H. Immunocytochemical localization of the postsynaptic density protein PSD-95 in the mammalian retina. Journal of Neuroscience. 1998;18:10136–10149. doi: 10.1523/JNEUROSCI.18-23-10136.1998. [DOI] [PMC free article] [PubMed] [Google Scholar]
- Kwan AS, Wang S, Lund RD. Photoreceptor layer reconstruction in a rodent model of retinal degeneration. Experimental Neurology. 1999;159:21–33. doi: 10.1006/exnr.1999.7157. [DOI] [PubMed] [Google Scholar]
- Lambard S, Reichman S, Berlinicke C, Niepon ML, Goureau O, Sahel JA, Leveillard T, Zack DJ. Expression of rod-derived cone viability factor: Dual role of CRX in regulating promoter activity and cell-type specificity. PLoS One. 2010;5:e13075. doi: 10.1371/journal.pone.0013075. [DOI] [PMC free article] [PubMed] [Google Scholar]
- Latch M, Lennie P. Rod-cone interaction in light adaptation. The Journal of Physiology. 1977;269:517–534. doi: 10.1113/jphysiol.1977.sp011912. [DOI] [PMC free article] [PubMed] [Google Scholar]
- LaVail MM. Legacy of the RCS rat: Impact of a seminal study on retinal cell biology and retinal degenerative diseases. Progress in Brain Research. 2001;131:617–627. doi: 10.1016/s0079-6123(01)31048-8. [DOI] [PubMed] [Google Scholar]
- Lawrence JM, Keegan DJ, Muir EM, Coffey PJ, Rogers JH, Wilby MJ, Fawcett JW, Lund RD. Transplantation of Schwann cell line clones secreting GDNF or BDNF into the retinas of dystrophic Royal College of Surgeons rats. Investigative Ophthalmology and Visual Science. 2004;45:267–274. doi: 10.1167/iovs.03-0093. [DOI] [PubMed] [Google Scholar]
- Lee DC, Vazquez-Chona FR, Ferrell WD, Tam BM, Jones BW, Marc RE, Moritz OL. Dysmorphic photoreceptors in a P23H mutant rhodopsin model of retinitis pigmentosa are metabolically active and capable of regenerating to reverse retinal degeneration. Journal of Neuroscience. 2012;32:2121–2128. doi: 10.1523/JNEUROSCI.4752-11.2012. [DOI] [PMC free article] [PubMed] [Google Scholar]
- Leonard KC, Petrin D, Coupland SG, Baker AN, Leonard BC, LaCasse EC, Hauswirth WW, Korneluk RG, Tsilfidis C. XIAP protection of photoreceptors in animal models of retinitis pigmentosa. PLoS One. 2007;2:e314. doi: 10.1371/journal.pone.0000314. [DOI] [PMC free article] [PubMed] [Google Scholar]
- Leveillard T, Mohand-Said S, Lorentz O, Hicks D, Fintz AC, Clerin E, Simonutti M, Forster V, Cavusoglu N, Chalmel F, Dolle P, Poch O, Lambrou G, Sahel JA. Identification and characterization of rod-derived cone viability factor. Nature Genetics. 2004;36:755–759. doi: 10.1038/ng1386. [DOI] [PubMed] [Google Scholar]
- Leveillard T, Sahel JA. Rod-derived cone viability factor for treating blinding diseases: From clinic to redox signaling. Science Translational Medicine. 2010;2:26ps16. doi: 10.1126/scitranslmed.3000866. [DOI] [PMC free article] [PubMed] [Google Scholar]
- Lewin AS, Drenser KA, Hauswirth WW, Nishikawa S, Yasumura D, Flannery JG, LaVail MM. Ribozyme rescue of photoreceptor cells in a transgenic rat model of autosomal dominant retinitis pigmentosa. Nature Medicine. 1998;4:967–971. doi: 10.1038/nm0898-967. [DOI] [PubMed] [Google Scholar]
- Li L, Sheedlo HJ, Turner JE. Muller cell expression of glial fibrillary acidic protein (GFAP) in RPE-cell transplanted retinas of RCS dystrophic rats. Current Eye Research. 1993;12:841–849. doi: 10.3109/02713689309020389. [DOI] [PubMed] [Google Scholar]
- Lu B, Malcuit C, Wang S, Girman S, Francis P, Lemieux L, Lanza R, Lund R. Long-term safety and function of RPE from human embryonic stem cells in preclinical models of macular degeneration. Stem Cells. 2009;27:2126–2135. doi: 10.1002/stem.149. [DOI] [PubMed] [Google Scholar]
- Lu B, Wang S, Girman S, McGill T, Ragaglia V, Lund R. Human adult bone marrow-derived somatic cells rescue vision in a rodent model of retinal degeneration. Experimental Eye Research. 2010;91:449–455. doi: 10.1016/j.exer.2010.06.024. [DOI] [PubMed] [Google Scholar]
- Machida S, Kondo M, Jamison JA, Khan NW, Kononen LT, Sugawara T, Bush RA, Sieving PA. P23H rhodopsin transgenic rat: Correlation of retinal function with histopathology. Investigative Ophthalmology and Visual Science. 2000;41:3200–3209. [PubMed] [Google Scholar]
- Machida S, Raz-Prag D, Fariss RN, Sieving PA, Bush RA. Photopic ERG negative response from amacrine cell signaling in RCS rat retinal degeneration. Investigative Ophthalmology and Visual Science. 2008;49:442–452. doi: 10.1167/iovs.07-0291. [DOI] [PubMed] [Google Scholar]
- Marc RE, Jones BW, Anderson JR, Kinard K, Marshak DW, Wilson JH, Wensel T, Lucas RJ. Neural reprogramming in retinal degeneration. Investigative Ophthalmology and Visual Science. 2007;48:3364–3371. doi: 10.1167/iovs.07-0032. [DOI] [PMC free article] [PubMed] [Google Scholar]
- Marc RE, Jones BW, Watt CB, Strettoi E. Neural remodeling in retinal degeneration. Progress in Retinal and Eye Research. 2003;22:607–655. doi: 10.1016/s1350-9462(03)00039-9. [DOI] [PubMed] [Google Scholar]
- Milam AH, Li ZY, Fariss RN. Histopathology of the human retina in retinitis pigmentosa. Progress in Retinal and Eye Research. 1998;17:175–205. doi: 10.1016/s1350-9462(97)00012-8. [DOI] [PubMed] [Google Scholar]
- Nir I, Papermaster DS. Immunocytochemical localization of opsin in degenerating photoreceptors of RCS rats and rd and rds mice. Program in Clinical and Biological Research. 1989;314:251–264. [PubMed] [Google Scholar]
- Pignatelli V, Cepko CL, Strettoi E. Inner retinal abnormalities in a mouse model of Leber’s congenital amaurosis. The Journal of Comparative Neurology. 2004;469:351–359. doi: 10.1002/cne.11019. [DOI] [PubMed] [Google Scholar]
- Pittler SJ, Baehr W. Identification of a nonsense mutation in the rod photoreceptor cGMP phosphodiesterase beta-subunit gene of the rd mouse. Proceedings of the National Academy of Sciences of the United States of America. 1991;88:8322–8326. doi: 10.1073/pnas.88.19.8322. [DOI] [PMC free article] [PubMed] [Google Scholar]
- Ripps H. Cell death in retinitis pigmentosa: Gap junctions and the ‘bystander’ effect. Experimental Eye Research. 2002;74:327–336. doi: 10.1006/exer.2002.1155. [DOI] [PubMed] [Google Scholar]
- Sandberg MA, Berson EL. Visual acuity and cone spatial density in retinitis pigmentosa. Investigative Ophthalmology and Visual Science. 1983;24:1511–1513. [PubMed] [Google Scholar]
- Sandberg MA, Rosner B, Weigel-DiFranco C, McGee TL, Dryja TP, Berson EL. Disease course in patients with autosomal recessive retinitis pigmentosa due to the USH2A gene. Investigative Ophthalmology and Visual Science. 2008;49:5532–5539. doi: 10.1167/iovs.08-2009. [DOI] [PMC free article] [PubMed] [Google Scholar]
- Sheedlo HJ, Jaynes D, Bolan AL, Turner JE. Mullerian glia in dystrophic rodent retinas: An immunocytochemical analysis. Brain Research. Developmental Brain Research. 1995;85:171–180. doi: 10.1016/0165-3806(94)00203-c. [DOI] [PubMed] [Google Scholar]
- Strettoi E, Novelli E, Mazzoni F, Barone I, Damiani D. Complexity of retinal cone bipolar cells. Progress in Retinal and Eye Research. 2010;29:272–283. doi: 10.1016/j.preteyeres.2010.03.005. [DOI] [PMC free article] [PubMed] [Google Scholar]
- Strettoi E, Pignatelli V. Modifications of retinal neurons in a mouse model of retinitis pigmentosa. Proceedings of the National Academy of Sciences of the United States of America. 2000;97:11020–11025. doi: 10.1073/pnas.190291097. [DOI] [PMC free article] [PubMed] [Google Scholar]
- Strettoi E, Porciatti V, Falsini B, Pignatelli V, Rossi C. Morphological and functional abnormalities in the inner retina of the rd/rd mouse. Journal of Neuroscience. 2002;22:5492–5504. doi: 10.1523/JNEUROSCI.22-13-05492.2002. [DOI] [PMC free article] [PubMed] [Google Scholar]
- Sung CH, Davenport CM, Hennessey JC, Maumenee IH, Jacobson SG, Heckenlively JR, Nowakowski R, Fishman G, Gouras P, Nathans J. Rhodopsin mutations in autosomal dominant retinitis pigmentosa. Proceedings of the National Academy of Sciences of the United States of America. 1991;88:6481–6485. doi: 10.1073/pnas.88.15.6481. [DOI] [PMC free article] [PubMed] [Google Scholar]
- Vardi N, Duvoisin R, Wu G, Sterling P. Localization of mGluR6 to dendrites of ON bipolar cells in primate retina. The Journal of Comparative Neurology. 2000;423:402–412. doi: 10.1002/1096-9861(20000731)423:3<402::aid-cne4>3.0.co;2-e. [DOI] [PubMed] [Google Scholar]
- Vardi N, Morigiwa K. ON cone bipolar cells in rat express the metabotropic receptor mGluR6. Visual Neuroscience. 1997;14:789–794. doi: 10.1017/s0952523800012736. [DOI] [PubMed] [Google Scholar]
- Vardi N, Morigiwa K, Wang TL, Shi YJ, Sterling P. Neurochemistry of the mammalian cone ‘synaptic complex’. Vision Research. 1998;38:1359–1369. doi: 10.1016/s0042-6989(98)00007-8. [DOI] [PubMed] [Google Scholar]
- Villegas-Perez MP, Lawrence JM, Vidal-Sanz M, Lavail MM, Lund RD. Ganglion cell loss in RCS rat retina: A result of compression of axons by contracting intraretinal vessels linked to the pigment epithelium. The Journal of Comparative Neurology. 1998;392:58–77. [PubMed] [Google Scholar]
- Wang S, Lu B, Girman S, Holmes T, Bischoff N, Lund RD. Morphological and functional rescue in RCS rats after RPE cell line transplantation at a later stage of degeneration. Investigative Ophthalmology and Visual Science. 2008;49:416–421. doi: 10.1167/iovs.07-0992. [DOI] [PubMed] [Google Scholar]
- Wang S, Lu B, Lund RD. Morphological changes in the Royal College of Surgeons rat retina during photoreceptor degeneration and after cell-based therapy. The Journal of Comparative Neurology. 2005a;491:400–417. doi: 10.1002/cne.20695. [DOI] [PubMed] [Google Scholar]
- Wang S, Lu B, Wood P, Lund RD. Grafting of ARPE-19 and Schwann Cells to the subretinal space in RCS rats. Investigative Ophthalmology and Visual Science. 2005b;46:2552–2560. doi: 10.1167/iovs.05-0279. [DOI] [PubMed] [Google Scholar]
- Wang S, Villegas-Perez MP, Holmes T, Lawrence JM, Vidal-Sanz M, Hurtado-Montalban N, Lund RD. Evolving neurovascular relationships in the RCS rat with age. Current Eye Research. 2003;27:183–196. doi: 10.1076/ceyr.27.3.183.16053. [DOI] [PubMed] [Google Scholar]
- Wang S, Villegas-Perez MP, Vidal-Sanz M, Lund RD. Progressive optic axon dystrophy and vascular changes in rd mice. Investigative Ophthalmology and Visual Science. 2000;41:537–545. [PubMed] [Google Scholar]
- Wassle H, Grunert U, Chun MH, Boycott BB. The rod pathway of the macaque monkey retina: Identification of AII-amacrine cells with antibodies against calretinin. The Journal of Comparative Neurology. 1995;361:537–551. doi: 10.1002/cne.903610315. [DOI] [PubMed] [Google Scholar]
- Wassle H, Grunert U, Rohrenbeck J. Immunocytochemical staining of AII-amacrine cells in the rat retina with antibodies against parvalbumin. The Journal of Comparative Neurology. 1993;332:407–420. doi: 10.1002/cne.903320403. [DOI] [PubMed] [Google Scholar]
- Westheimer G. Spatial interaction in human cone vision. The Journal of Physiology. 1967;190:139–154. doi: 10.1113/jphysiol.1967.sp008198. [DOI] [PMC free article] [PubMed] [Google Scholar]
- Yang Y, Mohand-Said S, Leveillard T, Fontaine V, Simonutti M, Sahel JA. Transplantation of photoreceptor and total neural retina preserves cone function in P23H rhodopsin transgenic rat. PLoS One. 2010;5:e13469. doi: 10.1371/journal.pone.0013469. [DOI] [PMC free article] [PubMed] [Google Scholar]
- Zeiss CJ. Animals as models of age-related macular degeneration: An imperfect measure of the truth. Veterinary Pathology. 2010;47:396–413. doi: 10.1177/0300985809359598. [DOI] [PubMed] [Google Scholar]
- Zhang H, Cuenca N, Ivanova T, Church-Kopish J, Frederick JM, MacLeish PR, Baehr W. Identification and light-dependent translocation of a cone-specific antigen, cone arrestin, recognized by monoclonal antibody 7G6. Investigative Ophthalmology and Visual Science. 2003;44:2858–2867. doi: 10.1167/iovs.03-0072. [DOI] [PubMed] [Google Scholar]
- Zhang K, Kniazeva M, Han M, Li W, Yu Z, Yang Z, Li Y, Metzker ML, Allikmets R, Zack DJ, Kakuk LE, Lagali PS, Wong PW, MacDonald IM, Sieving PA, Figueroa DJ, Austin CP, Gould RJ, Ayyagari R, Petrukhin K. A 5-bp deletion in ELOVL4 is associated with two related forms of autosomal dominant macular dystrophy. Nature Genetics. 2001;27:89–93. doi: 10.1038/83817. [DOI] [PubMed] [Google Scholar]