Abstract
Background
The need to develop valid methods for sampling and analyzing fecal specimens for microbiome studies is increasingly important, especially for large population studies.
Methods
Some of the most important attributes of any sampling method are reproducibility, stability, and accuracy. We compared seven fecal sampling methods (no additive, RNAlater, 70% ethanol, EDTA, dry swab, and pre/post development fecal occult blood test (FOBT)) using 16S rRNA microbiome profiling in two laboratories. We evaluated nine commonly used microbiome metrics: abundance of 3 phyla, two alpha-diversities, and four beta-diversities. We determined the technical reproducibility, stability at ambient temperature, and accuracy.
Results
While microbiome profiles showed systematic biases according to sample method and time at ambient temperature, the highest source of variation was between individuals. All collection methods showed high reproducibility. FOBT and RNAlater resulted in the highest stability without freezing for four days. In comparison to no-additive samples, swab, FOBT, and 70% ethanol exhibited the greatest accuracy when immediately frozen.
Conclusions
Overall, optimal stability and reproducibility was achieved using FOBT, making this a reasonable sample collection method for 16s analysis.
Impact
Having standardized method of collecting and storing stable fecal samples will allow future investigations into the role of gut microbiota in chronic disease etiology in large population studies.
INTRODUCTION
There has been considerable effort to evaluate the relationship between gut bacteria and health in cross-sectional and small case-control studies (1–8). However, microbiome research is rapidly transitioning towards larger, population-based research. It is currently not possible to conduct prospective cohort studies because fecal samples are not available. The incorporation of fecal sample collections into prospective cohort studies requires the development of standardized protocols that can be used in the field. Several issues need to be considered in developing standardized methods for collecting biological samples aimed at analyzing microbial communities in large, population-based epidemiologic studies. First, the method of collection must preserve the microbial signature or “biomarker” for each sample.
Second, key measures must be stable under field conditions over days in sub-optimal storage conditions. Third, any sample collected should be preserved in such a way that maximizes the types of possible analyses utilizing the samples (e.g., microbiomics, transcriptomics, metabolomics) (9). Finally, microbiome studies will likely need to either be very large to adjust for multiple comparisons or data from multiple studies that have been processed at different laboratories be pooled or meta-analyzed. Thus, it is crucial to develop harmonized protocols that are consistently reproducible for accurate characterization and comparison of fecal specimens (10).
Few studies have evaluated these issues in relation to the microbiome of fecal samples collected under field conditions. Recently, several groups took steps to address these areas by determining the effects of sample storage conditions on microbial communities; however, these studies were limited by a small sample size and evaluation of limited sampling methods (11–13). To more specifically address many of the issues, we conducted a study to analyze fecal samples that were collected using seven different methods, including those that would allow transcriptomics (RNAlater solution) and metabolomics (ethanol) analyses. The specimens were frozen at different timepoints (soon after collection, one day, and four days) to mimic delays in freezing that often occur when samples are collected in the field. To evaluate possible inter-laboratory variability in DNA extraction and sequencing, the specimens were processed in two independent laboratories.
MATERIAL AND METHODS
Study participants
Twenty healthy volunteers (6 male and 14 female) of individuals who worked at the clinic between the ages of 23 and 54 were recruited through the Mayo Clinic online classified section. Participants were excluded if they were under the age of 18, had used antibiotics or probiotics within the last two weeks, had a history of pelvic radiation, or were currently undergoing chemotherapy. The study coordinator met with each eligible participant to review the consent and study details. All subjects signed and dated HIPAA Authorization and Informed Consent forms prior to the study. The study was reviewed and approved by the Mayo Clinic Studies Institutional Review Board (protocol 13-005217) and the NCI Office of Human Subjects Research (12189).
Fecal specimen collection
An Exakt Pak canister (Inmark Packaging, Austell, GA, USA) was provided to each subject for fecal collection in the clinic. The subject collected the feces, recorded the date and time of collection, and paged the study coordinator to pick up the sample who delivered it to the laboratory for processing.
The fecal specimen was homogenized manually using a spatula, and a total of 86 aliquots were generated. A summary of the different sampling methods is shown in Supplemental Table 1. Briefly, we generated 50 aliquots of feces, 12 swabs, and 24 fecal occult blood test (FOBT) cards. Enough fecal specimen to fully fill the scoop (approximately 1–2 grams) was placed in a Sarstedt feces tube (Numbrecht, Germany) containing no additive or one of three different stabilization solutions. Fourteen aliquots were stored in no additive, 12 aliquots were stored in 2.5 mL of RNAlater (Ambion, Austin, Texas), 12 aliquots were stored in 2.5 mL of 70% ethanol (Sigma-Aldrich, St. Louis, Missouri, USA), and 12 aliquots were stored in 2.5 mL of ethylenediaminetetraacetic acid (EDTA; Tris 500 mM, NaCl 10 mM, EDTA 191 mM, pH 9.0). Twelve sterile swabs (Numbrect, Germany) were used to wipe the fecal specimens taking care not to overload the swab. Each swab was placed in a Sarstedt tube and the lid was tightly screwed. Twenty-four Hemoccult II Elite Dispensapak Plus for FOBT (Beckman Coulter; Brea, CA, USA) were smeared thinly with feces and the flap was closed. Twelve FOBT cards were kept without further processing, while the other 12 FOBT cards were developed using two drops of Hemoccult Sensa Developer that was applied to guaiac paper on the back of the card as is typically done to test for occult blood in colorectal cancer screening.
Six replicates of each specimen with no additive and four replicates of the other six conditions were frozen at −80°C. The remaining samples were incubated at ambient temperature (approximately 25°C) for 24 hours (1 day) or 96 hours (4 days) then frozen at −80°C. Triplicate aliquots of each fecal sample with no additive frozen soon after collection and duplicate aliquots for all other sampling methods were analyzed at one of two laboratories, the Knight laboratory, University of Colorado, Boulder, USA and the Mayo Clinic Microbiome laboratory, Rochester, USA.
DNA extraction and sequencing
Knight Laboratory
Samples were thawed at 4°C and kept on ice during plating. All samples were swabbed using a wooden swab (Puritan Cotton Tipped Applicators – Puritan Medical Products), which was then used for the DNA extraction. FOBT cards were swabbed vigorously. Samples containing storage buffer were sampled by pulling out the fecal material and swabbing.
DNA extraction, polymerase chain reaction (PCR) amplification and amplicon preparation for sequencing were performed as described in Caporaso et al. (14) and can be found on the Earth Microbiome Project (EMP; (15)) web page (http://www.earthmicrobiome.org/emp-standard-protocols/) using the universal bacterial primer set 515F/806R (14, 16). Negative controls included no-template controls for DNA extraction and PCR amplification. Finally, all barcoded amplicons were pooled in equal concentrations for sequencing on the Illumina MiSeq sequencing platform at the BioFrontiers Institute Next-Generation Genomics Facility at University of Colorado, Boulder, USA. The average coverage was ~30,000 reads per sample, with 821 samples used for the analysis, after retaining samples with at least 5,000 reads/sample.
Mayo Laboratory
Samples were thawed at 4°C for approximately 20 minutes. Samples containing buffer were spun down at 15,000 rpm for 60 seconds, and supernatant discarded. Approximately 0.5 g of stool was aliquoted into bead beating tubes. For the swab and FOBT card, the portion covered by feces was cut with a scalpel and placed into the bead beating tubes.
Genomic DNA extraction was performed using the PowerSoil DNA isolation kit (MoBio Laboratories) using the MP FastPrep (MP Biomedicals, Solon, OH) for 40 seconds at 6.0 m/s. Extracted DNA was quantified using the Qubit High Sensitivity assay (Life Technologies Corporation, Carlsbad, CA), ranging from 25–60 ng/µl. The V3–V5 region (357F/926R) of the 16S rRNA was then amplified through PCR as follows: 25 µl of Kapa HiFi (Kapa Biosystems, Woburn, MA), 1.5 µl (10 µM) forward primer, 1.5 µl (10 µM) reverse primer, and 50 ng of DNA with the remaining volume of molecular grade water (up to a final volume of 50 µl per reaction). The following PCR cycle was repeated 34 times: 95°C for 3min, 98°C for 20 seconds, 70°C for 15 seconds, and 72°C for 15 seconds, with a final extension at 72°C for 5 minutes. The products of the amplification were verified by TapeStation D1K Tape (Agilent Technologies, Santa Clara, CA) to be free of contamination. The PCR products were purified using Agencourt AMPure (Beckman Coulter). After purification, the DNA concentrations were measured using the Qubit High Sensitivity assay. Samples were sent to the Medical Genomics Facility at Mayo Clinic for 16S rRNA amplicon sequencing using a high-throughput next-generation Illumina MiSeq (San Diego, CA) sequencing platform. The average coverage was ~70,000 reads per sample, with 852 samples used for the analysis after retaining samples with at least 10,000 reads/sample.
Operational Taxonomic Unit (OTU) picking
All sequences were processed using the QIIME pipeline V1.7 (17). For each sample, OTUs were selected using closed reference OTU picking using the Greengenes database version 13.5 (18) with 97% similarity. To compare data between the two labs, samples from both laboratories were rarefied to 10,000 reads per sample.
Distance metrics
Distance metrics were used to summarize the overall microbiota variability. Different distance metrics reveal distinctive views of the microbiota structure. We used both non-phylogeny-based distance (Bray-Curtis) and phylogeny-based distance (UniFrac) metrics. The original UniFrac distances include two versions: unweighted UniFrac, which uses OTU presence/absence information, and weighted UniFrac, which is based on the relative abundance OTUs. Unweighted UniFrac is most efficient to capture the variability in community membership as well as rare taxonomic lineages, since the probability of these rare taxa being picked up by sequencing is directly related to their abundance. Weighted UniFrac, on the other hand, is most efficient to capture the variability in the abundant lineages since these lineages contribute the most weight in distance calculations. A generalized version of UniFrac distance has been developed to fill the midpoint (19).
Ordination plot and contribution of variables to overall microbiota variability
An ordination plot was generated using principal coordinate analysis (PCoA) as implemented in R (‘cmdscale’ function) using unweighted UniFrac-based distances. A distance-based coefficient of determination R2 was used to quantify the percentage of microbiota variability explained by the corresponding variable (‘adonis’ function in the ‘vegan’ package) (20).
ICC analysis
We used intraclass correlation coefficients (ICC) to quantify the reproducibility, stability, and accuracy or neutrality of different storage methods for nine metrics included relative abundances of three phyla (Actinobacteria, Bacteroidetes, and Firmicutes), two alpha diversity metrics (number of observed OTUs and Shannon index) and four beta-diversity metrics (top PCoA component for unweighted UniFrac, generalized UniFrac, weighted UniFrac, and Bray-Curtis distance). The ICC is defined as
where represents the biological variability, i.e., individual-to-individual variability, and represents the technical variability, i.e., the variability introduced by storage method, storage time, and sample preparation and sequencing. Specifically, for reproducibility, captures the variability due to sample preparation and sequencing. We used technical replicates at days 0, 1, or 4 to evaluate the reproducibility of the microbiome metrics. We calculated stability by comparing day 4 samples to ones frozen soon after collection and accuracy by comparing fecal microbiome collected by six methods with no additive specimens frozen soon after collection. Besides the inherent variability due to sample preparation and sequencing, mainly captures the variability due to different storage times, and sample collection as compared to no additive samples that were frozen close to collection. We randomly sampled one replicate from the triplets or pairs for each storage day for stability and accuracy related ICCs. ICCs were then averaged over 25 random samplings. For accuracy analysis, we also used Spearman’s rank correlation as an alternative to ICC. The ICCs were estimated using the R package ‘ICC’ based on the mixed effects model. An ICC close to one indicates excellent reproducibility, stability and accuracy.
Pearson’s correlation
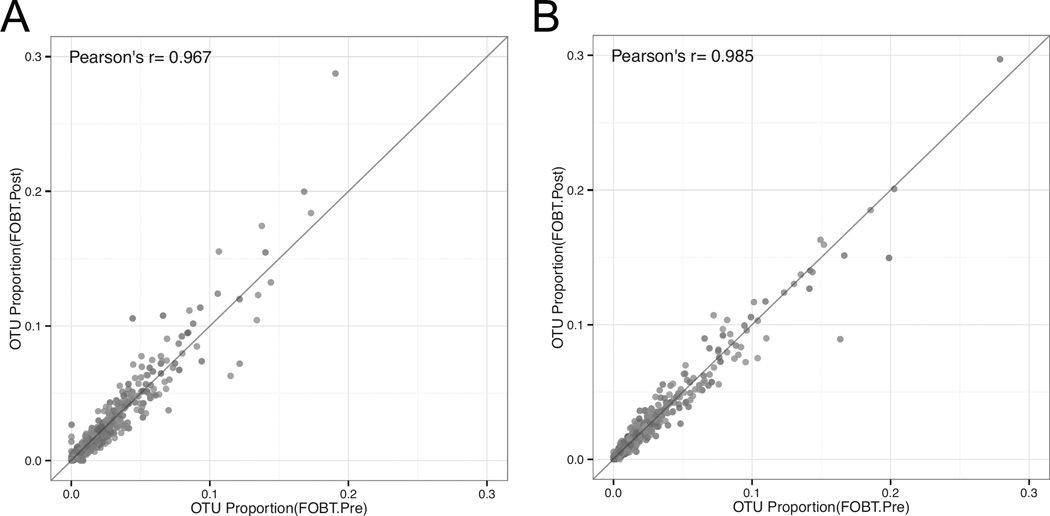
We used Pearson’s correlation to evaluate the OTU correlation between FOBT pre- and post-peroxide treatment after 4 days at ambient temperature.
Calculation of OTU fold-change
The fold change, F, for each OTU, p, was calculated independently as the mean fold change for all individuals, and is given by
where M is the number of replicate measurements and Fi(p) is the mean fold change of OTU p in individual I which is defined as the ratio between mean frequencies at day 4 and day 0. A cutoff of 1/10000 was used for minimal frequency since there is a lower limit on the minimal detection threshold for the sequencing results.
Abundance A in this case is a floored fraction given by
where the number of reads per OTU p is given by r(p).
RESULTS
Inter-individual differences
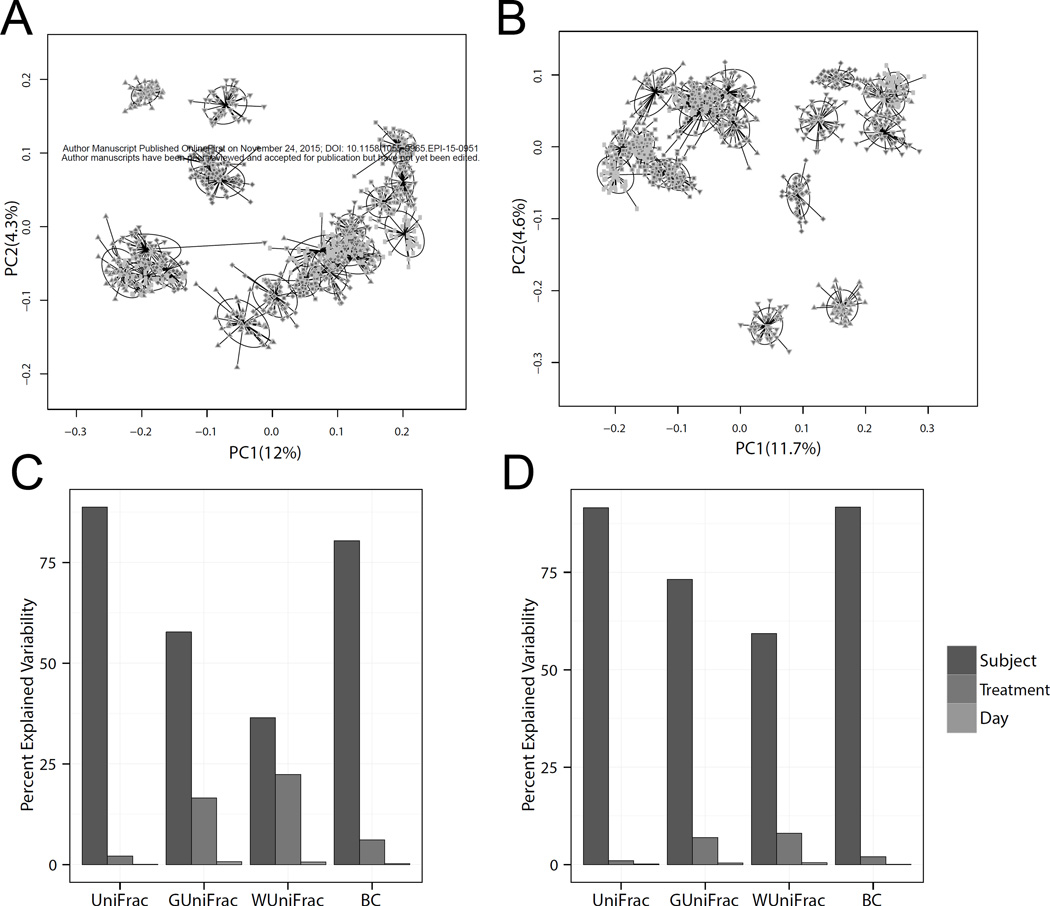
The similarity matrix using PCoA demonstrated that the samples collected from each person clustered together (Figure 1A and B) and was consistent for samples sequenced at both laboratories, suggesting that the biological effect outweighed the effect of collection, extraction, and sequencing.
Figure 1.
Sources of microbiome variability. Principal coordinate plot based on unweighted Unifrac of the microbial community profiles from all samples analyzed in the Knight laboratory (A) and the Mayo Microbiome laboratory (B). A distance-based coefficient of determination R2 (unweighted Unifrac, generalized Unifrac, weighted UniFrac, and Bray-Curtis (BC) distance) was used to quantify the percentage of microbiota variability in the Knight laboratory (C) and the Mayo Microbiome laboratory (D).
To further evaluate the sources of variability in this study, we analyzed unweighted, generalized, and weighted UniFrac, and Bray-Curtis distances (Figure 1C and D). The percentage of microbial variability was explained primarily by individual differences, supporting the results of our PCoA analysis, followed by sampling method, and lastly by storage time. These data illustrate that the inter-individual variability explained over 80% of the variability in distinguishing microbiota from unweighted UniFrac, between 55–70% from generalized UniFrac, between 30–60% from weighted UniFrac, and approximately 80% from Bray-Curtis dissimilarity.
Technical reproducibility
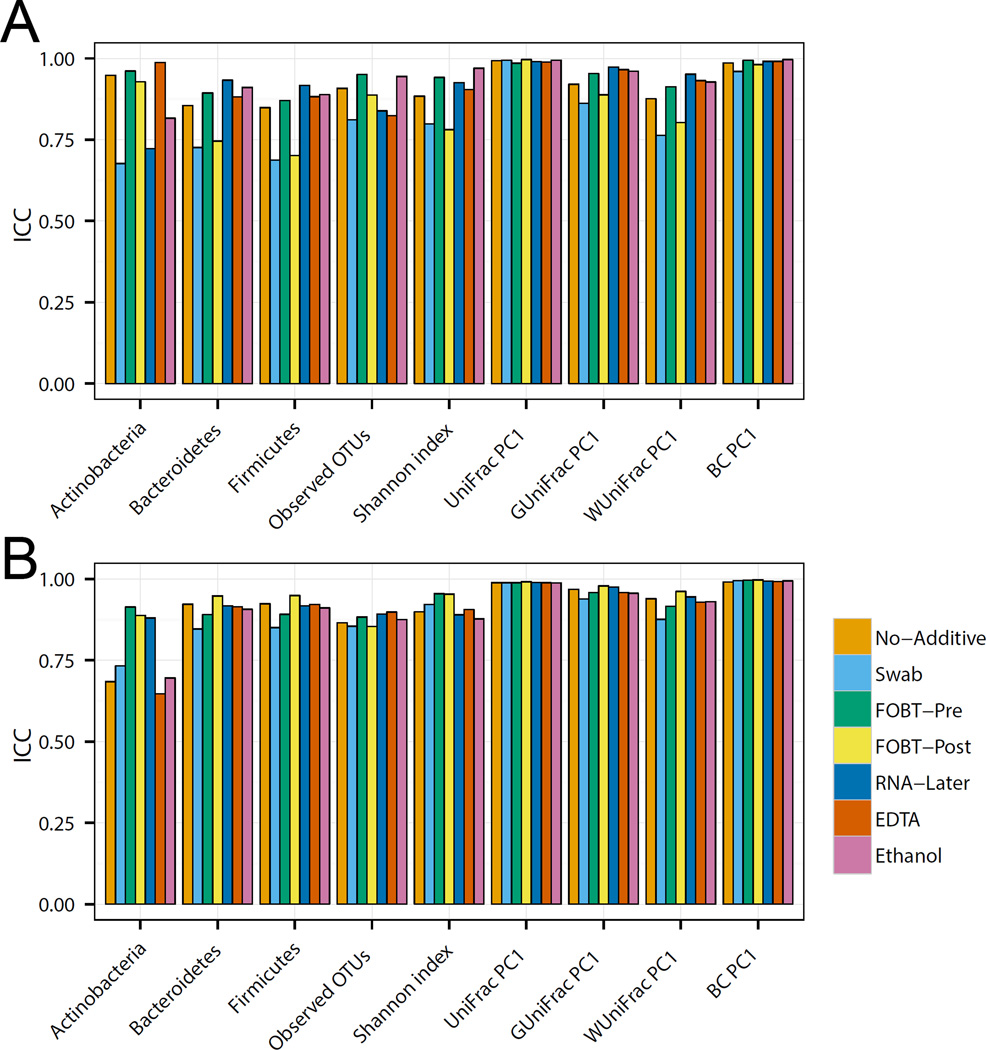
To determine the technical reproducibility of each collection method at a specific time point (Day 0), we compared the ICCs of nine key microbiome metrics (Figure 2A and B) for the duplicates. Data from both the Knight and Mayo Microbiome laboratories suggested that the majority of the sample collection methods resulted in reproducible measures of microbial diversity with ICCs over 0.75 for most parameters. Similar analyses on samples incubated for 1 and 4 days at ambient temperature (Supplementary Figure 1A–D) revealed relative stability across beta diversity metrics, but all sampling methods demonstrated a general loss of technical reproducibility across time in relative phyla abundances and alpha diversity metrics.
Figure 2.
Evaluation of technical reproducibility. Intraclass correlation coefficients for microbiome metrics including the abundance of three phyla, two alpha-diversity metrics (number of observed OTUs and Shannon index) and four beta-diversity metrics (top PCoA component for unweighted Unifrac, generalized Unifrac, weighted UniFrac, and Bray-Curtis distance) analyzed at day 0 in the Knight laboratory (A) and the Mayo Microbiome laboratory (B).
Stability of different collection methods across time
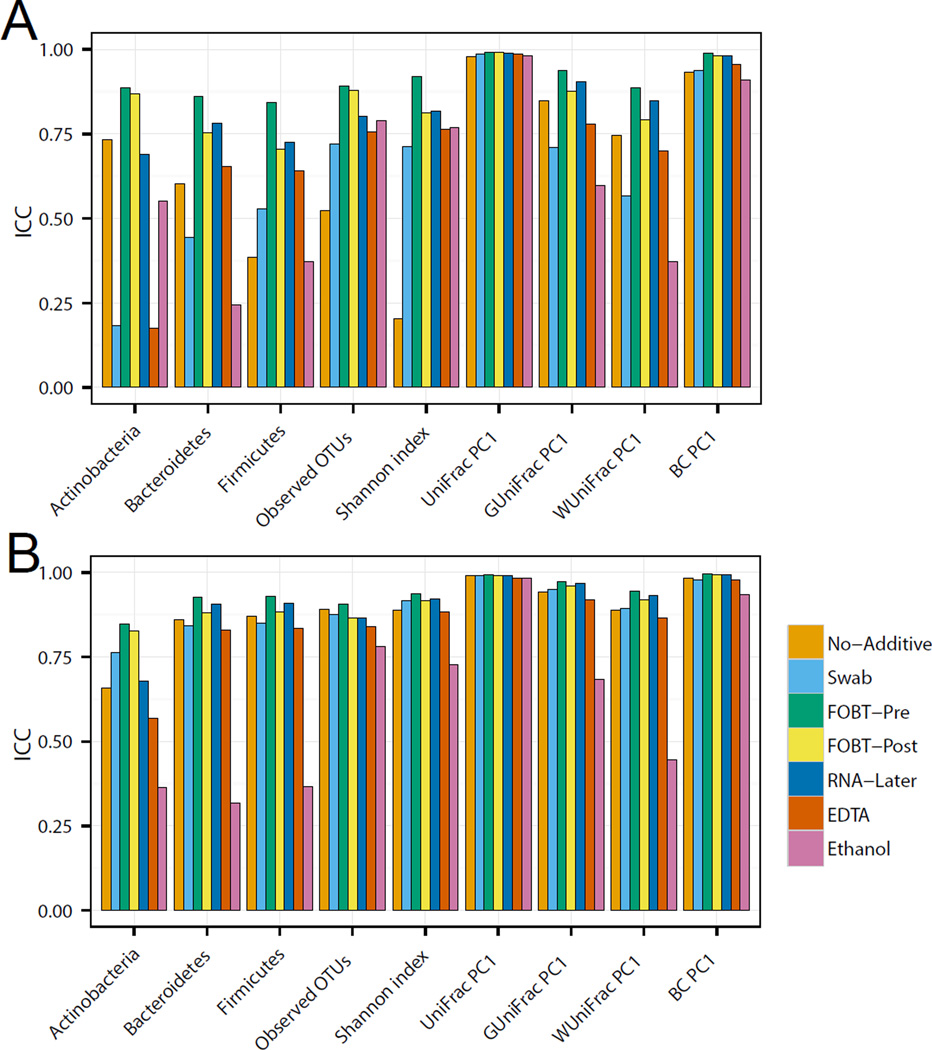
To determine specimen stability, we used ICCs for the nine key microbiome metrics to compare specimens frozen at −80°C soon after collection with those stored over 4 days at ambient temperature (Figure 3A and B). The ICCs of the samples analyzed at both laboratories indicated that specimens collected from FOBT cards, both pre- and post-development, and those stored in RNAlater, were relatively stable following a 4-day delay in freezing. Importantly, both laboratories found that storage of specimens in 70% ethanol had low microbiome stability. Data from the two laboratories differed for specimens stored dry with no stabilization reagent and using swabs; the Knight laboratory found a decrease in microbiome stability, whereas the Mayo Microbiome laboratory did not.
Figure 3.
Evaluation of microbiome stability. Intraclass correlation coefficients for microbiome metrics including the abundance of three phyla, two alpha-diversity metrics (number of observed OTUs and Shannon index) and four beta-diversity metrics (top PCoA component for unweighted Unifrac, generalized Unifrac, weighted UniFrac, and Bray-Curtis distance) in the Knight laboratory (A) and the Mayo Microbiome laboratory (B).
Accuracy or neutrality with respect to day 0 with no additive
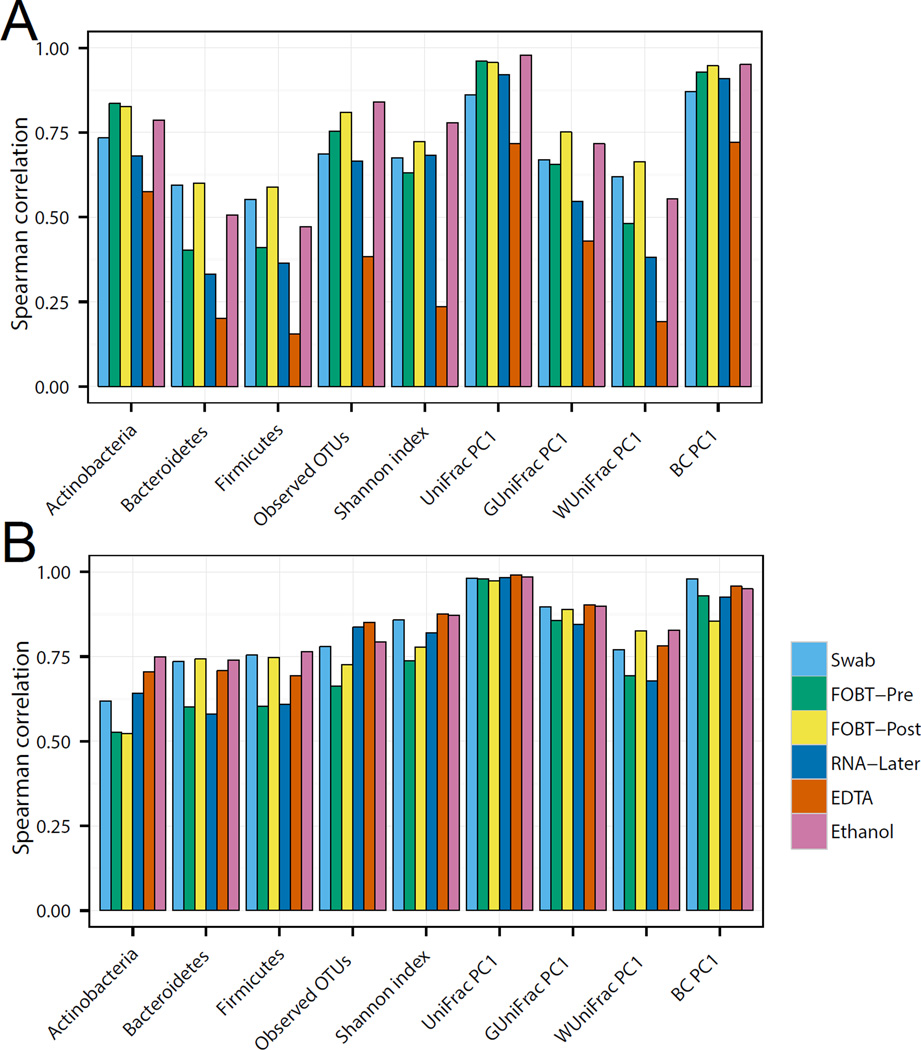
The best sampling method should represent the “true” microbiome of the host. In this study, we assumed that specimens sampled and stored with no additive and frozen at −80°C soon after collection most closely reflects what was present in the host prior to sampling. To test the microbiome accuracy of these specimens, we used Spearman’s rank correlation (Figure 4A and B) and ICC (Supplementary Figure 2A and B) analyses. Analyses performed at both laboratories indicated that sampling using the swab, FOBT cards, both pre- and post-development, and 70% ethanol produced the most accurate microbial diversity measures. However, there were striking differences between the results for the two laboratories, with the Mayo Microbiome laboratory consistently having higher correlations and ICCs as compared to the Knight laboratory.
Figure 4.
Evaluation of accuracy. Spearman correlation (all samples sampled by six different methods at time zero were compared to those sampled with no additive at time zero) of microbiome metrics including the abundance of three phyla, two alpha-diversity metrics (number of observed operational taxonomic units and Shannon index) and four beta-diversity metrics (top PCoA component for unweighted Unifrac, generalized Unifrac, weighted UniFrac, and Bray-Curtis distance) in the Knight laboratory (A) and the Mayo Microbiome laboratory (B).
Pre- and post-treatment FOBT correlation
Many colorectal cancer-screening programs use FOBT cards for screening occult blood. Since FOBT cards have the potential to accelerate population studies through the use of existing samples collected for colorectal cancer screening, we evaluated use of this sampling method further. To determine the effect of the Hemoccult Sensa Developer on microbial diversity, we compared the observed OTUs of specimens sampled using FOBT cards with and without development after incubation for 4 days at ambient temperature (Figure 5A and B). Both laboratories found a significant correlation between OTUs pre- and post-development (Pearson correlation of 0.967 and 0.985, respectively).
Figure 5.
OTU correlation between FOBT pre- and post-peroxide treatment after 4 days at ambient temperature as analyzed in the Knight laboratory (A) and the Mayo Microbiome laboratory (B). Different colors represent different participants.
OTU abundance fold-change across time for different treatments
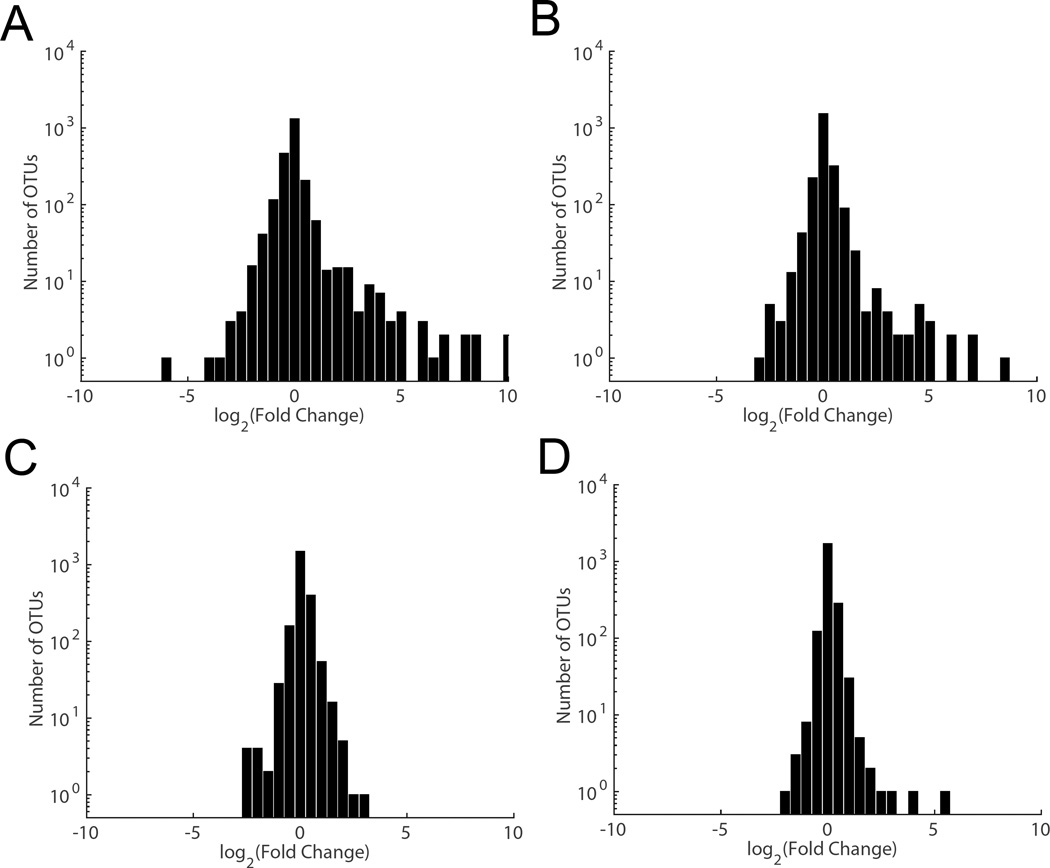
A true test of a specimen's stability across time and sampling method is the preservation of key biomarkers. We compared specimens sampled and stored at ambient temperature either with no additive or with FOBT cards (pre-development) to those samples frozen at −80°C soon after collection. We determined the distribution of frequency fold change for all OTUs after incubation for 4 days at ambient temperature (Figure 6 A–D). Both laboratories determined that most OTUs were relatively stable over 4 days. However, a small group of OTUs displayed a pronounced growth at ambient temperature (with 37 and 20 OTUs exhibiting a growth of more than 8-fold in the Knight and Mayo laboratory sequencing respectively). In both laboratories, this group included mostly Gammaproteobacteria and a few Bacilli (Supplementary Table 2). In contrast, FOBT cards showed a much smaller difference in OTU abundances (with only 1 and 3 OTUs exhibiting a growth of more than 8-fold in the Knight and Mayo laboratory sequencing respectively).
Figure 6.
Preservation of key biomarkers. Histogram of fold change in frequency for each OTU (compared to day 0 fresh frozen samples) after incubation for 4 days at ambient temperature in specimens collected using no-additive sampling (A, B) or FOBT cards (C, D) as determined by the Knight laboratory (A, C) and the Mayo Microbiome laboratory (B, D).
DISCUSSION
We undertook a detailed comparison using 16S rRNA gene profiling of seven sampling methods for human stool to define an optimal fecal sampling method that provides reproducible, stable, and accurate results. We determined that for all sampling methods, the microbiome profiles between individual persons represent the highest source of variation, followed by sampling method, and finally by length of time at ambient temperature. Both laboratories determined that sampling by FOBT card renders specimens relatively stable over four days. Sampling with swab, FOBT card, and 70% ethanol at baseline were most similar to those collected under ideal conditions (i.e. those frozen soon after collection).
An ideal sampling method is one that preserves the microbial signature of each specimen over time and under sub-optimal conditions. In this study, we found that FOBT cards provided a reproducible and stable method for collecting fecal samples, similar to Dominianni et al. (13) who reported results from three people. The reproducibility of the nine key microbiome metrics was relatively high at time zero for the seven collection methods. However, incubation at ambient temperature over 4 days reduced the reproducibility for most sampling methods (e.g., no additive, swab, 70% ethanol, and EDTA) with the exception of the FOBT cards (both treated and untreated) and RNAlater. Incubation for 1 day at ambient temperature maintained the reproducibility of most microbiome metrics, suggesting that freezing the samples soon after collection is still the best practice. When that is not possible, using methods such as FOBT cards or RNAlater might be a better choice for fecal samples.
The use of FOBT cards to evaluate the gut microbiome could open up additional populations for large-scale epidemiologic research. The FOBT card is used in many settings for colorectal cancer screening. Large populations (21–24) around the world are being screened for colorectal cancer using FOBT cards. The Hemoccult Sensa Developer had little effect on the microbiome compared to those sampled with the undeveloped FOBT cards, suggesting that developed FOBT cards from colorectal cancer screening could be used for future microbiome research. Additionally, ease of use of the FOBT card and the microbiome stability they provide at ambient temperature opens up their use to new studies separate from the screening programs. Furthermore, FOBT cards can be easy to transport and store and overall be less than half the cost as compared to RNAlater. But the question remains whether the microbiome will be stable for long-term prospective study even if they are stored at −80°C.
Across all analyses, both laboratories found that unweighted UniFrac and Bray-Curtis distance analyses resulted in the most stable and reproducible beta diversity across all sampling methods. This is expected for unweighted UniFrac, which focuses on the difference in OTU membership (i.e. presence/absence) rather than OTU abundances, and for Bray-Curtis, which puts equal weights on all OTUs where relatively large variations in a few OTUs are reduced by averaging over all OTUs. In other words, while different storage methods may preserve different microbial species with differing efficiencies, they all capture the same community memberships. This is in contrast to weighted UniFrac distance, which puts the most weight on abundant lineages and whose variability is determined predominantly by the most abundant lineages, and to generalized Unifrac, which puts a partial weight on the abundant lineages. The implication is that, if the focus is on overall microbiota structure as revealed by unweighted UniFrac or Bray-Curtis distance, different sampling methods may not have a very strong impact. Analysis using phyla abundances contrasted starkly with these beta diversity measures in their reproducibility across different collection types.
We used the mixed-effect model-based ICC to quantify the three criteria for comparing storage methods, namely reproducibility, stability and accuracy. The mixed-effect framework allows easy decomposition of observed variability among different sources such as sample preparation and sequencing, storage time, and sample collection methods by calculating ICCs on different types of replicates. ICC quantifies the variability within the multiple measurements for the same sampling unit, and assumes that the errors from different measurements have exactly the same statistical distributions, and are indistinguishable from each other. However, if those measurements are from different methods, they may have significantly different biases. In accuracy analyses, where a large bias has been observed between different storage methods, the ICC is much smaller than Spearman’s correlation since the bias is treated as variability in the ICC calculation. However, for accuracy analysis, we are more interested in a storage method’s power to capture the relative differences between subjects. In that sense, the interclass correlation measures such as Spearman’s correlation are more suitable to quantify accuracy.
These data suggest that sampling in 70% ethanol does not render a sample stable across time. In support of our findings, other studies have shown that ethanol is an inadequate stabilization buffer, resulting in low DNA yields (25). By contrast, although RNAlater appeared to stabilize the microbiome across time, it resulted in considerable changes to the microbiome diversity, and therefore did not accurately preserve the microbial signature of the host. The method of collection that would yield the most accurate results would be to analyze the specimens immediately after collection. However, as this is neither practical nor possible in most cases, the gold standard has been to collect specimens with no additive and freezing soon after collection. However, whether this is the closest possible representation of the host's microbiome is debatable. No-additive samples were frozen shortly, but not immediately after collection, and were exposed to at least one freeze-thaw cycle, potentially influencing the microbiome. Specifically, a recent study found that freezing samples at −20°C for as little as five days significantly affects the Firmicutes-to-Bacteroidetes ratio (26).
The results of several analyses (including technical reproducibility, stability, and accuracy compared to assumed gold standard) differed between the two laboratories, stressing the potential problems currently associated with comparing or pooling data. There are a number of possible explanations for the observed differences between the Knight and Mayo Microbiome laboratories. First, frozen specimens were shipped to the Knight laboratory on dry ice, but it is possible that there were freeze-thaw episodes during shipping. Second, DNA extraction method may contribute to differences in DNA yield, composition, and richness (27, 28). Another possible source of variability is the primers used for PCR amplification. The 16S rRNA gene contains nine "hypervariable" regions that demonstrate considerable sequence diversity among different bacteria (29–31). Most microbial studies base their analyses on a single region of the 16s rRNA spanning one to three hypervariable regions. In this study, the Mayo Microbiome laboratory used a primer set spanning the V3–V5 hypervariable regions, whereas the Knight laboratory used primers amplifying only V4. This difference could contribute to differences in bacterial identification. A study of pathogenic bacteria determined that V2 and V3 were most useful for identifying bacterial species to the genus level while V4, V5, V7, and V8 were less useful (32). Another study found that the V1–V3 regions were superior to the V6 region in the ability to represent phylogenetic relationships (29). This suggests that the primers designed to amplify the V3–V5 region may distinguish more bacteria than those only amplifying the V4 region. However, when analyzing shorter rRNA segments (<100 bp reads), others have found the V2 and V4 regions to give the lowest error rates (33). In support of this, Lieu et al. found that the V2/V3/V4 regions provide excellent coverage and recovery at the genus level for short reads (31). Primer choice can also influence other, more technical aspects of the sequencing protocol, including PCR conditions, and optimal detection would rely on proper optimization of those conditions. However, despite the differences in the two laboratories, the conclusions regarding sampling method and freezing timepoint were the same irrespective of the laboratory.
A limitation to this study was the fact that only 16s sequencing methods were compared. It will be important to evaluate the influence of collection methods on whole genome shotgun metagenomic sequencing results.
In conclusion, sampling using the FOBT cards appeared to be the most practical for field studies and produced reproducible, stable, and accurate data as determined by both laboratories, and development using Hemoccult Sensa Developer did not appear to alter these results. However, significant differences in microbial diversity across time and laboratories strongly suggest that any major fecal microbiome study be conducted in a single laboratory using similar collection protocol method to minimize these differences.
Supplementary Material
Acknowledgments
We acknowledge Xianfeng Chen, William Lunt, Adam Robbins-Pianka, Yoshiki Vazquez Baeza, Grant Gogul, James Gaffney and Greg Humphrey for their technical assistance, and Patricio Jeraldo for his insightful discussions.
Financial support: This work was supported by the Intramural Research Program of the National Cancer Institute. N. Chia was supported by a grant from the National Institutes of Health [1R01CA179243] and R. Knight was supported by the Howard Hughes Medical Institute and the Sloan Foundation awards.
REFERENCES
- 1.Gough EK, Stephens DA, Moodie EE, Prendergast AJ, Stoltzfus RJ, Humphrey JH, et al. Linear growth faltering in infants is associated with Acidaminococcus sp. and community-level changes in the gut microbiota. Microbiome. 2015;3:24. doi: 10.1186/s40168-015-0089-2. [DOI] [PMC free article] [PubMed] [Google Scholar]
- 2.Raman M, Ahmed I, Gillevet PM, Probert CS, Ratcliffe NM, Smith S, et al. Fecal microbiome and volatile organic compound metabolome in obese humans with nonalcoholic fatty liver disease. Clin Gastroenterol Hepatol. 2013;11:868–875. e1–e3. doi: 10.1016/j.cgh.2013.02.015. [DOI] [PubMed] [Google Scholar]
- 3.Nelson AM, Walk ST, Taube S, Taniuchi M, Houpt ER, Wobus CE, et al. Disruption of the human gut microbiota following Norovirus infection. PloS one. 2012;7:e48224. doi: 10.1371/journal.pone.0048224. [DOI] [PMC free article] [PubMed] [Google Scholar]
- 4.Estrada-Velasco BI, Cruz M, Garcia-Mena J, Valladares Salgado A, Peralta Romero J, Guna Serrano Mde L, et al. Childhood obesity is associated to the interaction between firmicutes and high energy food consumption. Nutr Hosp. 2014;31:1074–1081. doi: 10.3305/nh.2015.31.3.8302. [DOI] [PubMed] [Google Scholar]
- 5.Engsbro AL, Stensvold CR, Vedel Nielsen H, Bytzer P. Prevalence, incidence, and risk factors of intestinal parasites in Danish primary care patients with irritable bowel syndrome. Scand J Infect Dis. 2014;46:204–209. doi: 10.3109/00365548.2013.861609. [DOI] [PubMed] [Google Scholar]
- 6.McCoy AN, Araujo-Perez F, Azcarate-Peril A, Yeh JJ, Sandler RS, Keku TO. Fusobacterium is associated with colorectal adenomas. PloS one. 2013;8:e53653. doi: 10.1371/journal.pone.0053653. [DOI] [PMC free article] [PubMed] [Google Scholar]
- 7.Zeller G, Tap J, Voigt AY, Sunagawa S, Kultima JR, Costea PI, et al. Potential of fecal microbiota for early-stage detection of colorectal cancer. Mol Syst Biol. 2014;10:766. doi: 10.15252/msb.20145645. [DOI] [PMC free article] [PubMed] [Google Scholar]
- 8.Ahn J, Sinha R, Pei Z, Dominianni C, Wu J, Shi J, et al. Human gut microbiome and risk for colorectal cancer. J Natl Cancer Inst. 2013;105:1907–1911. doi: 10.1093/jnci/djt300. [DOI] [PMC free article] [PubMed] [Google Scholar]
- 9.Franzosa EA, Hsu T, Sirota-Madi A, Shafquat A, Abu-Ali G, Morgan XC, et al. Sequencing and beyond: integrating molecular 'omics' for microbial community profiling. Nat Rev Microbiol. 2015 doi: 10.1038/nrmicro3451. [DOI] [PMC free article] [PubMed] [Google Scholar]
- 10.Rubin BE, Gibbons SM, Kennedy S, Hampton-Marcell J, Owens S, Gilbert JA. Investigating the impact of storage conditions on microbial community composition in soil samples. PloS one. 2013;8:e70460. doi: 10.1371/journal.pone.0070460. [DOI] [PMC free article] [PubMed] [Google Scholar]
- 11.Lauber CL, Zhou N, Gordon JI, Knight R, Fierer N. Effect of storage conditions on the assessment of bacterial community structure in soil and human-associated samples. FEMS Microbiol Lett. 2010;307:80–86. doi: 10.1111/j.1574-6968.2010.01965.x. [DOI] [PMC free article] [PubMed] [Google Scholar]
- 12.Bai G, Gajer P, Nandy M, Ma B, Yang H, Sakamoto J, et al. Comparison of storage conditions for human vaginal microbiome studies. PloS one. 2012;7:e36934. doi: 10.1371/journal.pone.0036934. [DOI] [PMC free article] [PubMed] [Google Scholar]
- 13.Dominianni C, Wu J, Hayes RB, Ahn J. Comparison of methods for fecal microbiome biospecimen collection. BMC Microbiol. 2014;14:103. doi: 10.1186/1471-2180-14-103. [DOI] [PMC free article] [PubMed] [Google Scholar]
- 14.Caporaso JG, Lauber CL, Walters WA, Berg-Lyons D, Huntley J, Fierer N, et al. Ultra-high-throughput microbial community analysis on the Illumina HiSeq and MiSeq platforms. ISME J. 2012;6:1621–1624. doi: 10.1038/ismej.2012.8. [DOI] [PMC free article] [PubMed] [Google Scholar]
- 15.Gilbert JA, Meyer F, Jansson J, Gordon J, Pace N, Tiedje J, et al. The Earth Microbiome Project: Meeting report of the "1 EMP meeting on sample selection and acquisition" at Argonne National Laboratory October 6 2010. Stand Genomic Sci. 2010;3:249–253. doi: 10.4056/aigs.1443528. [DOI] [PMC free article] [PubMed] [Google Scholar]
- 16.Walters WA, Caporaso JG, Lauber CL, Berg-Lyons D, Fierer N, Knight R. PrimerProspector: de novo design and taxonomic analysis of barcoded polymerase chain reaction primers. Bioinformatics. 2011;27:1159–1161. doi: 10.1093/bioinformatics/btr087. [DOI] [PMC free article] [PubMed] [Google Scholar]
- 17.Caporaso JG, Kuczynski J, Stombaugh J, Bittinger K, Bushman FD, Costello EK, et al. QIIME allows analysis of high-throughput community sequencing data. Nat Methods. 2010;7:335–336. doi: 10.1038/nmeth.f.303. [DOI] [PMC free article] [PubMed] [Google Scholar]
- 18.DeSantis TZ, Hugenholtz P, Larsen N, Rojas M, Brodie EL, Keller K, et al. Greengenes, a chimera-checked 16S rRNA gene database and workbench compatible with ARB. Applied and environmental microbiology. 2006;72:5069–5072. doi: 10.1128/AEM.03006-05. [DOI] [PMC free article] [PubMed] [Google Scholar]
- 19.Chen J, Bittinger K, Charlson ES, Hoffmann C, Lewis J, Wu GD, et al. Associating microbiome composition with environmental covariates using generalized UniFrac distances. Bioinformatics. 2012;28:2106–2113. doi: 10.1093/bioinformatics/bts342. [DOI] [PMC free article] [PubMed] [Google Scholar]
- 20.McArdle BH, Anderson MJ. Fitting multivariate models to community data: a comment on distance-based redundancy analysis. Ecology. 2001;82:290–297. [Google Scholar]
- 21.Blanks RG, Benson VS, Alison R, Brown A, Reeves GK, Beral V, et al. Nationwide bowel cancer screening programme in England: cohort study of lifestyle factors affecting participation and outcomes in women. Br J Cancer. 2015;112:1562–1567. doi: 10.1038/bjc.2015.69. [DOI] [PMC free article] [PubMed] [Google Scholar]
- 22.Ricardo-Rodrigues I, Jimenez-Garcia R, Hernandez-Barrera V, Carrasco-Garrido P, Jimenez-Trujillo I, Lopez-de-Andres A. Adherence to and predictors of participation in colorectal cancer screening with faecal occult blood testing in Spain, 2009–2011. Eur J Cancer Prev. 2014 doi: 10.1097/CEJ.0000000000000088. [DOI] [PubMed] [Google Scholar]
- 23.Libby G, Brewster DH, McClements PL, Carey FA, Black RJ, Birrell J, et al. The impact of population-based faecal occult blood test screening on colorectal cancer mortality: a matched cohort study. Br J Cancer. 2012;107:255–259. doi: 10.1038/bjc.2012.277. [DOI] [PMC free article] [PubMed] [Google Scholar]
- 24.Pignone M. Faecal occult-blood screening in Burgundy. Lancet. 2004;364:741–742. doi: 10.1016/S0140-6736(04)16953-5. [DOI] [PubMed] [Google Scholar]
- 25.Kilpatrick CW. Noncryogenic preservation of mammalian tissues for DNA extraction: an assessment of storage methods. Biochem Genet. 2002;40:53–62. doi: 10.1023/a:1014541222816. [DOI] [PubMed] [Google Scholar]
- 26.Bahl MI, Bergstrom A, Licht TR. Freezing fecal samples prior to DNA extraction affects the Firmicutes to Bacteroidetes ratio determined by downstream quantitative PCR analysis. FEMS Microbiol Lett. 2012;329:193–197. doi: 10.1111/j.1574-6968.2012.02523.x. [DOI] [PubMed] [Google Scholar]
- 27.Kennedy NA, Walker AW, Berry SH, Duncan SH, Farquarson FM, Louis P, et al. The impact of different DNA extraction kits and laboratories upon the assessment of human gut microbiota composition by 16S rRNA gene sequencing. PloS one. 2014;9:e88982. doi: 10.1371/journal.pone.0088982. [DOI] [PMC free article] [PubMed] [Google Scholar]
- 28.Cruaud P, Vigneron A, Lucchetti-Miganeh C, Ciron PE, Godfroy A, Cambon-Bonavita MA. Influence of DNA extraction method, 16S rRNA targeted hypervariable regions, and sample origin on microbial diversity detected by 454 pyrosequencing in marine chemosynthetic ecosystems. Applied and environmental microbiology. 2014;80:4626–4639. doi: 10.1128/AEM.00592-14. [DOI] [PMC free article] [PubMed] [Google Scholar]
- 29.Jeraldo P, Chia N, Goldenfeld N. On the suitability of short reads of 16S rRNA for phylogeny-based analyses in environmental surveys. Environ Microbiol. 2011;13:3000–3009. doi: 10.1111/j.1462-2920.2011.02577.x. [DOI] [PubMed] [Google Scholar]
- 30.Liu Z, Lozupone C, Hamady M, Bushman FD, Knight R. Short pyrosequencing reads suffice for accurate microbial community analysis. Nucleic Acids Res. 2007;35:e120. doi: 10.1093/nar/gkm541. [DOI] [PMC free article] [PubMed] [Google Scholar]
- 31.Liu Z, DeSantis TZ, Andersen GL, Knight R. Accurate taxonomy assignments from 16S rRNA sequences produced by highly parallel pyrosequencers. Nucleic Acids Res. 2008;36:e120. doi: 10.1093/nar/gkn491. [DOI] [PMC free article] [PubMed] [Google Scholar]
- 32.Chakravorty S, Helb D, Burday M, Connell N, Alland D. A detailed analysis of 16S ribosomal RNA gene segments for the diagnosis of pathogenic bacteria. J Microbiol Methods. 2007;69:330–339. doi: 10.1016/j.mimet.2007.02.005. [DOI] [PMC free article] [PubMed] [Google Scholar]
- 33.Wang Q, Garrity GM, Tiedje JM, Cole JR. Naive Bayesian classifier for rapid assignment of rRNA sequences into the new bacterial taxonomy. Appl Environ Microbiol. 2007;73:5261–5267. doi: 10.1128/AEM.00062-07. [DOI] [PMC free article] [PubMed] [Google Scholar]
Associated Data
This section collects any data citations, data availability statements, or supplementary materials included in this article.


