Abstract
We previously described a novel beamforming method that images the spatial correlation of an echo wave field with demonstrated applications to clutter reduction in high-noise environments. In this paper, several characteristics of the resolution and brightness of short-lag spatial coherence (SLSC) images formed by this method are compared with B-mode images formed by conventional delay-and-sum beamforming methods. Point target widths were measured to estimate resolution, the autocorrelation of image texture was measured to estimate texture size, and the contrast (i.e., brightness ratio) of clinically relevant targets was assessed. SLSC images demonstrate improved resolution and contrast with increasing values of channel noise and clutter, whereas B-mode resolution was degraded in the presence of high noise (i.e., > −12 dB channel noise-to-signal ratios) and high clutter magnitudes (i.e., > −21 dB relative to point target magnitude). Lateral resolution in SLSC images was improved with increasing lag value, whereas axial resolution was degraded with increasing correlation kernel length. The texture size of SLSC images was smaller than that of matched B-mode images. Results demonstrate that the resolution and contrast of coherence-based images depend on a range of parameters, but are generally superior to those of matched B-mode images under challenging imaging conditions.
I. Introduction
Conventional B-mode images from difficult-to-image patients contain high clutter magnitudes that obscure important anatomical features. This clutter can be reduced with short-lag spatial coherence (SLSC) imaging, a relatively novel approach to ultrasound image formation that utilizes local measurements of the spatial coherence of backscattered echoes [1]. Previous phantom, simulation, and in vivo studies show that over a wide range of target sizes and imaging environments, SLSC outperforms B-mode images in contrast, contrast-to-noise ratio (CNR), and SNR comparisons, particularly in high-noise environments [1]–[5].
The utility of SLSC as a clutter-reduction technique was additionally demonstrated in several clinical applications, including cardiac [2], [6], [7], liver [3], fetal [4], and vascular imaging [1], [5], [8]. Cardiologists determined that SLSC imaging offered 22% to 33% improvement in endocardial border visibility when B-mode image quality was poor. These improvements were both statistically and clinically significant [2]. The mean contrast of anechoic targets in poor-quality fetal images was improved from 15 dB to 27 dB with SLSC beamforming [9]. In addition, the SLSC liver images of 17 patients demonstrated sharper delineation of blood vessel walls, suppressed clutter inside the vessel lumen, and reduced speckle-like texture in surrounding tissue compared with matched B-mode images, with mean contrast and CNR improvements of 6.78 dB and 1.13, respectively [3]. In all of these clinical applications, a harmonic imaging counterpart to SLSC imaging outperformed conventional harmonic imaging [3], [6], [9], [10], which is a widely accepted clutter-reduction approach that is not always sufficient [11], [12]. Thus, this coherence-based beamforming approach primarily aims to improve clinical cases where existing clutter reduction methods fail.
The characteristics of an important SLSC image performance metric, resolution, is poorly understood in comparison to that of B-mode images. Resolution is traditionally assessed by characterizing the input-output frequency response of sinusoidally varying targets and creating a modulation transfer function [13]–[15]. Another common approach is to either measure the full-width at half-maximum (FWHM) of a point target [16] or estimate the minimum distance at which two closely spaced point targets can be resolved. Alternatively, texture size can be used to approximate the resolution of an ultrasound imaging system [17]. Wagner et al. [18] demonstrated that the autocorrelation of texture (i.e., speckle) in the focal zone of B-mode images is equivalent to the autoconvolution of the imaging system’s point spread function (PSF). The FWHM of this autocorrelation function was shown to be approximately equal to the resolution of the B-mode imaging system (i.e., proportional to the pulse length in the axial dimension and λz/D in the lateral dimension, where λ is the ultrasonic wavelength, z is the axial focus, and D is the active transducer aperture width). Thus, B-mode image resolution at the focus can be determined from the autocorrelation of speckle.
SLSC resolution was previously described using step targets because the size of a point target varied depending on surrounding targets and SNR [1], [19]. This is similar to data-dependent or adaptive beamformers, for which the beam characteristics change as a function of the received echo data [20]–[23]. In minimum variance beamforming, for example, the covariance of time-delayed echo data is calculated to determine the optimal receive aperture apodizations for suppressing noise and clutter in ultrasound images. Although the SLSC beamformer does not utilize aperture apodizations based on received data, images created with this beamformer are nonlinearly affected by the target type and its surrounding environment, creating several challenges when quantifying the resolution of this coherence-based beamformer.
The purpose of this paper is to identify the phenomena that affect SLSC image resolution, highlight their relationships to contrast, and perform quantitative comparisons to related metrics in conventional B-mode imaging. In addition, challenges with applying some of the common resolution metrics to SLSC images are elucidated with novel insights that are transferable to other coherence-based beamformers.
II. Methods
A. Modeling Sinusoidal SLSC Profiles
SLSC imaging is based on the van Cittert–Zernike (VCZ) theorem [24] applied to pulse–echo ultrasound [25]. This theorem predicts the spatial coherence, 𝒞, of a wave-front and can be expressed as
| (1) |
where ℱ denotes the spatial Fourier transform, H is the transmit beam pressure, and χ is the amplitude profile of the target being imaged (i.e., the target reflectivity profile, which might be constant if modeling uniform tissue or a square pulse if modeling a lesion).
Although often described as a one-dimensional function, the spatial coherence of backscattered echoes is a two-dimensional function. The spatial coherence for a rectangular aperture is separable in the lateral and elevation aperture dimensions; thus, we initially consider a transmit beam pressure at the focus modeled by H(x) = D/(λz) sinc (D/(λz)x). Note that this model of spatial coherence is valid at the focal depth of the transmit beam, whereas a model of spatial coherence outside of the focal zone was presented in a previous publication [26]. A sinusoidal target was modeled to investigate the basic properties of modulation transfer functions for resolution estimates. The reflectivity profile of this target is described by χ(x) = cos(2πuox), where uo is the lateral spatial frequency of the sinusoidal target and x represents the lateral dimension of the aperture.
By applying the convolution property of Fourier transforms to (1), the spatial coherence of backscattered waves can be computed as a function of spatial frequency, u:
| (2) |
where Λ denotes the triangle function, * denotes the convolution operator, and the relationship between u and x is
| (3) |
Eq. (2) represents a coherence function when the main lobe of the transmit beam is aligned with a peak in the cosine wave. As the transmit beam is laterally translated by x0, the coherence function becomes:
| (4) |
Note that shifting the target relative to the transmit beam yields the same spatial coherence functions as shifting the transmit beam relative to the target, according to the commutative property of convolution. Thus, to simplify this analysis, the target is shifted instead of the transmit beam, as follows:
| (5) |
Note that (5) contains real and imaginary components; thus, the magnitude of this equation is given by (6). Eq. (6) demonstrates that as the transmit beam is laterally translated by x0, a target with a single spatial frequency (u0) results in coherence functions that are the sum of multiple triangle functions with varied slopes and varied spatial frequencies. A subset of the individual triangle functions are weighted by a cosine term that varies as a function of x0.
Mathematica software (Wolfram Research, Champaign, IL, USA) was used to plot (6) as a function of u and x0. The lag between echo correlations, m, is related to spatial frequency, u, through (3) and the definition x = m · pitch,
| (6) |
where the pitch is the distance between the centers of adjacent transducer elements. Thus,
| (7) |
Fig. 1 shows the normalized theoretical spatial coherence as a function of m and x0. As x0 is varied, |𝒞(u,x0)| exhibits variations resulting from combinations of triangle functions with different heights and slopes. The integral of Fig. 1 in the “Lag” dimension from 0 to M for each value of x0 yields the lateral profile at depth z in a SLSC image:
| (8) |
Fig. 1.
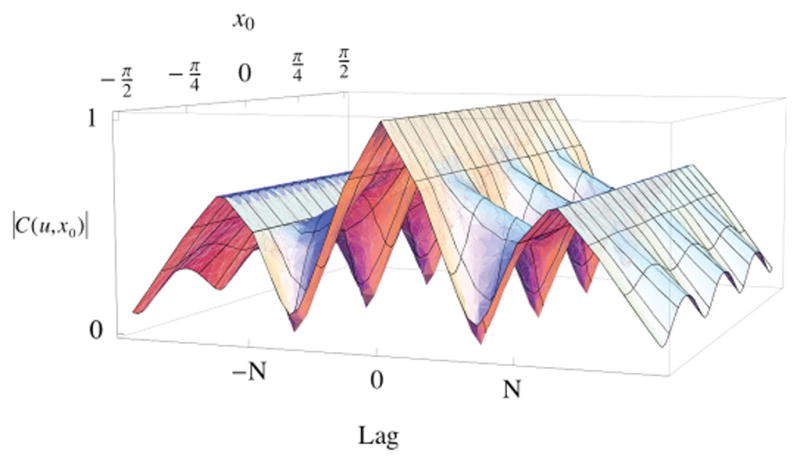
Theoretical normalized coherence functions for a narrowband sinusoidally varying target. As the transmit beam is laterally translated by x0 to form an SLSC image, the coherence function at each value of x0 is a sum of multiple triangle functions. N is the number of transducer elements in the transmit aperture. Lag refers to the spacing between transducer elements.
Eq. (8) may then be used to display the lateral SLSC profiles at the focus.
B. Field II Simulations
Field II [27] was used to simulate the individual-channel, RF echo signals received from point targets and diffuse scatterers. The simulated transducer was a 96-element linear array with a 5.71 MHz center frequency and 60% fractional bandwidth. The array had a lens focused at 3.75 cm in elevation, and the lateral focus was positioned at the same depth. Dynamic-receive delays were applied to the channel signals. No apodization was applied to the transmit aperture. Unless otherwise stated, an F/2 transmit aperture was employed, which corresponds to 93 transmit elements for the 3.75-cm focus. The parameters of the simulated transducer are listed in Table I. B-mode and SLSC image processing and the following data analyses were performed with Matlab (The MathWorks Inc., Natick, MA) software.
TABLE I.
Simulated Transmit Wave and Transducer Parameters.
| Parameter | Value |
|---|---|
| Number of elements | 96 |
| Element height | 7.5 mm |
| Element width | 0.176 mm |
| Kerf | 0.025 mm |
| Width of transducer (D) | 18.7 mm |
| Center frequency | 5.71 MHz |
| Wavelength (λ) | 0.270 mm |
| Sampling frequency | 160 MHz |
| Fractional bandwidth | 60% |
| Focus (z) | 37.5 mm |
C. SLSC and B-Mode Image Formation From Echo Data
The short-lag spatial coherence is measured from echo data using the following equations:
| (9) |
| (10) |
where R̂ (m) is the normalized spatial coherence across the receive aperture [28]; m is the lateral spacing, or lag, between two elements on the receive aperture; N is the number of receive elements; si(n) is the time-delayed signal received by the ith element at depth, or time, n, expressed in number of samples; Rsl is the short-lag spatial coherence; and M is the maximum number of lags integrated to make an SLSC image. The value of M typically corresponds with 1% to 30% of the transmit aperture. The relationship between M and resolution is evaluated in Section III-C.
One pixel in an SLSC image is formed by computing (9) and (10) at depth n of the channel signals, using a correlation kernel size, k, equal to n2 − n1 and centered about n. This process is repeated for a range of axial and lateral positions to create an SLSC image. Matched B-mode images are constructed by applying a conventional delay- and-sum beamformer to the same channel signals used to make SLSC images. The size of the correlation kernel impacts the quality of the correlation calculation as well as the axial resolution of SLSC images. Unless otherwise stated, SLSC images were created with k approximately equal to one wavelength. The relationship between k and resolution is evaluated in more detail in Section III-C.
D. Point Target Measurements
Uniform white noise was simulated with a random number generator and band-pass filtered with cutoff frequencies equal to the −6-dB band limits of the transducer to simulate acoustic noise received by the transducer. This noise was added to the simulated channel signals to simulate reverberation and mitigate the coherence of low-amplitude echoes. Unless otherwise stated, noise was added such that the channel noise-to-signal ratio (NSR) was −10 dB, which is within the range of typical channel NSR measured in vivo [29]. To evaluate the relationship between channel noise and resolution in B-mode and SLSC images, axial and lateral point target widths were measured as the channel NSR was varied from −40 dB to 20 dB.
Axial and lateral resolution were measured as the FWHM of the point targets (i.e., the −6-dB point target width). The −10-dB, and −20-dB point target widths were also measured. In some cases, the amplitude of the noise floor was greater than −6, −10, and/or −20 dB, and therefore the width of the point target at these levels could not be measured.
Noise from off-axis scatterers, a common source of clutter in ultrasound images, was simulated by flanking a point target with two 2 mm (axial) × 2 mm (lateral) × 1 mm (elevation) blocks of diffuse scatterers. The inner edges of the blocks were separated by 4 mm in the lateral dimension. Their presence created scattering within the isochronous volume of the transmit beam. Clutter in the B-mode image was measured within a square region centered on the point target, with inner and outer dimensions of 0.6 × 0.6 mm and 1 × 1 mm, respectively. This clutter was measured relative to the average signal in a 0.2 × 0.2 mm (axial × lateral) square region centered on the point target. The amplitude of the blocks was varied such that the measured clutter surrounding the point target in the B-mode image ranged from −83 to −21 dB, relative to the point target. Axial and lateral point target widths in B-mode and SLSC images created from the same channel data were calculated as a function of the measured clutter magnitudes in the B-mode images. Measurements were repeated for six independent speckle realizations. No noise was added to simulated data for this experiment.
Axial and lateral resolution at the focus of SLSC images was measured for values of M ranging from 4 to 96 (i.e., 4 ≤ M ≤ 96) and compared with B-mode images created with 4 to 96 receive elements (i.e., 4 ≤ N ≤ 96). In addition, the correlation kernel length used to create SLSC images with M = 20 was varied from 1/4λ to 6λ, and axial and lateral point target widths were measured for each correlation kernel length. Noise was added to these simulations such that the channel NSR was −10 dB. Note that although M had a specific value (e.g., M = 4), all elements were used to calculate R̂(m), as described by (9).
E. Autocorrelation Measurements
Simulated SLSC and B-mode images of diffuse scatterers were utilized to measure the autocorrelation of image texture at the focal depth. The simulated phantom measured 25 mm axially by 10 mm laterally by 10 mm in elevation and contained 40 scatterers per resolution volume. To calculate lateral texture size, a 1.7 × 4.1 mm (axial x lateral) kernel in the focal zone was correlated with an 8.0 mm lateral search region from the same image, centered about the kernel. To calculate axial texture size, a 1.7 × 8.0 mm (axial × lateral) kernel in the focal zone was correlated with a 2.4 mm axial search region from the same image, centered about the kernel. The FWHM of the resulting autocorrelation functions were recorded as a function of M for SLSC images and as a function of N for B-mode images. This measurement was repeated for six independent speckle realizations. No noise was added to these simulations.
Paired two-sample t-tests were performed on the B-mode measurements obtained with the full receive aperture (N = 96) and the SLSC measurements obtained at each value of M to determine the statistical significance of differences between B-mode and SLSC lateral autocorrelation measurements. Differences were considered statistically significant for values of p < 0.05.
F. Brightness Measurements
The phantom that created the simulated B-mode and SLSC images of the diffuse scatterers described in Section II-E were utilized to make brightness measurements using F/2 and F/3 transmit beams. Brightness was measured as a function of depth in B-mode and SLSC images created with M = 5, 10, or 20. Each SLSC image was normalized to its maximum value at the focus before calculating brightness.
In addition, noise was added to channel signals described in Section II-E, resulting in channel NSRs that ranged from −∞ to +40 dB at the focus. Brightness was measured at the focus and evaluated as a function of channel NSR in B-mode and SLSC images. B-mode brightness was evaluated before log compression. B-mode results were normalized to the mean brightness measured at +40 dB, whereas each SLSC image was normalized to its maximum value at the focus before calculating brightness.
G. Experimental Setup
A Verasonics ultrasound scanner (Redmond, WA, USA) and ATL P4-2 probe were used to acquire experimental RF data from individual channel elements with an F/2 transmit beam. The probe contained 64 elements, the transmit frequency was 2.5 MHz, and the focus was 4 cm. This configuration was used to image a CIRS ultrasound phantom (Model 54, Computerized Imaging Reference Systems Inc., Norfolk, VA, USA) containing point targets and lesions embedded in a speckle-generating background. Matched B-mode and SLSC images with and without added noise were created from these data to demonstrate some of the characteristic trends of resolution in SLSC images. The mean brightness of the tissue region and the point target at the focus were compared in matched B-mode and SLSC images as a function of added channel noise. The measured channel NSR ranged from −∞ to +40 dB. B-mode results were normalized to the mean brightness measured at +40 dB. Each SLSC image was created with M = 20 and normalized to its brightest value.
III. Results and Discussion
A. Nonlinearity of SLSC Images
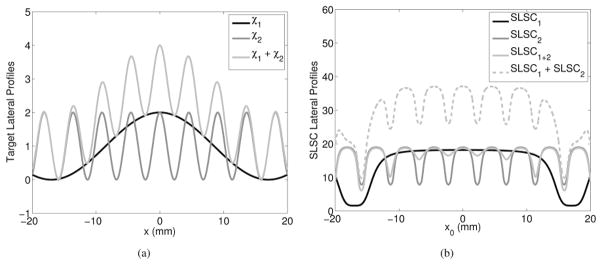
A lateral transmit beam pressure modeled by H(x) = D sinc (D/(λz)x), with D, λ, and z defined in Table I, was used to image the three different sinusoidal targets shown in Fig. 2(a): χ1 = 1 + cos(0.2x), χ2 = 1 + cos(1.4x), and χ1 + χ2 = 2 + cos(0.2x) + cos(1.4x). Traditional delay- and-sum beamforming methods measure and display differences in echo amplitude, and each sinusoidal target in Fig. 2(a) would yield a B-mode image with a lateral profile that is identical to the target profile, blurred by the PSF. The corresponding SLSC images calculated from these target profiles using (8), denoted as SLSC1, SLSC2, and SLSC1+2, respectively, are shown in Fig. 2(b), along with the sum of SLSC1 and SLSC2.
Fig. 2.
(a) Sinusoidally varying target profiles described by cosine functions: χ1 = 1 + cos(0.2x), χ2 = 1 + cos(1.4x), and χ1 + χ2 = 2 + cos(0.2x) + cos(1.4x), which also represent the expected B-mode image profiles of these targets. (b) Corresponding theoretical predictions of the SLSC image profiles of the three target geometries, denoted as SLSC1, SLSC2, and SLSC1+2, respectively. The sum of the SLSC images predicted for geometries χ1 and χ2 (i.e., SLSC1 + SLSC2) indicates that SLSC imaging is a nonlinear process, because SLSC1 + SLSC2 ≠ SLSC1+2.
According to the additive property of linear systems, the SLSC imaging process is nonlinear because SLSC1 + SLSC2 ≠ SLSC1+2. Because linearity is a criteria for transfer function analyses and other resolution metrics based on linear systems theory [13], the nonlinear characteristics of SLSC images invalidate sinusoidal-based transfer function analyses. Although this analysis was simplified for 1-D transmit beams and target reflectivity profiles, the same nonlinear relationship is expected in 2-D.
The amplitude differences in the SLSC image profiles shown in Fig. 2(b) occur because local changes in spatial coherence are required to achieve contrast in SLSC images [1]. The changes in coherence, however, are not independent of the changes in amplitude. Thus, an ideal approach to determine SLSC resolution is to control local differences in both spatial coherence and signal amplitude. Such an approach can be simulated but is not physically realizable.
B. Resolution as a Function of Channel Noise and Clutter
A simulated B-mode image of a point target is shown in Fig. 3(a). The point target in the SLSC image of Fig. 3(b) is larger and has reduced resolution, compared with the B-mode image, because the lower-amplitude echoes produced when the transmit beam is at the edge of the point target are spatially coherent. In the presence of low-amplitude, spatially incoherent noise, representative of acoustic clutter, the resolution of the point target is more similar to that of the B-mode image, as demonstrated in Fig. 3(c). The SLSC resolution is improved in this case because the added noise reduces the coherence of the low-amplitude signals at the edge of the point target.
Fig. 3.
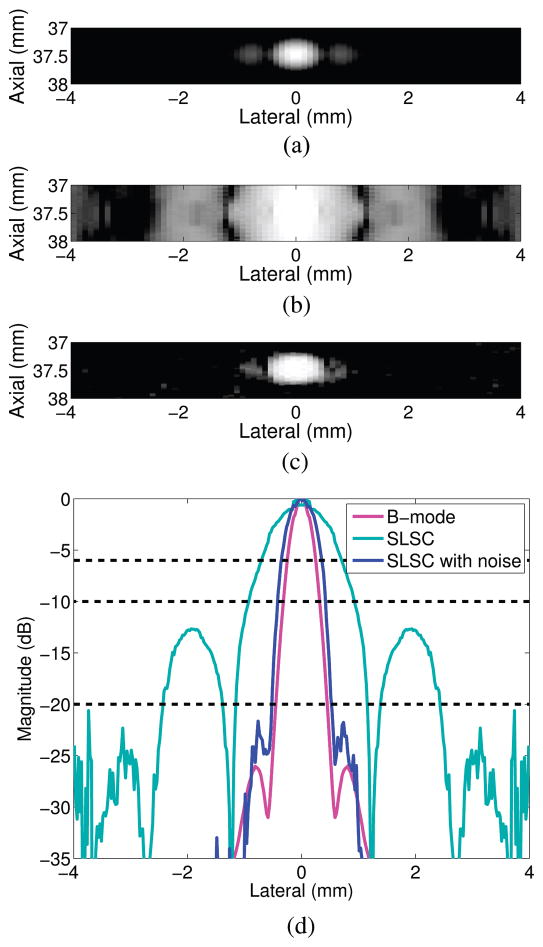
(a) B-mode image of a point target with no noise added to the channel data. (b and c) SLSC (M = 20) images of a point target in the absence and presence of −10 dB channel noise, respectively. (d) Lateral point spread functions derived from the point target images.
The lateral beamplots created from the point targets in Figs. 3(a)–3(c) are shown in Fig. 3(d). Side lobes are reduced in the SLSC image with noise, compared with the B-mode image and the SLSC image without noise. The lateral beamwidths at −6 dB confirm that lateral resolution is worse in the SLSC image without noise, when compared with the SLSC image with noise and the B-mode image.
Axial and lateral point target widths measured as a function of noise levels are displayed in Figs. 4(a) and 4(b), respectively, for matched B-mode and SLSC images. The plots indicate that the resolution of SLSC images improves with increasing noise, whereas the resolution of B-mode images is relatively constant at the lower noise values. Axial B-mode resolution is degraded as the channel NSR approaches −12 dB, whereas lateral B-mode resolution is degraded as the channel NSR approaches −6 dB. There are no beamwidth measurements for cases in which the amplitude of the noise floor was greater than −6, −10, and/or −20 dB. For NSR values greater than +12 dB, the point target was no longer visualized in the SLSC image, and thus resolution could not be measured.
Fig. 4.
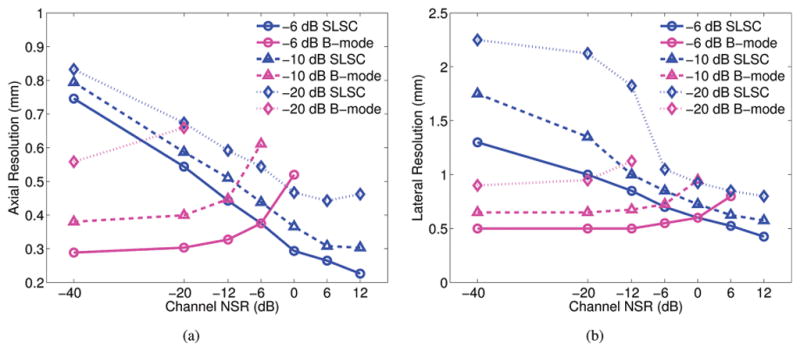
(a) Axial and (b) lateral point target widths as a function channel noise-to-signal ratios (NSRs), measured at −6, −10, and −20 dB. The side lobes are reduced and resolution is improved in SLSC images with increasing noise.
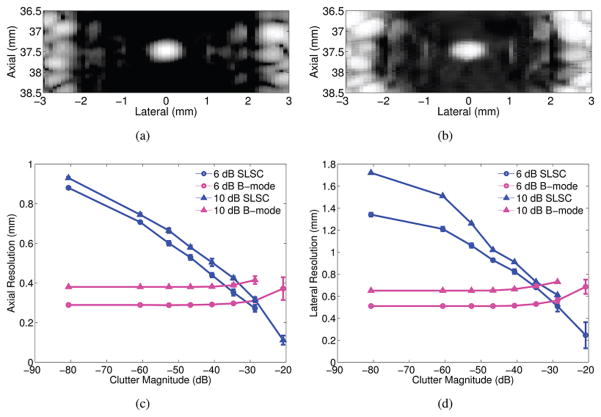
Fig. 5 displays B-mode and SLSC images of a point target in the center of two scattering regions. In the B-mode image [Fig. 5(a)], the measured clutter surrounding the point target is −37 dB relative to the point target. The amplitudes of the diffuse scatterer regions were varied to alter the clutter magnitude surrounding the point target. Axial and lateral point target widths are shown in Figs. 5(c) and 5(d), respectively, as a function of the clutter magnitude measured in the B-mode images. Resolution is relatively constant for most clutter magnitudes in the B-mode images, and starts to degrade for clutter magnitudes ≥−29 dB. However, the resolution of SLSC images improves as clutter magnitudes increase. Note that the point target visibility was obscured in the presence of −21 dB clutter magnitude, although Figs. 5(c) and 5(d) indicate improved resolution in the SLSC images for this clutter magnitude.
Fig. 5.
Matched (a) B-mode and (b) SLSC images of a point target in the presence of off-axis scatterers with −27 dB clutter magnitude relative to the peak of the point target in the B-mode image. (c) Axial and (d) lateral point target widths measured at −6 and −10 dB as a function of clutter magnitude.
Off-axis clutter is a source of channel noise; thus, the similarity between Figs. 4 and 5 is expected. The presence of spatially incoherent noise or clutter improves SLSC image resolution because it reduces the coherence of low-amplitude coherent signals without significantly affecting the coherence of higher-amplitude point targets or hyperechoic lesions. Fig. 5 indicates poor B-mode and better SLSC point target widths between −29 and −21 dB clutter magnitudes, which is within the range of clinically relevant values of in vivo clutter (i.e., −35 to 0 dB relative to surrounding tissue [30]).
Given the linearity of B-mode imaging, characteristic speckle noise can be superimposed on these point target results to determine theoretical expectations in the presence of speckle. However, empirical analyses of resolution in the presence of speckle are required to understand the effects of speckle-like texture for the nonlinear SLSC imaging method, as presented in Sections III-C and III-E.
C. Resolution and Texture Size Versus SLSC Imaging Parameters
Axial point target widths as a function of the correlation kernel length used to create SLSC images are shown in Fig. 6, with the B-mode −6-dB axial point target width shown as a reference. The axial resolution of SLSC images worsens as the kernel length increases. Lateral point target widths (not shown) were relatively constant for the lower values of kernel length (k < 2λ). Contrast is expected to degrade at subwavelength values of k because of poorer correlation estimates at the smaller kernel lengths [31].
Fig. 6.
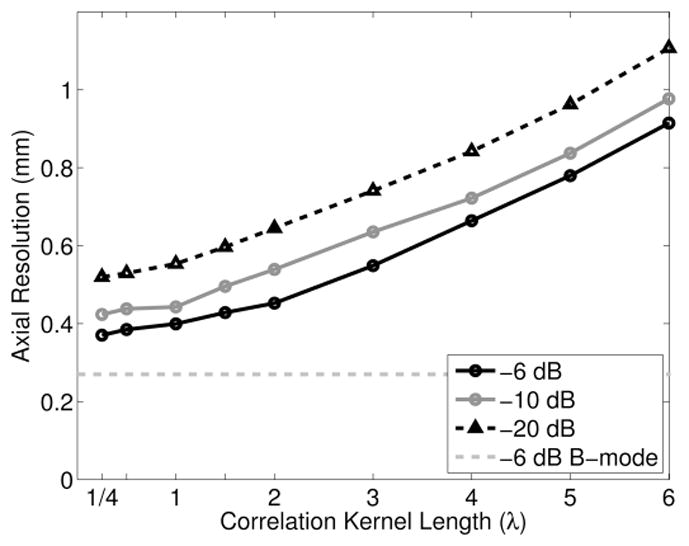
Axial point target width as a function of the correlation kernel length used to create SLSC images, measured at −6, −10, and −20 dB, in the presence of −10 dB channel noise. The B-mode −6-dB axial point target width (measured without added noise) is shown as a reference.
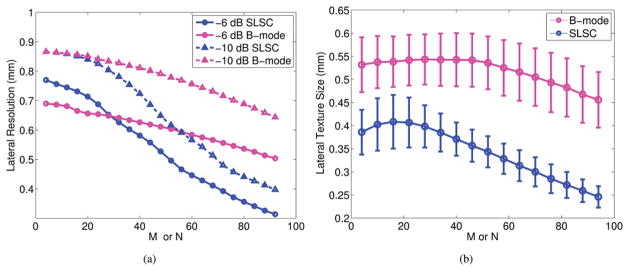
Lateral point target width as a function of the short-lag value (M) used to create SLSC images and as a function of the number of receive elements (N) used to create B-mode images is shown in Fig. 7(a). Lateral resolution improves as M or N increases. Although the best SLSC resolution can be obtained with larger values of M, our previous results indicate that these higher values of M offer worse CNR and SNR, and thus lower values of M are optimal [1].
Fig. 7.
(a) Lateral point target widths as a function of M for SLSC images and N for B-mode images, measured at −6 and −10 dB. (b) Lateral texture size as a function of M and N, measured from the −6-dB width of the autocorrelation function. M is the short-lag value used to make SLSC images. N is the number of receive elements used to make B-mode images.
The lateral point target widths at the short lags (M ≤ 30) of SLSC images are 0.15 to 0.25 mm worse than the lateral point target width in the B-mode image created with the full receive aperture (N = 96). The same measurements were employed in the axial dimension (not shown), and the results indicate that the choice of N or M has minimal effect on axial resolution in B-mode and SLSC images (i.e., measurements did not deviate by more than 25 μm).
The texture of speckle-like regions appears similar in B-mode and SLSC images (e.g., regions of high echo amplitude correlate with regions of high spatial coherence). The autocorrelation of this image texture measured in the lateral dimension as a function of M and N is shown in Fig. 7(b). Lateral texture size decreases with increasing M in SLSC images for values of M ≥ 16. Lateral texture size (i.e., speckle size) in B-mode images decreases with increasing N for values of N ≥ 40. Although lateral texture size is expected to decrease as N increases in B-mode images, it is likely constant at low values of N because the receive beam is wider than the transmit beam in this region, and hence, the width of the transmit beam likely dominates the lateral texture size measurements at these low values of N. More importantly, similar trends are demonstrated with related metrics of aperture size (i.e., M and N).
The lag value, M, has a similar effect on lateral resolution when compared with the number of receive elements, N, used to make B-mode images. Consistent with expectations, Fig. 7(a) demonstrates an improvement in B-mode image lateral resolution with increasing receive aperture size. Similarly, SLSC images demonstrate improved lateral resolution with increasing number of integrated correlations between echoes received by the individual transducer elements. Although M and N are not directly comparable, they are related.
The smallest texture size measurement for B-mode images is 0.45 ± 0.06 when N = 96 (i.e., the full receive aperture), which is similar to the theoretical lateral resolution value of λz/D = 0.54 mm. The largest texture size measurement for SLSC images created from the same data is 0.41 ± 0.06 at M = 16, a statistically significant difference (p < 0.05). Axial texture size (not shown) has insignificant changes as a function of N and M in B-mode and SLSC images (i.e., measurements did not deviate by more than 60 μm).
In B-mode imaging, point target width and texture size are both metrics of resolution, so the similarity between these measurements is expected. However, in SLSC imaging with M < 30, measurements indicate larger point target widths but smaller texture sizes when compared with B-mode images created with the full receive aperture (N = 96). This discrepancy is caused by the target dependency of SLSC image resolution. If these two metrics are interpreted as resolution for SLSC images, they indicate poorer resolution for point targets but better resolution for pure tissue. This observation is true when comparing the two SLSC targets (point target and tissue) to each other and when comparing the SLSC resolution for M < 30 to that of matched B-mode images created with the full receive aperture for each target.
D. Brightness Measurements
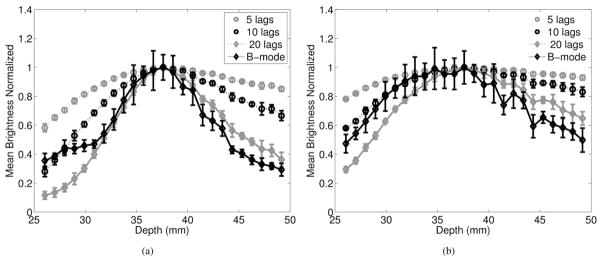
Mean brightness as a function of depth was measured in B-mode and SLSC images of diffuse scatterers created with F/2 and F/3 transmit beams, as shown in Figs. 8(a) and 8(b), respectively. B-mode and SLSC images have maximum brightness at the focus, and image brightness decreases as distance from the focus increases. For SLSC images, this decrease is severely asymmetrical about the focus because of the dependence on transmit beam geometry, as predicted by (1) and confirmed with a theoretical derivation of the transmit beam and corresponding SLSC profiles outside of the focus [26]. Brightness outside of the focal zone increases as M decreases in SLSC images because of the greater coherence in the short-lag region. Although reported trends apply to both F/2 and F/3 transmit beams, note that B-mode and SLSC images created with the F/3 transmit beam are brighter over larger distances (because of the larger transmit depth of field), when compared with images created with the F/2 transmit beam.
Fig. 8.
Brightness as a function of depth for B-mode and SLSC images created with (a) F/2 and (b) F/3 transmit beams.
E. Resolution and Contrast Amid Diffuse Scatterers
An experimental B-mode image of a phantom containing point targets, lesions, and background scatterers is shown in Fig. 9(a). The −6-dB axial and lateral widths of the point target at the focus are 0.12 mm and 0.17 mm, respectively. An SLSC image created with the same channel data, displayed in Fig. 9(b), demonstrates the difficulty with using SLSC images to image point targets in the presence of diffuse scatterers. Attention is directed to results near the 4 cm focus, considering that the dark areas outside of the focal zone may be reduced by increasing the f-number of the transmit beam (Fig. 8) or removed with synthetic aperture focusing [26], [32], [33]. The coherence of the speckle-like background and point targets are similar within the focal zone, resulting in poor resolution and minimal contrast in this region.
Fig. 9.
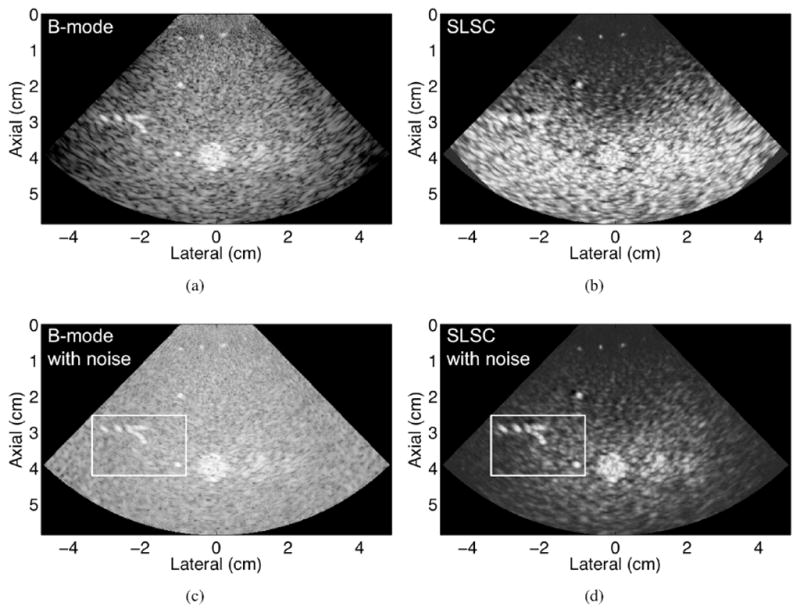
(a) B-mode and (b) SLSC images of an experimental phantom in the absence of added channel noise. (c) B-mode and (d) SLSC images with added channel noise (resulting in 0 dB channel NSR) to simulate clinically relevant clutter. The point targets within the white box are better visualized in the SLSC image with noise, compared with the B-mode image with noise. The transmit focus was 4 cm. All images are shown with 45 dB dynamic range.
The level of noise in phantom images is not truly representative of the amount of noise in clinical images [30]. To further explore SLSC resolution in cluttered environments, noise was added to the experimental channel data, resulting in enhanced point target visibility and resolution in the SLSC image, as demonstrated in the boxed region of Fig. 9(d). The −6-dB axial and lateral widths of the point target at the focus of the SLSC image with noise are 0.15 mm and 0.20 mm, respectively (bottom right of white box). In addition, the point targets at 3 cm depth (top left of white box) are more easily visualized and distinguishable in the SLSC image with noise, compared with the B-mode image with the same amount of channel noise [Fig. 9(c)].
The brightness of the point target at the 4-cm focus and that of the tissue region at the same depth is shown in Fig. 10(a) for various levels of channel NSR. In the SLSC images, the brightness of the tissue region is suppressed as noise increases (i.e., when channel NSR ranges from −20 dB to +6 dB), whereas the brightness of the more coherent point target is relatively constant over this range. A similar trend is observed in simulated tissue data when no other targets are present, as demonstrated in Fig. 10(b) for SLSC images of the diffuse scatterer simulations. Because contrast is a brightness ratio, note that the point target contrast is degraded in B-mode images with channel NSRs ≥ 12 dB, whereas contrast is improved in the SLSC images with increasing channel NSRs ranging from −20 dB to +20 dB. The relatively constant B-mode brightness measurements over the range of −∞ to 0 dB NSR in Fig. 10 indicate that although the dynamic range of Fig. 9(c) can be adjusted to give the tissue region similar brightness to that of Fig. 9(a), the intrinsic contrast of the point targets would not change. These results indicate that improved contrast can be obtained in clinical SLSC images, particularly in high-noise environments (given the decreased coherence of the tissue region relative to more coherent, hyperechoic structures).
Fig. 10.
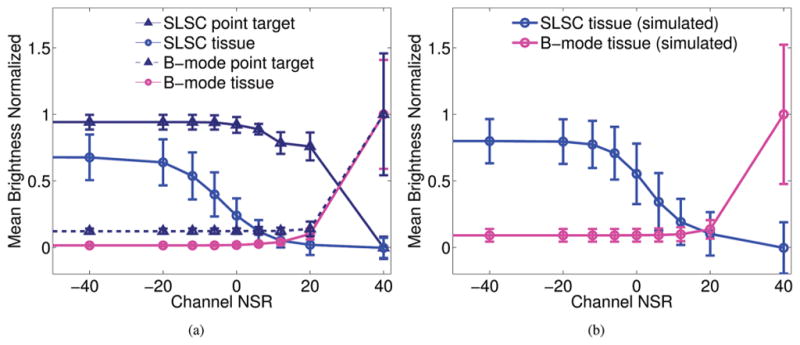
Mean brightness of the (a) experimental and (b) simulated B-mode and SLSC images as a function of channel NSR, after the addition of channel noise. B-mode results were normalized to the mean brightness measured at +40 dB. Each SLSC image was normalized to its brightest value before calculating SLSC brightness. The tissue region in experimental and simulated SLSC images have decreased brightness as a function of increasing channel NSR. In the experimental SLSC images, point target contrast and conspicuity (i.e., measurements of the ratio of the brightness of the point target relative to the tissue background) improve with increasing channel NSR.
These results are most relevant to visualizing microcalcifications and similar point-like structures (e.g., needles) in clinical applications such as breast imaging or biopsy targeting. Although our initial publication on SLSC imaging indicates that point target conspicuity is poor with SLSC imaging [1], the simulation and experimental results herein demonstrate that point-like structures are better visualized in SLSC images in the presence of clutter or acoustic noise. This noise can occur naturally due to poor body habitus, or it can be artificially imposed by adding channel noise to clinical data.
IV. Conclusion
We elucidated characteristic trends of resolution and brightness in SLSC images, noting their dependence on several factors, including target profiles, channel NSR, clutter magnitude, correlation kernel size, short-lag value, M, and/or transmit depth of field. This imaging method is nonlinear and therefore not suitable for deriving modulation transfer functions to determine resolution. Instead, point target measurements revealed that lateral resolution increased with short-lag value, M, whereas axial resolution was most degraded with increasing correlation kernel length. Resolution in both dimensions improved with increasing channel NSR ranging from −40 to +12 dB and increasing clutter magnitude ranging from −37 to −21 dB, which are typical of noise levels in challenging clinical images. Considering that contrast is a brightness ratio, results indicate improved contrast in high-noise environments, ranging from −20 to 20 dB channel NSR, which is consistent with our previous clinical results. Point target widths were larger whereas texture size was smaller in SLSC images created with M ≤ 30, compared with B-mode images created with a full receive aperture. In comparison, the contrast and resolution of matched B-mode images did not significantly vary with respect to these parameters. Results indicate that direct comparisons of SLSC and B-mode resolution and contrast should be considered on a case-by-case basis.
The presented characterization is relevant to future SLSC design considerations, as well as the general research area of nonlinear, coherence-based beamforming. Particularly relevant applications include target identification and comparative texture analyses in ultrasound imaging tasks that suffer from large amplitude clutter noise, including cardiac, liver, fetal, vascular, breast, and interventional (e.g., needle) imaging.
Acknowledgments
This work was supported by the UNCF-Merck Graduate Science Research Dissertation Fellowship, National Institutes of Health (NIH) grants (R01-CA114093-04S, R01-EB013661, and R01-EB017711), and the Duke Endowment Fellowship.
Biographies

Muyinatu A. Lediju Bell (S’08–M’14) was born in Brooklyn, NY. She studied at the Massachusetts Institute of Technology (Cambridge, MA), where she earned her B.S. degree in mechanical engineering with a minor in biomedical engineering in 2006. She was a Whitaker International Fellow at the Institute of Cancer Research and Royal Marsden Hospital, Sutton, Surrey, UK, from 2009 to 2010 and received her Ph.D. degree in biomedical engineering from Duke University, Durham, NC, in 2012. She is currently a postdoctoral fellow at Johns Hopkins University in the Engineering Research Center for Computer-Integrated Surgical Systems and Technology. Her research interests include ultrasound and photoacoustic imaging, coherence-based beamforming, image-guided surgery, robotics, and medical device design.
Jeremy J. Dahl (M’11) was born in Ontonagon, MI, in 1976. He received the B.S. degree in electrical engineering from the University of Cincinnati, Cincinnati, OH, in 1999 and the Ph.D. degree in biomedical engineering from Duke University in 2004. He was an Assistant Research Professor with the Department of Biomedical Engineering at Duke University until 2014. He is currently an Assistant Professor in the Department of Radiology at Stanford University. His current research interests include real-time and alternative beamforming systems, coherence imaging methods, noise in ultrasonic imaging, radiation force imaging methods, and small-scale ultrasound devices.

Gregg E. Trahey (S’83–M’85) received the B.G.S. and M.S. degrees from the University of Michigan, Ann Arbor, MI, in 1975 and 1979, respectively. He received the Ph.D. degree in biomedical engineering in 1985 from Duke University. He served in the Peace Corps from 1975 to 1978 and was a project engineer at the Emergency Care Research Institute in Plymouth Meeting, PA, from 1980 to 1982. He is currently the Robert Plonsey Professor of Biomedical Engineering at Duke University and holds a secondary appointment with the Department of Radiology at the Duke University Medical Center. He is conducting research in radiation force imaging methods, coherence imaging methods, and beamforming and synthetic aperture in medical ultrasound.
Contributor Information
Muyinatu A. Lediju Bell, Email: muyinatu.ledijubell@jhu.edu, Department of Biomedical Engineering, Duke University, Durham, NC 27708, USA. Engineering Research Center for Computer-Integrated Surgical Systems and Technology (CISST ERC), Johns Hopkins University, Baltimore, MD 21218, USA.
Jeremy J. Dahl, Department of Biomedical Engineering, Duke University, Durham, NC 27708, USA. Department of Radiology, Stanford University, Palo Alto, CA 94305, USA.
Gregg E. Trahey, Department of Biomedical Engineering, Duke University, Durham, NC 27708, USA. Department of Radiology, Duke University Medical Center, Durham, NC 27708, USA.
References
- 1.Lediju MA, Trahey GE, Byram BC, Dahl JJ. Short-lag spatial coherence of backscattered echoes: Imaging characteristics. IEEE Trans Ultrason Ferroelectr Freq Control. 2011;58(7):1377–1388. doi: 10.1109/TUFFC.2011.1957. [DOI] [PMC free article] [PubMed] [Google Scholar]
- 2.Lediju Bell MA, Goswami R, Kisslo JA, Dahl JJ, Trahey GE. Short-lag spatial coherence imaging of cardiac ultrasound data: Initial clinical results. Ultrasound Med Biol. 2013;39(10):1861–1874. doi: 10.1016/j.ultrasmedbio.2013.03.029. [DOI] [PMC free article] [PubMed] [Google Scholar]
- 3.Jakovljevic M, Trahey GE, Nelson RC, Dahl JJ. In vivo application of short-lag spatial coherence imaging in human liver. Ultrasound Med Biol. 2013;39(3):534–542. doi: 10.1016/j.ultrasmedbio.2012.09.022. [DOI] [PMC free article] [PubMed] [Google Scholar]
- 4.Kakkad V, Dahl J, Ellestad S, Trahey G. In vivo performance evaluation of short-lag spatial coherence and harmonic spatial coherence imaging in fetal ultrasound. IEEE Int Ultrasonics Symp. 2013:600–603. [Google Scholar]
- 5.Dahl J, Hyun D, Lediju M, Trahey G. Lesion detectability in diagnostic ultrasound with short-lag spatial coherence imaging. Ultrason Imaging. 2011;33(2):119–133. doi: 10.1177/016173461103300203. [DOI] [PMC free article] [PubMed] [Google Scholar]
- 6.Lediju Bell MA, Goswami R, Dahl JJ, Trahey GE. Improved visualization of endocardial borders with short-lag spatial coherence imaging of fundamental and harmonic ultrasound data. IEEE Int Ultrasonics Symp. 2012:2129–2132. [Google Scholar]
- 7.Lediju Bell MA, Goswami R, Trahey GE. Clutter reduction in echocardiography with short-lag spatial coherence (SLSC) imaging. 9th IEEE Int Symp Biomedical Imaging. 2012:1116–1119. [Google Scholar]
- 8.Dahl JJ, Bottenus N, Lediju Bell MA, Cook MJ. Coherent flow imaging: A power Doppler imaging technique based on backscatter spatial coherence. IEEE Int Ultrasonics Symp. 2013:639–642. [Google Scholar]
- 9.Kakkad V, Dahl J, Ellestad S, Trahey G. In vivo application of short-lag spatial coherence and harmonic spatial coherence imaging in fetal ultrasound. Ultrason Imaging. 2014;37(2):101–116. doi: 10.1177/0161734614547281. [DOI] [PMC free article] [PubMed] [Google Scholar]
- 10.Dahl JJ, Jakovljevic M, Pinton GF, Trahey GE. Harmonic spatial coherence imaging: An ultrasonic imaging method based on backscatter coherence. IEEE Trans Ultrason Ferroelectr Freq Control. 2012;59(4):648–659. doi: 10.1109/TUFFC.2012.2243. [DOI] [PMC free article] [PubMed] [Google Scholar]
- 11.Lencioni R, Cioni D, Bartolozzi C. Tissue harmonic and contrast-specific imaging: Back to gray scale in ultrasound. Eur Radiol. 2002;12(1):151–165. doi: 10.1007/s003300101022. [DOI] [PubMed] [Google Scholar]
- 12.Desser TS, Jeffrey RB. Seminars in Ultrasound, CT and MRI. 1. Vol. 22. Elsevier; 2001. Tissue harmonic imaging techniques: Physical principles and clinical applications; pp. 1–10. [DOI] [PubMed] [Google Scholar]
- 13.Prince J, Links J. Medical Imaging Signals and Systems. 1. Upper Saddle River, NJ, USA: Prentice Hall; 2005. [Google Scholar]
- 14.Rossmann K. Point spread-function, line spread-function, and modulation transfer function. Radiology. 1969;93(2):257–272. doi: 10.1148/93.2.257. [DOI] [PubMed] [Google Scholar]
- 15.Gore J, Leeman S. Transfer functions for describing ultrasound system performance. Phys Med Biol. 1979;24(1):146–156. doi: 10.1088/0031-9155/24/1/012. [DOI] [PubMed] [Google Scholar]
- 16.Steinberg B. Principles of Aperture and Array System Design: Including Random and Adaptive Arrays. Vol. 1. New York, NY, USA: Wiley-Interscience; 1976. [Google Scholar]
- 17.Burckhardt C. Speckle in ultrasound b-mode scans. IEEE Trans Sonics Ultrason. 1978;25(1):1–6. [Google Scholar]
- 18.Wagner R, Smith S, Sandrik J, Lopez H. Statistics of speckle in ultrasound b-scans. IEEE Trans Sonics Ultrason. 1983;30(3):156–163. [Google Scholar]
- 19.Lediju Bell MA, Dahl JJ, Trahey GE. Comparative resolution and tracking performance in b-mode and short-lag spatial coherence (SLSC) images. IEEE Int Ultrasonics Symp. 2011:1985–1988. [Google Scholar]
- 20.Mann J, Walker W. A constrained adaptive beamformer for medical ultrasound: Initial results. Proc IEEE Ultrasonics Symp. 2002;2:1807–1810. [Google Scholar]
- 21.Viola F, Walker W. Adaptive signal processing in medical ultrasound beamforming. IEEE Ultrasonics Symp. 2005;4:1980–1983. [Google Scholar]
- 22.Vignon F, Burcher M. Capon beamforming in medical ultrasound imaging with focused beams. IEEE Trans Ultrason Ferroelectr Freq Control. 2008;55(3):619–628. doi: 10.1109/TUFFC.2008.686. [DOI] [PubMed] [Google Scholar]
- 23.Mehdizadeh S, Austeng A, Johansen TF, Holm S. Eigenspace based minimum variance beamforming applied to ultrasound imaging of acoustically hard tissues. IEEE Trans Medical Imaging. 2012;31(10):1912–1921. doi: 10.1109/TMI.2012.2208469. [DOI] [PubMed] [Google Scholar]
- 24.Goodman JW. Statistical Optics. New York, NY, USA: Wiley-Interscience; 2000. [Google Scholar]
- 25.Mallart R, Fink M. The van Cittert–Zernike theorem in pulse echo measurements. J Acoust Soc Am. 1991;90(5):2718–2727. [Google Scholar]
- 26.Bottenus N, Byram BC, Dahl JJ, Trahey GE. Synthetic aperture focusing for short-lag spatial coherence imaging. IEEE Trans Ultrason Ferroelectr Freq Control. 2013;60(9):1816–1826. doi: 10.1109/TUFFC.2013.2768. [DOI] [PMC free article] [PubMed] [Google Scholar]
- 27.Jensen JA. Field: A program for simulating ultrasound systems. Med Biol Eng Comput. 1996;34(suppl 1, pt 1):351–353. [Google Scholar]
- 28.Fedewa RJ, Wallace KD, Holland MR, Jago JR, Ng GC, Rielly MR, Robinson BS, Miller JG. Spatial coherence of the nonlinearly generated second harmonic portion of backscatter for a clinical imaging system. IEEE Trans Ultrason Ferroelectr Freq Control. 2003;50(8):1010–1022. doi: 10.1109/tuffc.2003.1226545. [DOI] [PubMed] [Google Scholar]
- 29.Dahl JJ, Soo MS, Trahey GE. Spatial and temporal aberrator stability for real-time adaptive imaging. IEEE Trans Ultrason Ferroelectr Freq Control. 2005;52(9):1504–1517. doi: 10.1109/tuffc.2005.1516023. [DOI] [PubMed] [Google Scholar]
- 30.Lediju MA, Pihl MJ, Dahl JJ, Trahey GE. Quantitative assessment of the magnitude, impact, and spatial extent of ultrasonic clutter. Ultrason Imaging. 2008;30(3):151–168. doi: 10.1177/016173460803000302. [DOI] [PMC free article] [PubMed] [Google Scholar]
- 31.Walker WF, Trahey GE. A fundamental limit on delay estimation using partially correlated speckle signals. IEEE Trans Ultrason Ferroelectr Freq Control. 1995;42(2):301–308. [Google Scholar]
- 32.Bottenus N, Hyun D, Dahl J, Trahey G, Byram B. Application of synthetic aperture focusing to short-lag spatial coherence. IEEE Int Ultrasonics Symp. 2012:2262–2265. doi: 10.1109/TUFFC.2013.2768. [DOI] [PMC free article] [PubMed] [Google Scholar]
- 33.Bae M, Park S-B, Jung H-W, Jeong M-K, Kwon S-J. Short-lag spatial coherence combined with synthetic aperture imaging. IEEE Int Ultrasonics Symp. 2013:797–800. [Google Scholar]


