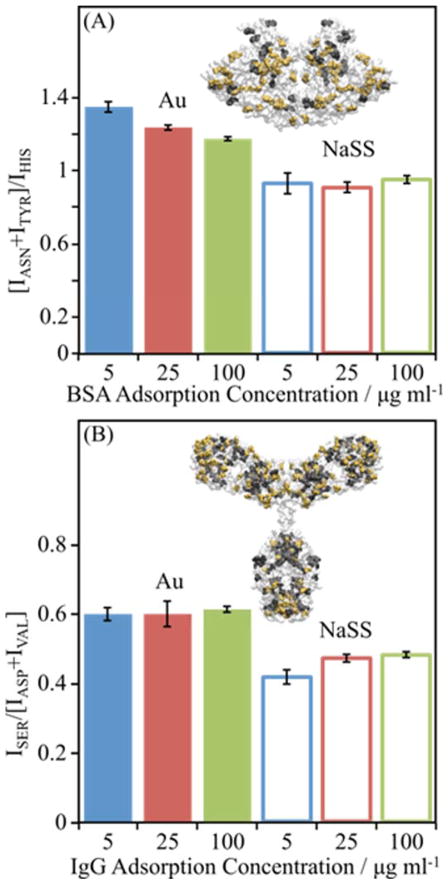
Figure 5.
ToF-SIMS peak intensity ratios reveal changes in adsorbed protein structure for (A) BSA and (B) IgG adsorbed onto gold and NaSS surfaces. Insets show the crystal structure of each protein. In (A) Asn and Tyr are highlighted in yellow while His is highlighted in black. In (B) Ser is highlighted in yellow while Asp and Val are highlighted in black. Plotted data represent average amino acid ratios for proteins absorbed from 5 (blue), 25 (red), and 100 (green) μg/ml solutions onto Au (solid bars) or NaSS (open bars) surfaces. The peak ratios are the sum of intensities of secondary ions from amino acids with asymmetric distributions, highlighted in yellow and black in the inset protein. Error bars represent standard deviations.

