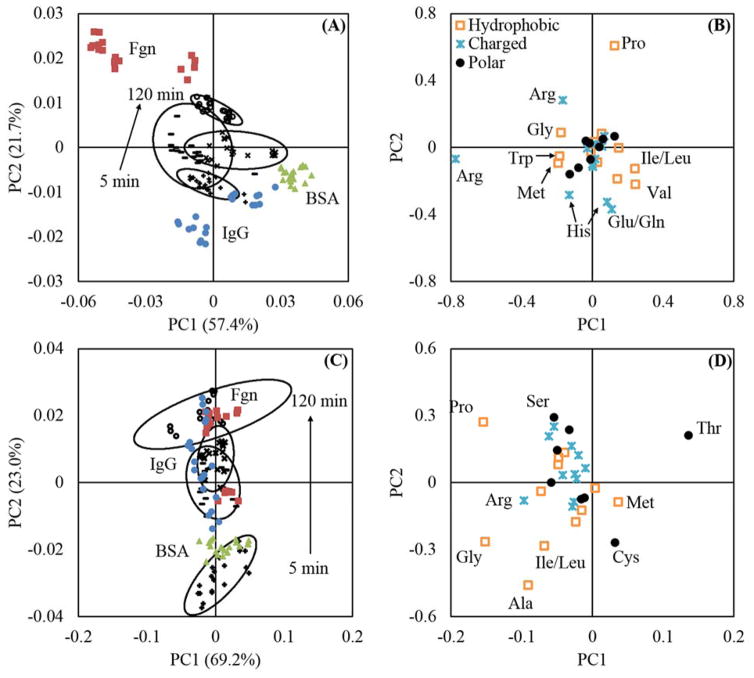
Figure 6.
PC models for gold (A and B) and NaSS (C and D) surfaces. The models were constructed using the amino acids peaks from 100 μg/ml plasma adsorption ToF-SIMS data. Single-component BSA (
 ), Fgn (
 ), and IgG (
 ) spectra were projected into the models. In panels (A) and (C) all black symbols represent the plasma adsorption data used to construct the model: + represent the 5 minute adsorption group, − represent the 30 minute adsorption group, × represent the 60 minute adsorption group, and + represent the 120 minute adsorption group. The ellipses in (A) and (C) represent 95% confidence intervals. Panel (A) shows that on gold: the plasma films are more like adsorbed IgG and BSA at short to intermediate times, and more like Fgn at long times. Panel (C) shows that on NaSS: the plasma films are more like BSA at short times, then more like IgG and Fgn at long times.

