

Abstract
Objectives
To examine whether an accurate measure (using a gold-standard method) of total body fat (BF) would be a better predictor of cardiovascular disease (CVD) mortality than body mass index (BMI).
Participants and Methods
A total of 60,335 participants were examined between January 1, 1979, and December 31, 2003, and then followed-up for mean of 15.2 years. BMI was estimated by standard procedures. Indices of body composition [i.e. BF%, fat mass index (FMI), fat-free mass (FFM) and FFM index (FFMI)] were derived from either skinfold thicknesses or hydrostatic weighing. For exact comparisons, the indices studied were categorized identically using sex-specific percentiles.
Results
Compared with a medium BMI, a very high BMI was associated with hazard ratios (HR) of 2.7 (confidence interval, CI:2.1-3.3) for CVD mortality, a stronger association than for BF% or FMI; i.e. HR=1.6(CI:1.3-1.9) and 2.2(CI:1.8-2.7), respectively. Compared with a medium FFMI, a very high FFMI was associated with a HR of 2.2 (CI:1.7-2.7) for CVD mortality, with these estimates being markedly smaller for FFM, i.e. HR=1.2(CI:0.9-1.6). When the analyses were restricted only to the sample with hydrostatic assessments (N=29,959), the results were nearly identical, with even slightly larger differences in favor of BMI, i.e. HR=3.0 (CI:2.2-4.0) compared with BF% and FMI, i.e. HR=1.5(CI:1.2-1.9) and 2.1(CI:1.6-2.7) respectively. We estimated Harrell c-index as an indicator of discriminant/predictive ability for these models and observed that the c-index in models including BMI was significantly higher than that in models including BF% or FMI (all P values <.005).
Conclusions
The simple and inexpensive measure of BMI can be as clinically important or even more than total adiposity measures assessed by accurate and expensive methods. Physiological explanations for these findings are discussed.
INTRODUCTION
Obesity is a major public health concern in most of countries around the world. There is a vast amount of data supporting an increased risk of cardiovascular disease (CVD) mortality and reduced survival associated with overweight and obesity. Although this notion is generally well-accepted in public health and clinical settings, literature on this topic is extremely controversial. In fact, a number of studies have recently reported that in certain conditions, especially in individuals with existing CVD, obesity might be related with a lower risk of mortality, the so-called “obesity-mortality paradox”1. In addition, the systematic review and meta-analysis conducted by Flegal and colleagues concluded that overweight is associated with a reduced risk of mortality compared with normal-weight, whereas mild or Class I obesity was associated with a trend for better survival 2. Recently, Ahima and Lazar discussed this phenomenon and concluded that the impact of a high body mass index (BMI) on mortality is in question and that better metrics are needed 3. Before investigating which are the best indexes to measure obesity in relation to future health, the fundamental question of what obesity really means deserves discussion. While many scientists and other readers would assert that obesity means an excess of adiposity, measured by body fat percentage (BF%), others would suggest that most of what we currently know about the adverse effects of obesity on health is actually based on BMI-defined obesity. Therefore, obesity could as well mean an excess of body weight, which is what BMI directly measures.
Although it is internationally and well-accepted that the definition of obesity is based on BMI (i.e. 30 kg/m2 or higher), this traditional anthropometric index is strongly criticized for its lack of ability to distinguish between fat and lean tissues. There is no doubt that BMI includes an estimation error when assessing total adiposity. Based on this and on the assumption that it is the excess of adiposity that predicts mortality, it would be expected that more accurate measures of total adiposity, such as BF% or fat mass index [FMI, fat mass (kg) divided by squared height (m2)] would be stronger predictors of death than BMI. We reviewed the literature on this topic and searched whether there was any study conducting a direct comparison of BMI and BF% as predictors of CVD mortality or all-cause mortality. We found that most longitudinal studies examining mortality outcomes have used BMI as an exposure, for a simple reason, weight and height are easy and inexpensive to measure. In addition, in order to conduct exact comparisons, both variables should be handled statistically in an identical way (e.g. sex-specific centiles); using standard cut-points (e.g. BMI ≥30kg/m2 and BF% ≥25 for men or ≥ 35 % for women for obesity) would lead to a different distribution of participants into the BMI and BF% groups, which would hamper accurate and direct comparisons. In this context, the Aerobics Center Longitudinal Study (ACLS) includes an accurate measure of total BF (i.e. using a gold-standard method in roughly 30,000 men and women) as well as BMI in the baseline examination 4-6, providing a unique opportunity to address this research question. The present study, therefore, aimed to examine whether an accurate measure of total BF would be a better predictor of CVD mortality and all-cause mortality than BMI. In addition, we tested which of the following conditions more strongly predict CVD mortality and all-cause mortality: an excess of body weight, an excess of BF or an excess of fat-free mass (FFM).
METHODS
Study Cohort
The ACLS is a prospective epidemiologic investigation of adult men and women 5,7,8; participants are mostly Caucasian (98%), well-educated, and worked in executive or professional positions 9. All participants completed a detailed questionnaire and underwent an extensive clinical evaluation, including a physical examination, fasting blood chemistry analyses, personal and family health history, body composition, smoking and alcohol use, and a maximal exercise treadmill test between January 1, 1979 and December 31, 2003. All participants provided written informed consent, and the study protocol was approved annually by the Institutional Review Board of the Cooper Institute. Exclusion criteria for the present analyses were: 1) existing CVD or cancer at baseline (n=1,021); 2) < 1 year of follow-up (n=1,064); 3) incomplete data on BMI, BF% and all the confounders (n=1,272). The rationale why participants with less than 1 year of follow-up were excluded is based on the fact that persons dying during the first year are likely to have a preexisting occult disease that confounds the relation between the risk factor under study and mortality. Excluding persons dying during the first years of follow-up purportedly reduces this confounding effect, and is a widely used technique especially in the field of obesity 10. Based on these criteria, a total of 3,357 participants (5.3%) aged 20 years or older at baseline were excluded. The final sample included 60,335 participants (26.7% women) for the analyses.
Baseline Examination
As described previously 7, height and weight were measured using a stadiometer and a standard scale. Waist circumference was obtained at the level of the umbilicus with a plastic anthropometric tape. BMI was calculated as weight in kilograms divided by height in meters squared (kg/m2); BF% was assessed by hydrostatic weighing or the sum of 7 skinfold measures, following standardized protocols 4,11. Some participants had an underwater weighing assessment for hydrostatically estimated body density with a mathematical conversion to BF%, whereas other participants were assessed using standard skinfold thicknesses from which BF% was estimated. Standardized protocols used and specific procedures for the ACLS assessment of BF% were published elsewhere 4,5,12,13. A large number of the participants (N=21,681) had both measurements, and the correlation between hydrostatically estimated BF% and skinfold estimated BF% was >0.90 12,13. When available, hydrostatically estimated BF% was always used in the analysis, i.e. hydrostatic weighing was available on 52% of the sample. In the present study, the analyses were conducted for the whole sample (including participants assessed with both methods) and also for the sub-sample with hydrostatic weighing. For the purpose of this study and in order to conduct as exact as possible comparisons with BMI, we additionally computed FMI (kg/m2), as fat mass expressed in kilograms divided by the square of height expressed in meters. For exploratory analyses, we also computed FFM expressed in kg by subtracting fat mass (kg) from total body weight (kg). Likewise, for exact comparisons with BMI, FFM index (FFMI, kg/m2) was computed as FFM expressed in kilograms divided by the square of height expressed in meters. FMI and FFMI body composition indexes are widely used in the literature 14-16 and of special interest for this study, since they mirror the way BMI is computed and expressed, i.e. dividing weight, fat mass or FFM by squared height expressed in meters. Comparing the findings obtained for BMI, FMI and FFMI will allow testing of the following to determine what more strongly predicts CVD mortality and all-cause mortality: an excess of body weight, an excess of BF or an excess of FFM, which is the secondary aim of this study.
Information on risk factors such as smoking (current smoker or not current smoker), excessive drinking (defined as alcohol drinks >14 per week for men and >7 per week for women), physical inactivity (defined as no leisure-time physical activity during past three months) and having a parental history of CVD or cancer was obtained from a standardized medical history questionnaire. As described previously7,17, cardiorespiratory fitness (CRF) was defined as the total time of a symptom-limited maximal treadmill exercise test, using a modified Balke protocol. Total time of the test on this protocol correlates highly with measured maximal oxygen uptake (VO2max) in both men (r = 0.92)18 and women (r = 0.94)19. The test endpoint was volitional exhaustion or when the physician stopped it for medical reasons. VO2max was calculated from the final treadmill speed and grade20.
As described previously6,21, systolic and diastolic blood pressures were obtained with a mercury sphygmomanometer and auscultory methods following the American Heart Association protocol22. A fasting blood sample was obtained by venipuncture and serum total cholesterol was assayed with automated techniques at the Cooper Clinic Laboratory, which participates in and meets the quality control standards of the U.S. Centers for Disease Control and Prevention Lipid Standardization Program.
Assessment of outcomes
The main outcome of this study is CVD mortality, yet results about all-cause mortality were also reported as Online-Only Supplemental Material in order to provide a broader picture about the association between body composition markers and mortality. The participants were followed from the baseline examination until the date of death or 31 December 2003. Mortality surveillance was based on the National Death Index (NDI). Participants not found to be deceased as of December 31, 2003 via the National Death Index were assumed to be alive. The underlying cause of death was determined from the NDI report or by a nosologist’s review of official death certificates allobtained from the department of vital records in the decedent’s state of residence. Cardiovascular disease mortality was defined by International Classification of Diseases, Ninth Revision (ICD-9) codes 390 to 448.9 before 1999 and Tenth Revision (ICD-10) codes I00 to I78 during 1999-200323.
Statistical analysis
All statistical analyses were performed using IBM-SPSS, version 20.0 SPSS Inc., Chicago, IL, USA. The level of significance was set at <0.05 for all the analyses. The characteristics of the study sample are presented as means and standard deviations or as frequencies and percentages, as appropriate. In order to address the main study aim, we used Cox proportional hazards regression (two-sided tests) to estimate hazard ratios (HRs) and 95% confidence intervals (CIs) according to exposure categories. The main study outcome was CVD mortality, yet results for all-cause mortality are also provided in Supplemental Figure 1. The exposures/predictors studied were BMI, BF%, FMI, FFM and FFMI. They all were categorized using exactly the same procedures in order to allow exact comparisons among exposures. These variables were categorized based on sex-specific centiles as follows: Very low if < percentile 5th, Low if percentile 5th-15th, Middle if percentile 15th-85th, High if percentile 85th-95th and Very high if above percentile 95th. Percentiles 85th and 95th have been traditionally used to represent overweight and obesity respectively, so we used the same criteria for all the indices studied and mirrored the bottom extreme using percentiles 5th and 15th. The possibility of an interaction with sex was tested by entering interaction terms (e.g. sex×BMI) in all the models. Since no evidence of interaction with sex was observed for any of the models performed (all P>.2), all the analyses were conducted for the whole sample together. All the analyses were adjusted for age, sex, examination year, smoking, alcohol consumption, physical inactivity and parental history of CVD (and parental history of cancer, when all-cause mortality was the outcome studied). In order to test the discriminating ability of the predictive models used, we estimated the c-index as proposed by Harrell et al.24,25 for each of the models including BMI, BF% and FMI and compared whether these c-indices were significantly different from each other using the “compareC” package in the R statistical software, following the method recently suggested by Kang and colleagues 26.
A number of sensitive/exploratory analyses were conducted, in order to test whether the results from the main analyses were altered in specific conditions/sub-groups of individuals: 1) in the subsample with hydrostatic weighing assessment; and 2) in a subsample of individuals with high WC. We also tested how additional adjustment for CRF, hypertension or hypercholesterolemia influenced the results.
RESULTS
Table 1 shows the descriptive characteristics of the study sample at baseline (N=60,355): 13% of the participants were obese and 18% of them centrally obese; 16% of the participants were smokers and 8% of them drank excessive alcohol. One third of them were inactive and one fourth had parental history of CVD disease. One fifth of the participants had hypertension or hypercholesterolemia. Over a mean follow-up period of 15.2 years, a total of 3,780 (6.3%) participants died, 1,359 due to CVD (2.3% of the total sample and 36% of the total number of deaths).
Table 1.
Characteristics of the study population.
| All (N=60,335) | Men (44,234) | Women (16,101) | ||||
|---|---|---|---|---|---|---|
|
| ||||||
| Baseline data | Mean | SD | Mean | SD | Mean | SD |
|
|
||||||
| Age (years) | 43.6 | 10.7 | 43.8 | 10.3 | 43.1 | 11.9 |
| Height (cm) | 175.0 | 9.2 | 178.9 | 6.7 | 164.4 | 6.3 |
| Weight (kg) | 79.3 | 16.8 | 85.2 | 14.0 | 63.0 | 12.4 |
| Body mass index (BMI, kg/m2) | 25.7 | 4.3 | 26.6 | 3.9 | 23.3 | 4.4 |
| Waist circumference (cm)* | 89.2 | 14.2 | 94.1 | 11.2 | 73.9 | 11.1 |
| Body fat percentage | 22.7 | 7.3 | 21.4 | 6.7 | 26.3 | 7.5 |
| Fat mass (kg) | 18.4 | 8.3 | 18.8 | 8.4 | 17.2 | 7.8 |
| Fat mass index (kg/m2) | 6.0 | 2.7 | 5.9 | 2.6 | 6.4 | 2.9 |
| Fat-free mass (kg) | 60.9 | 12.1 | 66.3 | 8.4 | 45.8 | 6.5 |
| Fat-free mass index (kg/m2) | 19.7 | 2.7 | 20.7 | 2.1 | 16.9 | 2.1 |
| Cardiorespiratory fitness (VO2max, ml/kg/min)* | 38.6 | 9.1 | 40.4 | 8.8 | 33.2 | 7.8 |
| n | % | n | % | n | % | |
|
|
||||||
| Obesity (BMI>30kg/m2) | 8,091 | 13.4 | 6,862 | 15.5 | 1,229 | 7.6 |
| Central obesity (WC>102cm in men, | 7,887 | 17.6 | 6,721 | 19.9 | 1,166 | 10.7 |
| <88cm in women)* | ||||||
| Current smoker, n (%) | 9,517 | 15.8 | 8,034 | 18.2 | 1,483 | 9.2 |
| Excessive alcohol drinking, n (%)† | 4,628 | 7.7 | 3,242 | 7.3 | 1,386 | 8.6 |
| Inactivity, n (%)† | 20,289 | 33.6 | 14,784 | 33.4 | 5,505 | 34.2 |
| Hypertension, n (%) | 16,952 | 28.1 | 14,118 | 31.9 | 2,834 | 17.6 |
| Hypercholesterolemia, n (%) | 15,688 | 26.0 | 12,353 | 27.9 | 3,335 | 20.7 |
| Parental history of CVD, n (%) | 15,316 | 25.4 | 11,444 | 25.9 | 3,872 | 24.0 |
| Parental history of cancer, n (%) | 1,874 | 3.1 | 1,228 | 2.8 | 646 | 4.0 |
| Follow-up data | Mean | SD | Mean | SD | Mean | SD |
|
|
||||||
| Follow-up period (years) | 15.2 | 8.5 | 15.8 | 8.5 | 13.6 | 8.2 |
| n | % | n | % | n | % | |
|
|
||||||
| Number of deaths, n (%) | 3,780 | 6.3 | 3,218 | 7.3 | 562 | 3.5 |
| Number of CVD deaths, n (%) | 1,359 | 2.3 | 1,208 | 2.7 | 151 | 0.9 |
Data are means (standard deviations), unless otherwise indicated. CVD indicates Cardiovascular disease.
All variables have complete data (i.e. N=60,335), except for WC which was available in 44,724 participants and cardiorespiratory fitness that was available in 56,815 participants.
Excessive drinking was defined as alcohol drinks >14 per week for men and >7 per week for women; physical inactivity was defined as no leisure-time physical activity during past three months.
Compared with a medium BMI, a very high BMI was associated with 2.7-fold higher risk (CI:2.1-3.3) of CVD mortality (Figure 1). The corresponding HRs for CVD mortality for BF% and FMI were lower than for BMI, and were lower for BF% than for FMI, i.e. 1.6 (CI:1.3-1.9) and 2.2 (CI:1.8-2.7) respectively. When the analyses were restricted only to the sample with hydrostatic assessments (N=29,595), the results were very similar (Figure 1) with even slightly larger differences in favor of BMI, i.e. HR=3.0 (CI:2.2-4.0) compared with BF% and FMI, i.e. HR=1.5(CI:1.2-1.9) and 2.1(CI:1.6-2.7) respectively. The diagnostic ability (c-index) of the multivariate model including BMI to predict CVD mortality was 0.844 in the whole sample, whereas the same multivariate model but with BF% was 0.839 (P<0.001 for c-index difference compared with the BMI model) and with FMI was 0.841 (P=0.004 for c-index difference compared with the BMI model). The corresponding c-indices for models including BMI, BF% and FMI in the subsample with hydrostatic weighing assessment were 0.828, 0.820 and 0.823 respectively; with c-indices of BF% and FMI being significantly different from those of BMI (P<0.001 and P=0.005 respectively).
Figure 1. Hazard ratios for mortality due to cardiovascular disease (CVD) according to body mass index (BMI), percent body fat (BF%) and fat mass index (FMI) groups in the whole study sample (N=57,910) and in the sub-sample with hydrostatic weighing assessment (N=29,959).
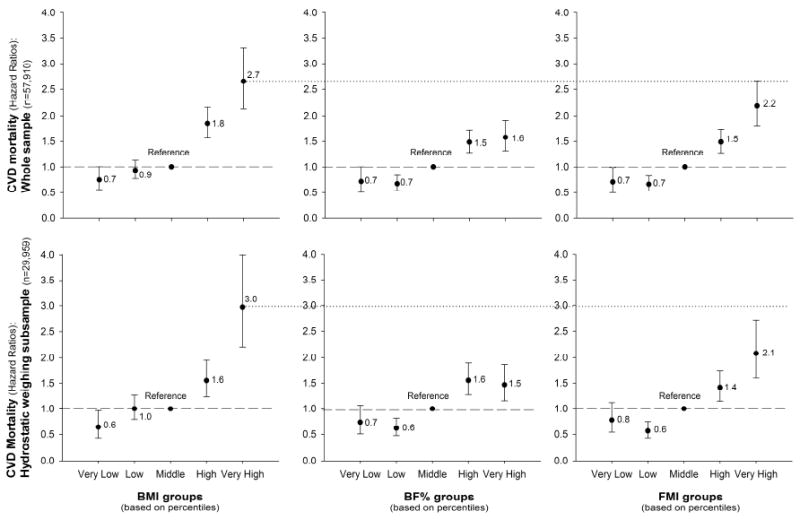
Body weight/body fat groups were estimated based on sex-specific centiles: Very low if < percentile 5th, Low if percentile 5th-15th, Middle if percentile 15th-85th, High if percentile 85th-95th and Very high if above percentile 95th.
All the models were adjusted for age, sex, examination year, smoking, alcohol consumption, inactivity and parental history of CVD.
Compared with a medium FFMI, a very high FFMI was associated with 2.2 (CI:1.7-2.7) higher risk of CVD mortality, with these estimates being markedly smaller for FFM, i.e. 1.2(CI:0.9-1.6); Figure 2. Similar results were obtained when the analyses were conducted on the sub-sample with hydrostatic assessments (Figure 2).
Figure 2. Hazard ratios for mortality due to cardiovascular disease (CVD), according to fat-free mass (FFM) and to fat-free mass index (FFMI) groups in the whole study sample (N=57,910) and in the sub-sample with hydrostatic weighing assessment (N=29,959).
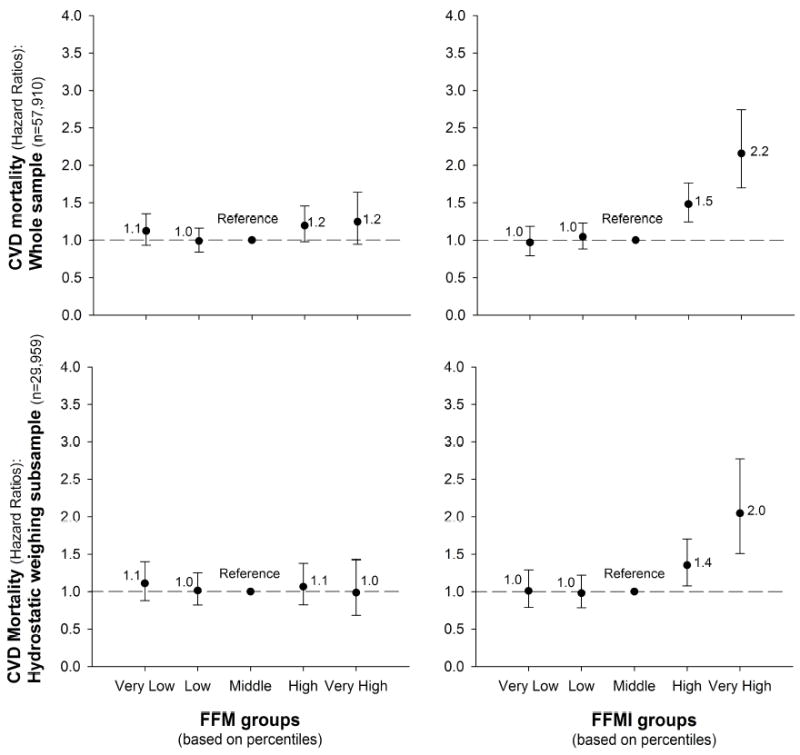
FFM and FFMI groups were estimated based on sex-specific centiles: Very low if < percentile 5th, Low if percentile 5th-15th, Middle if percentile 15th-85th, High if percentile 85th-95th and Very high if above percentile 95th.
All the models were adjusted for age, sex, examination year, smoking, alcohol consumption, inactivity and parental history of CVD.
Table 2 shows the sex-specific (percentile-based) levels of weight, fat or FFM corresponding to the study groups used in this study. A very high (percentile 95th) BMI was considered if a BMI equal or higher than 34kg/m2 for men and 32kg/m2 for women. A very high BF% was considered if a BF% equal or higher than 33% for men and 39% for women. A very high FMI was considered if a FMI equal or higher than 11 for men and 12 for women; and a very high FFMI was considered if a FFMI equal or higher than 25 for men and 21 for women. As shown in Figures 1 and 2, these cut-point values were associated with a higher risk of CVD mortality.
Table 2.
Descriptive information about the study groups.
| Study groups | Statistics | BMI
|
BF%
|
FMI
|
FFM
|
FFMI
|
||||||
|---|---|---|---|---|---|---|---|---|---|---|---|---|
| Men | Women | Men | Women | Men | Women | Men | Women | Men | Women | |||
| Very low (<Percentile 5th) | Minimum | 13.8 | 14.3 | 2.0 | 2.3 | 0.4 | 0.4 | 58.3 | 39.8 | 18.7 | 15.1 | |
| Maximum | 21.5 | 18.4 | 10.1 | 14.6 | 2.3 | 2.8 | 74.6 | 51.5 | 22.7 | 18.7 | ||
| Percentiles | 25 | 20.0 | 17.4 | 6.2 | 10.6 | 1.4 | 2.0 | 62.4 | 42.7 | 19.7 | 15.9 | |
| 50 | 20.7 | 17.9 | 8.0 | 12.6 | 1.8 | 2.4 | 65.8 | 45.0 | 20.5 | 16.6 | ||
| 75 | 21.2 | 18.2 | 9.2 | 13.8 | 2.1 | 2.6 | 69.4 | 47.6 | 21.4 | 17.4 | ||
| Low (Percentile 5th-15th) | Minimum | 21.5 | 18.4 | 10.2 | 14.7 | 2.3 | 2.8 | 23.2 | 20.3 | 7.7 | 7.5 | |
| Maximum | 23.1 | 19.6 | 14.5 | 18.4 | 3.4 | 3.7 | 54.0 | 37.1 | 17.6 | 14.3 | ||
| Percentiles | 25 | 22.1 | 18.8 | 11.6 | 15.8 | 2.7 | 3.1 | 48.8 | 34.3 | 16.4 | 13.4 | |
| 50 | 22.5 | 19.1 | 12.7 | 16.8 | 3.0 | 3.3 | 51.5 | 35.6 | 17.0 | 13.9 | ||
| 75 | 22.8 | 19.4 | 13.7 | 17.7 | 3.2 | 3.5 | 52.9 | 36.5 | 17.4 | 14.1 | ||
| Middle (Percentile 15th-85th) | Minimum | 23.1 | 19.6 | 14.6 | 18.5 | 3.4 | 3.7 | 54.0 | 37.1 | 17.6 | 14.3 | |
| Maximum | 30.1 | 27.1 | 28.1 | 34.4 | 8.3 | 9.1 | 58.3 | 39.8 | 18.7 | 15.1 | ||
| Percentiles | 25 | 24.6 | 20.9 | 18.5 | 22.7 | 4.6 | 4.8 | 55.5 | 38.0 | 18.0 | 14.6 | |
| 50 | 26.0 | 22.3 | 21.5 | 26.2 | 5.6 | 5.8 | 56.6 | 38.7 | 18.3 | 14.8 | ||
| 75 | 27.6 | 24.0 | 24.4 | 29.8 | 6.6 | 7.1 | 57.5 | 39.3 | 18.5 | 15.0 | ||
| High (Percentile 85th-95th) | Minimum | 30.1 | 27.1 | 28.2 | 34.5 | 8.3 | 9.1 | 74.6 | 51.5 | 22.7 | 18.7 | |
| Maximum | 33.5 | 31.9 | 32.4 | 38.3 | 10.4 | 12.0 | 80.8 | 57.1 | 24.3 | 20.6 | ||
| Percentiles | 25 | 30.7 | 27.9 | 28.9 | 35.3 | 8.6 | 9.6 | 75.6 | 52.5 | 23.0 | 19.0 | |
| 50 | 31.4 | 28.8 | 29.8 | 36.2 | 9.1 | 10.2 | 77.0 | 53.5 | 23.3 | 19.4 | ||
| 75 | 32.2 | 30.1 | 31.0 | 37.2 | 9.7 | 10.9 | 78.6 | 55.0 | 23.7 | 19.9 | ||
| Very high (>Percentile 95th) | Minimum | 33.5 | 31.9 | 32.5 | 38.4 | 10.4 | 12.0 | 80.8 | 57.1 | 24.3 | 20.6 | |
| Maximum | 64.6 | 63.6 | 62.7 | 65.9 | 35.3 | 28.8 | 133.9 | 109.1 | 40.5 | 46.1 | ||
| Percentiles | 25 | 34.4 | 33.1 | 33.4 | 39.1 | 11.0 | 12.7 | 82.3 | 58.9 | 24.7 | 21.1 | |
| 50 | 35.8 | 34.8 | 34.8 | 40.0 | 12.0 | 13.6 | 84.4 | 61.0 | 25.3 | 21.9 | ||
| 75 | 38.4 | 38.0 | 37.1 | 42.3 | 13.5 | 15.0 | 88.3 | 65.4 | 26.3 | 23.5 | ||
BMI indicates body mass index; BF%, percent body fat; FMI, fat mass index; FFM, fat-free mass; and FFMI, fat-free mass index.
HRs and CIs for all-cause mortality are shown in Supplemental Figure 1as Online-Only Supplemental Material. Overall, the differences in HRs for BMI compared with BF% or FMI were smaller for all-cause mortality than for CVD mortality.
Sensitivity/exploratory analyses
We run the same models as in Figure 1 in a sub-sample of individuals with a high WC (i.e. n=7,887) in order to test whether the results would change in a sample of apple shaped individuals, in which body fat markers could potentially be more strongly related to the risk of CVD mortality. The differences between BMI and adiposity markers persisted, HRs (and its CIs) for very high BMI were markedly larger than those of very high levels of either BF% or FMI (See Supplemental Table 1). In addition, we tested whether the proportion of missing values for WC was equal in men and women, and it was not. There were more missing data (proportionally) in women (33%) than in men (24%), P<0.001. In order to test whether the missing data on WC could influence the main study findings, we run again all the main models in a subsample with valid data on WC, and also in the subsample assessed with hydrostatic assessment with valid data on WC. In all cases, the HRs associated with CVD mortality were higher for very high BMI than for very high BF% or FMI, when compared with the respective middle groups.
We also run the models (same exposures and outcomes as in Figures 1 and 2) with additional adjustment for CRF (VO2max). All the HRs were attenuated as a result of this additional adjustment (Supplemental Table 2); nevertheless, a very high BMI persisted associated with a 1.6 (CI: 1.3-2.1) higher risk of CVD mortality compared with middle levels of BMI, being the corresponding HRs for BF% 1.0 (CI: 0.9-1.3) and for FMI 1.3 (CI: 1.1-1.6). Interestingly, a very high FFM and FFMI also remained significantly related to higher CVD mortality after additional adjustment for CRF, i.e. HR=1.4 (CI: 1.0-1.8) and HR=1.6 (CI: 1.3-2.1) respectively. Likewise, additional adjustments for hypertension attenuated all the HRs, yet differences between BMI models and BF% or FMI persisted (See Supplemental Table 3). On the other hand, the results were not altered after additional adjustment for hypercholesterolemia (data not shown).
DISCUSSION
Main findings
The present study contributes to the existing knowledge with several major findings, which have implications for clinical practice and public health applications, as well as for the fundamental understanding of obesity and its adverse consequences. First, the main findings were directly related to daily clinical practice and epidemiology: a) BMI was a stronger predictor of CVD mortality than total adiposity markers, particularly BF% and FMI, assessed with accurate methods (including a gold-standard); b) if total adiposity is to be assessed, FMI is far more predictive of CVD mortality than BF%. Second, concerning our current understanding of what obesity means, this study provides the following novel findings: a) we used BMI, FMI and FFMI as indicators of body weight, fat and FFM, respectively normalized by height, and our results supported the notion that an excess of body weight is more associated with a worse CVD prognosis than is an excess of total BF; b) in addition, not only is an excess of BF related with higher risk of CVD mortality, but also and to a similar extent an excess of FFM increases CVD mortality risk. The results are very consistent and persisted in all the sensitivity/exploratory analyses conducted. The differences between the models including BMI and those including BF% or FMI were present: 1) when the analyses were conducted in the whole sample and in the sub-sample with hydrostatic weighing assessment, as well as in the sub-sample with a high WC. 2) after additional adjustment for CRF, hypertension or hypercholesterolemia. Finally, the fact that the c-index observed for the model including BMI was significantly higher than for the models including BF% or FMI, support the notion than BMI might be a stronger predictor of CVD mortality than markers of total adiposity measured using gold-standard methods.
Physiological interpretation of the findings
If body weight is the sum of fat mass plus FFM, and a high body weight (normalized by height, i.e. high BMI) predicted CVD mortality more strongly than a high fat mass (normalized by height, i.e. high FMI), the most logical explanation for this finding would be that the remaining part of body weight, i.e. the FFM, is also contributing to the larger effect size associated with a high BMI. This notion is supported by our results by showing that a high FFMI (FFM normalized by height) was associated with higher risk of CVD mortality to a similar extent that a high FMI, so that high FMI plus high FFMI result in a high BMI that provides the strongest prediction of CVD mortality.
When interpreting these findings, it is important to bear in mind that obese individuals (defined by the internationally accepted BMI>30kg/m2) are not only heavier and fatter than their normal-weight peers but also have higher levels of FFM 27-29, a human adaptation to the extra load (body weight) that these individuals have to carry during their daily life activities. This fact together with the principles of pathophysiology and hemodynamics of CVD in relation to obesity provide a solid mechanistic explanation to our findings. The higher FFM largely explains the higher circulating blood volume that has been observed in obese individuals. This increases the left ventricular stroke volume which in turns increases the cardiac output. These changes place an extra burden on the heart resulting in ventricular (both left and right) alterations that ultimately lead to ventricular (both left and right) hypertrophy and enlargement, predisposing obese people to heart failure. More detailed information about obesity and its relationship with pathophysiology and hemodynamics of CVD is provided elsewhere 1,30,31.
The role of high fat mass in CVD has been more extensively studied. First, it is well-known that this worsens most of the CVD risk factors, such as plasma lipids, blood pressure, glucose and inflammation. In addition, it increases the risk of sleep apnea, which ultimately is associated with right ventricular hypertrophy and enlargement, increasing the risk of right ventricular failure 1. Our findings are supported by other studies that observed a positive association between FFM/lean mass and CVD risk factors in young people 32-35. Bigaard and colleagues36 observed a reversed J-shape association between FFMI and all-cause mortality, using bioelectrical impedance to assess body composition and additionally adjusting by FMI what could have attenuated the association since it is known that obese people have both high fat mass and high FFM. Recently, Moreno et al.,37 have demonstrated that lean mass rather than fat mass is an independent determinant of carotid intima media thickness in obese subjects, which would contribute to explain the higher risk in CVD mortality observed in our study in individuals with a very high FFMI. Pooling all this evidence together, the accumulated physiological consequences of high FFM and high fat mass for CVD can explain why BMI, which includes both FFM and fat mass (in fact, BMI is the mathematical sum of FMI + FFMI), can be a stronger predictor than these two components of body composition separately. These findings and pathophysiology explanations might lead to a change in the understanding of obesity. Obesity might be considered as an excess of body weight (which includes the fat and non-fat components), rather than an excess of adiposity alone. In addition, BMI has been strongly criticized by its lack of ability to distinguish between fat and non-fat components; our findings, however, show that BMI, by including both components together, might be more clinically meaningful than accurate measures (including gold-standard methods) of the fat component alone. In line with our findings and interpretations, Dr. Wells, a well-known expert on body composition analysis, recently pointed out that “BMI is not a good index of adiposity, but might be a good index of cardio-metabolic risk” 38. Figure 3 presents a graphical view of the main study findings, as well as our physiological interpretations.
Figure 3. Graphical illustration of the main findings of the present study and plausible physiological interpretation.
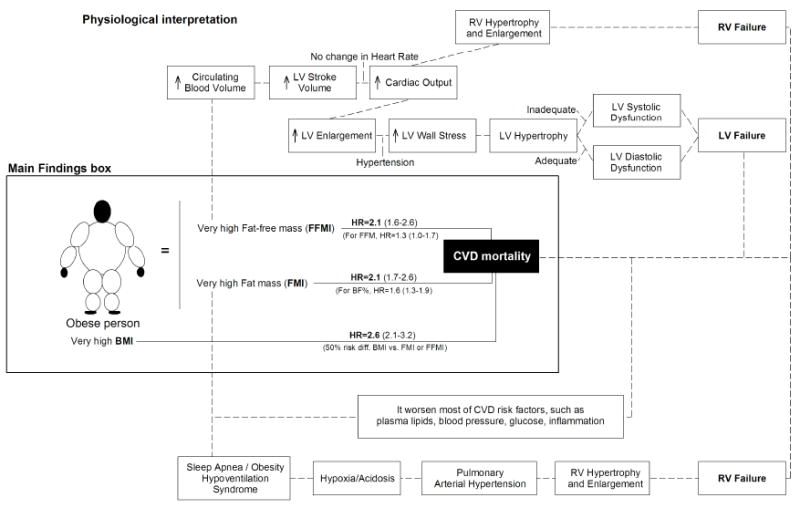
BMI indicates body mass index; BF%, percent body fat; FMI, fat mass index; FFM, fat-free mass; FFMI, fat-free mass index; CVD, cardiovascular disease; LV, left ventricular; RV, right ventricular. Part of the physiological interpretation shown is adapted with permission from Lavie et al. 30. More detailed information about obesity and its relationship with pathophysiology and hemodynamics of CVD is provided elsewhere 1,30,39.
Finally, it is important to mention that the interpretation of the findings largely differ when we are referring to apparently healthy people, as it is the case in our study in which people with diagnoses of CVD or cancer at baseline were excluded from the analyses, compared with when we are referring to CVD patients or referral populations at baseline 40. In this second case, the so-called “obesity-mortality paradox” has been shown very consistently 1,40-44. In the current study, having a very high FMI and very high FFMI were both associated with higher risk of CVD mortality and all-cause mortality, whereas previous studies conducted in patients with stable coronary heart disease have shown the opposite trend, with high body fat combined with high FFMI was associated with the lowest risk of mortality 45.
Practical and clinical implications
The present study supports the use of BMI, a combination of fat mass and FFM, as a predictor of CVD prognosis. Of note is that this simple index was a stronger predictor of CVD than accurate measures of body composition, even when using a gold-standard method. This strongly supports the use of BMI in clinical epidemiology, which is in line with the recent AHA/ACC/TOS Guidelines for the Management of Overweight and Obesity in Adults 46. In order to do exact comparisons between the indexes used in this manuscript, we used our population-specific percentiles to define very high BMI. The percentile 95th used to define very high BMI corresponds with a BMI of 34 and 32kg/m2 for men and women, respectively, which in men is near to the international definition of Class II obesity (i.e. BMI>35kg/m2) and in women is near to Class I obesity (i.e. BMI>30kg/m2).
In addition, our results support the use of FMI instead of BF% and also the use of FFMI instead of FFM, showing that normalizing body composition components by squared height markedly increased their predictive capacity for CVD mortality. Based on these findings, whenever body composition components are to be assessed in relation to CVD prognosis, the use of FMI and FFMI is preferred to other markers traditionally used, such as BF%. The current study provides (Table 2) cut-points values for FMI and FFMI associated with a higher risk of CVD mortality, i.e. FMI equal or higher than 10.4 kg/m2 for men and 12.0 kg/m2 for women; and FFMI equal or higher than 24.3 kg/m2 for men and 20.6 kg/m2 for women. Although these cut-points are population-specific, they seem to match well with those reported for other Caucasian populations 14,16. The US-representative data from NHANES for a 25 year-old adult Caucasian individuals measured by Dual X-ray Absorptiometry (DEXA) for FMI equivalent to Class II obesity (BMI>35kg/m2) was 11.9 kg/m2 for men, while the FMI equivalent to Class I obesity (BMI>30kg/m2) was 12.9 kg/m2 for women 16. Whenever possible, country-specific reference values are desired , and these NHANES cut-points 16 supported by the association with CVD mortality reported in the present study , which could be very useful for clinical practice in USA. Similarly, the reference data (including percentile 95th) for FMI and FFMI reported by Schutz et al. could be useful for European populations 14.
Limitations and strengths
The majority of the participants were Caucasian, well-educated and with high professional positions, so we cannot know to which extent the present findings apply to other populations. Nevertheless, the main aim of the present study was to compare BMI with other body composition indexes in relation to CVD and all-cause mortality. Therefore, we believe that whether the study sample is more or less heavier and more or less fatter than the general US population or any other population is unlikely to have a major influence on the study conclusions. The number of women participating in the present study (N=16,101) is markedly smaller than the number of men (N=44,234), which is a limitation of the study. However, the fact that no interaction with sex was found suggests that the major findings hereby reported are consistent for both genders. We do not have information about where fat is located in the body, e.g. subcutaneous fat versus visceral fat what could influence CVD mortality. Since the methods used in this study do not allow to distinguish among different fat depots, we cannot examine whether all fat (e.g. intra-abdominal vs. subcutaneous) imparts the same risks.
The major strength of the present study is the use of a gold standard measure of body composition (i.e. hydrostatic weighing) in roughly 30,000 participants of whom a complete baseline examination and mortality outcomes were available. In addition, 21,681 participants were assessed with both methods (i.e. hydrostatic weighing and skinfolds) allowing to conduct cross-validation between methods (r>0.9) and resulting in good estimates of body composition for a sample of more than 60,000 participants. These data provided a unique opportunity to address the current study questions.
Conclusions
We make two major conclusions from these analyses:
Our data support that BMI is a stronger predictor of CVD mortality compared with accurate measures of adiposity, such as BF% and FMI. This suggests that the simple and inexpensive measure of BMI can be as clinically important measure or even more than total adiposity measures assessed by accurate, complex and expensive methods. Another major conclusion of this study is that FMI is a more informative measure of future CVD prognosis than is BF%. This has direct implications for clinical settings.
Considering a very high BMI as an indicator of an excess of body weight (normalized by height) and FMI as an indicator of an excess of BF (equally normalized by height), the results presented in this study suggest that an excess of body weight is a stronger predictor of CVD mortality than is an excess BF. In addition, our results support that an excess of FFM, and specially FFMI, is also associated with a higher risk of CVD mortality (as much as an excess of BF), which could explain why BMI (the mathematical sum of FMI + FFMI) can be a stronger predictor of CVD mortality than fat mass alone.
These findings have potentially important implications for current clinical practice, future research, as well as for general understanding obesity and its adverse consequences.
Supplementary Material
Supplemental Table 1. Hazard ratios for cardiovascular disease (CVD) mortality within individuals with a high waist circumference (i.e. >102 in men and >88cm in women, n=7,887), according to body mass index (BMI), percent body fat (BF%) and fat mass index (FMI) groups.
Supplemental Table 2. Hazard ratios for cardiovascular disease (CVD) mortality according to body mass index (BMI), percent body fat (BF%), fat mass index (FMI), fat-free mass (FFM) and fat-free mass index (FFMI) groups, after additional adjustment for cardiorespiratory fitness (maximal oxygen consumption, VO2max, ml/kg/min).
Supplemental Table 3. Hazard ratios for cardiovascular disease (CVD) mortality according to body mass index (BMI), percent body fat (BF%), fat mass index (FMI), fat-free mass (FFM) and fat-free mass index (FFMI) groups, after additional adjustment for hypertension.
Supplemental Figure 1. Hazard ratios for all-cause mortality according to body mass index (BMI), percent body fat (BF%), fat mass index (FMI), fat-free mass (FFM) and fat-free mass index (FFMI) groups (N=60,335).
Body weight/body fat groups were estimated based on sex-specific centiles: Very low if < percentile 5th, Low if percentile 5th-15th, Middle if percentile 15th-85th, High if percentile 85th-95th and Very high if above percentile 95th.
All the models were adjusted for age, sex, examination year, smoking, alcohol consumption, inactivity and parental history of cardiovascular disease and cancer.
Acknowledgments
We thank Jonatan R Ruiz (University of Granada, Spain; and Karolinska Institutet, Sweden), Idoia Labayen (University of Basque Country, Spain) and Signe Altmäe (University of Granada, Spain; and University of Tartu, Estonia) for comments on an earlier draft. We deeply thank Jairo Hidalgo-Migueles for his assistance with the c-index analyses conducted with the R statistical software. None of these individuals received compensation for their contributions to this article. We thank the Cooper Clinic physicians and technicians for collecting the baseline data, and staff at the Cooper Institute for data entry and data management.
Financial support
This work has been supported by National Institutes of Health grants AG06945, HL62508, and R21DK088195. The content is solely the responsibility of the authors and does not necessarily represent the official views of the National Institutes of Health. FBO has a grant from the Spanish Ministry of Science and Innovation (RYC-2011-09011). The funders had no role in study design, data collection and analysis, decision to publish, or preparation of the manuscript.
LIST OF ABBREVIATIONS
- BF%
body fat percentage
- BMI
body mass index
- CIs
95% confidence intervals
- CVD
cardiovascular disease
- FMI
fat mass index
- FFM
fat-free mass
- FFMI
fat-free mass index
- HRs
hazard ratios
Footnotes
conflict of interest
The authors have declared that no competing interests exist.
Publisher's Disclaimer: This is a PDF file of an unedited manuscript that has been accepted for publication. As a service to our customers we are providing this early version of the manuscript. The manuscript will undergo copyediting, typesetting, and review of the resulting proof before it is published in its final citable form. Please note that during the production process errors may be discovered which could affect the content, and all legal disclaimers that apply to the journal pertain.
References
- 1.Lavie CJ, McAuley PA, Church TS, Milani RV, Blair SN. Obesity and cardiovascular diseases: implications regarding fitness, fatness, and severity in the obesity paradox. J Am Coll Cardiol. 2014;63(14):1345–1354. doi: 10.1016/j.jacc.2014.01.022. [DOI] [PubMed] [Google Scholar]
- 2.Flegal KM, Kit BK, Orpana H, Graubard BI. Association of all-cause mortality with overweight and obesity using standard body mass index categories: a systematic review and meta-analysis. JAMA. 2013;309(1):71–82. doi: 10.1001/jama.2012.113905. [DOI] [PMC free article] [PubMed] [Google Scholar]
- 3.Ahima RS, Lazar MA. Physiology. The health risk of obesity-better metrics imperative. Science. 2013;341(6148):856–858. doi: 10.1126/science.1241244. [DOI] [PubMed] [Google Scholar]
- 4.Lee CD, Blair SN, Jackson AS. Cardiorespiratory fitness, body composition, and all-cause and cardiovascular disease mortality in men. Am J Clin Nutr. 1999;69(3):373–380. doi: 10.1093/ajcn/69.3.373. [DOI] [PubMed] [Google Scholar]
- 5.Sui X, LaMonte MJ, Laditka JN, et al. Cardiorespiratory fitness and adiposity as mortality predictors in older adults. JAMA. 2007;298(21):2507–2516. doi: 10.1001/jama.298.21.2507. [DOI] [PMC free article] [PubMed] [Google Scholar]
- 6.Ortega FB, Lee DC, Katzmarzyk PT, et al. The intriguing metabolically healthy but obese phenotype: cardiovascular prognosis and role of fitness. Eur Heart J. 2013;34(5):389–397. doi: 10.1093/eurheartj/ehs174. [DOI] [PMC free article] [PubMed] [Google Scholar]
- 7.Blair SN, Kohl HW, 3rd, Paffenbarger RS, Jr, Clark DG, Cooper KH, Gibbons LW. Physical fitness and all-cause mortality. A prospective study of healthy men and women. JAMA. 1989;262(17):2395–2401. doi: 10.1001/jama.262.17.2395. [DOI] [PubMed] [Google Scholar]
- 8.Hooker SP, Sui X, Colabianchi N, et al. Cardiorespiratory fitness as a predictor of fatal and nonfatal stroke in asymptomatic women and men. Stroke. 2008;39(11):2950–2957. doi: 10.1161/STROKEAHA.107.495275. [DOI] [PubMed] [Google Scholar]
- Cheng YJ, Macera CA, Addy CL, Sy FS, Wieland D, Blair SN. Effects of physical activity on exercise tests and respiratory function. Br J Sports Med. 2003;37(6):521–528. doi: 10.1136/bjsm.37.6.521. [DOI] [PMC free article] [PubMed] [Google Scholar]
- Manson JE, Stampfer MJ, Hennekens CH, Willett WC. Body weight and longevity. A reassessment. JAMA. 1987;257(3):353–358. [PubMed] [Google Scholar]
- Jackson AW, Lee DC, Sui X, et al. Muscular strength is inversely related to prevalence and incidence of obesity in adult men. Obesity (Silver Spring) 2010;18(10):1988–1995. doi: 10.1038/oby.2009.422. [DOI] [PubMed] [Google Scholar]
- 12.Jackson AS, Pollock ML. Generalized equations for predicting body density of men. Br J Nutr. 1978;40(3):497–504. doi: 10.1079/bjn19780152. [DOI] [PubMed] [Google Scholar]
- 13.Jackson AS, Pollock ML, Ward A. Generalized equations for predicting body density of women. Med Sci Sports Exerc. 1980;12(3):175–181. [PubMed] [Google Scholar]
- 14.Schutz Y, Kyle UU, Pichard C. Fat-free mass index and fat mass index percentiles in Caucasians aged 18-98 y. Int J Obes Relat Metab Disord. 2002;26(7):953–960. doi: 10.1038/sj.ijo.0802037. [DOI] [PubMed] [Google Scholar]
- 15.Cole TJ, Fewtrell MS, Prentice A. The fallacy of using percentage body fat as a measure of adiposity. Am J Clin Nutr. 2008;87(6):1959. doi: 10.1093/ajcn/87.6.1959. [DOI] [PubMed] [Google Scholar]
- 16.Kelly TL, Wilson KE, Heymsfield SB. Dual energy X-Ray absorptiometry body composition reference values from NHANES. PLoS One. 2009;4(9):e7038. doi: 10.1371/journal.pone.0007038. [DOI] [PMC free article] [PubMed] [Google Scholar]
- 17.Balke B, Ware RW. An experimental study of physical fitness of Air Force personnel. U S Armed Forces Med J. 1959;10(6):675–688. [PubMed] [Google Scholar]
- 18.Pollock ML, Bohannon RL, Cooper KH, et al. A comparative analysis of four protocols for maximal treadmill stress testing. Am Heart J. 1976;92(1):39–46. doi: 10.1016/s0002-8703(76)80401-2. [DOI] [PubMed] [Google Scholar]
- 19.Pollock ML, Foster C, Schmidt D, Hellman C, Linnerud AC, Ward A. Comparative analysis of physiologic responses to three different maximal graded exercise test protocols in healthy women. Am Heart J. 1982;103(3):363–373. doi: 10.1016/0002-8703(82)90275-7. [DOI] [PubMed] [Google Scholar]
- 20.American College of Sports Medicine. ACSM’s Guidelines For Exercise Testing And Prescription. 8. Philadelphia: Lippincott Williams and Wilkins; 2009. [Google Scholar]
- 21.Katzmarzyk PT, Church TS, Blair SN. Cardiorespiratory fitness attenuates the effects of the metabolic syndrome on all-cause and cardiovascular disease mortality in men. Arch Intern Med. 2004;164(10):1092–1097. doi: 10.1001/archinte.164.10.1092. [DOI] [PubMed] [Google Scholar]
- 22.Perloff D, Grim C, Flack J, et al. Human Blood Pressure Determination by Sphymomanometry. Dallas, TX: American Heart Association; 2001. [Google Scholar]
- 23.Anderson RN, Minino AM, Hoyert DL, Rosenberg HM. Comparability of cause of death between ICD-9 and ICD-10: preliminary estimates. Natl Vital Stat Rep. 2001;49(2):1–32. [PubMed] [Google Scholar]
- 24.Harrell FE, Jr, Califf RM, Pryor DB, Lee KL, Rosati RA. Evaluating the yield of medical tests. JAMA. 1982;247(18):2543–2546. [PubMed] [Google Scholar]
- 25.Harrell FE, Jr, Lee KL, Califf RM, Pryor DB, Rosati RA. Regression modelling strategies for improved prognostic prediction. Stat Med. 1984;3(2):143–152. doi: 10.1002/sim.4780030207. [DOI] [PubMed] [Google Scholar]
- 26.Kang L, Chen W, Petrick NA, Gallas BD. Comparing two correlated C indices with right-censored survival outcome: a one-shot nonparametric approach. Stat Med. 2015;34(4):685–703. doi: 10.1002/sim.6370. [DOI] [PMC free article] [PubMed] [Google Scholar]
- 27.Ekelund U, Franks PW, Wareham NJ, Aman J. Oxygen uptakes adjusted for body composition in normal-weight and obese adolescents. Obes Res. 2004;12(3):513–520. doi: 10.1038/oby.2004.58. [DOI] [PubMed] [Google Scholar]
- 28.Salvadori A, Fanari P, Mazza P, Agosti R, Longhini E. Work capacity and cardiopulmonary adaptation of the obese subject during exercise testing. Chest. 1992;101(3):674–679. doi: 10.1378/chest.101.3.674. [DOI] [PubMed] [Google Scholar]
- 29.Salvadori A, Fanari P, Tovaglieri I, et al. Ventilation and its control during incremental exercise in obesity. Respiration. 2008;75(1):26–33. doi: 10.1159/000097245. [DOI] [PubMed] [Google Scholar]
- 30.Lavie CJ, Alpert MA, Arena R, Mehra MR, Milani RV, Ventura HO. Impact of obesity and the obesity paradox on prevalence and prognosis in heart failure. JACC Heart Fail. 2013;1(2):93–102. doi: 10.1016/j.jchf.2013.01.006. [DOI] [PubMed] [Google Scholar]
- 31.Alpert MA, Omran J, Mehra A, Ardhanari S. Impact of obesity and weight loss on cardiac performance and morphology in adults. Prog Cardiovasc Dis. 2014;56(4):391–400. doi: 10.1016/j.pcad.2013.09.003. [DOI] [PubMed] [Google Scholar]
- 32.Brion MA, Ness AR, Davey Smith G, Leary SD. Association between body composition and blood pressure in a contemporary cohort of 9-year-old children. J Hum Hypertens. 2007;21(4):283–290. doi: 10.1038/sj.jhh.1002152. [DOI] [PMC free article] [PubMed] [Google Scholar]
- 33.Gracia-Marco L, Moreno LA, Ruiz JR, et al. Body Composition Indices and Single and Clustered Cardiovascular Disease Risk Factors in Adolescents: Providing Clinical-Based Cut-Points. Prog Cardiovasc Dis. 2015 doi: 10.1016/j.pcad.2015.11.002. [DOI] [PubMed] [Google Scholar]
- 34.Grijalva-Eternod CS, Lawlor DA, Wells JC. Testing a capacity-load model for hypertension: disentangling early and late growth effects on childhood blood pressure in a prospective birth cohort. PLoS One. 2013;8(2):e56078. doi: 10.1371/journal.pone.0056078. [DOI] [PMC free article] [PubMed] [Google Scholar]
- 35.Lawlor DA, Benfield L, Logue J, et al. Association between general and central adiposity in childhood, and change in these, with cardiovascular risk factors in adolescence: prospective cohort study. BMJ. 2010;341:c6224. doi: 10.1136/bmj.c6224. [DOI] [PMC free article] [PubMed] [Google Scholar]
- 36.Bigaard J, Frederiksen K, Tjonneland A, et al. Body fat and fat-free mass and all-cause mortality. Obes Res. 2004;12(7):1042–1049. doi: 10.1038/oby.2004.131. [DOI] [PubMed] [Google Scholar]
- 37.Moreno M, Puig J, Moreno-Navarrete JM, et al. Lean mass, and not fat mass, is an independent determinant of carotid intima media thickness in obese subjects. Atherosclerosis. 2015;243(2):493–498. doi: 10.1016/j.atherosclerosis.2015.09.012. [DOI] [PubMed] [Google Scholar]
- 38.Wells JC. Commentary: The paradox of body mass index in obesity assessment: not a good index of adiposity, but not a bad index of cardio-metabolic risk. Int J Epidemiol. 2014;43(3):672–674. doi: 10.1093/ije/dyu060. [DOI] [PMC free article] [PubMed] [Google Scholar]
- 39.Alpert MA, Lavie CJ, Agrawal H, Aggarwal KB, Kumar SA. Obesity and heart failure: epidemiology, pathophysiology, clinical manifestations, and management. Transl Res. 2014;164(4):345–356. doi: 10.1016/j.trsl.2014.04.010. [DOI] [PubMed] [Google Scholar]
- 40.De Schutter A, Lavie CJ, Kachur S, Patel DA, Milani RV. Body composition and mortality in a large cohort with preserved ejection fraction: untangling the obesity paradox. Mayo Clin Proc. 2014;89(8):1072–1079. doi: 10.1016/j.mayocp.2014.04.025. [DOI] [PubMed] [Google Scholar]
- 41.De Schutter A, Lavie CJ, Milani RV. The impact of obesity on risk factors and prevalence and prognosis of coronary heart disease-the obesity paradox. Prog Cardiovasc Dis. 2014;56(4):401–408. doi: 10.1016/j.pcad.2013.08.003. [DOI] [PubMed] [Google Scholar]
- 42.Sharma A, Vallakati A, Einstein AJ, et al. Relationship of body mass index with total mortality, cardiovascular mortality, and myocardial infarction after coronary revascularization: evidence from a meta-analysis. Mayo Clin Proc. 2014;89(8):1080–1100. doi: 10.1016/j.mayocp.2014.04.020. [DOI] [PubMed] [Google Scholar]
- 43.Clark AL, Fonarow GC, Horwich TB. Obesity and the obesity paradox in heart failure. Prog Cardiovasc Dis. 2014;56(4):409–414. doi: 10.1016/j.pcad.2013.10.004. [DOI] [PubMed] [Google Scholar]
- 44.Kalantar-Zadeh K, Rhee CM, Amin AN. To legitimize the contentious obesity paradox. Mayo Clin Proc. 2014;89(8):1033–1035. doi: 10.1016/j.mayocp.2014.06.015. [DOI] [PMC free article] [PubMed] [Google Scholar]
- 45.Lavie CJ, De Schutter A, Patel DA, Romero-Corral A, Artham SM, Milani RV. Body composition and survival in stable coronary heart disease: impact of lean mass index and body fat in the “obesity paradox”. J Am Coll Cardiol. 2012;60(15):1374–1380. doi: 10.1016/j.jacc.2012.05.037. [DOI] [PubMed] [Google Scholar]
- 46.Jensen MD, Ryan DH, Apovian CM, et al. 2013 AHA/ACC/TOS guideline for the management of overweight and obesity in adults: a report of the American College of Cardiology/American Heart Association Task Force on Practice Guidelines and The Obesity Society. Circulation. 2014;129(25 Suppl 2):S102–138. doi: 10.1161/01.cir.0000437739.71477.ee. [DOI] [PMC free article] [PubMed] [Google Scholar]
Associated Data
This section collects any data citations, data availability statements, or supplementary materials included in this article.
Supplementary Materials
Supplemental Table 1. Hazard ratios for cardiovascular disease (CVD) mortality within individuals with a high waist circumference (i.e. >102 in men and >88cm in women, n=7,887), according to body mass index (BMI), percent body fat (BF%) and fat mass index (FMI) groups.
Supplemental Table 2. Hazard ratios for cardiovascular disease (CVD) mortality according to body mass index (BMI), percent body fat (BF%), fat mass index (FMI), fat-free mass (FFM) and fat-free mass index (FFMI) groups, after additional adjustment for cardiorespiratory fitness (maximal oxygen consumption, VO2max, ml/kg/min).
Supplemental Table 3. Hazard ratios for cardiovascular disease (CVD) mortality according to body mass index (BMI), percent body fat (BF%), fat mass index (FMI), fat-free mass (FFM) and fat-free mass index (FFMI) groups, after additional adjustment for hypertension.
Supplemental Figure 1. Hazard ratios for all-cause mortality according to body mass index (BMI), percent body fat (BF%), fat mass index (FMI), fat-free mass (FFM) and fat-free mass index (FFMI) groups (N=60,335).
Body weight/body fat groups were estimated based on sex-specific centiles: Very low if < percentile 5th, Low if percentile 5th-15th, Middle if percentile 15th-85th, High if percentile 85th-95th and Very high if above percentile 95th.
All the models were adjusted for age, sex, examination year, smoking, alcohol consumption, inactivity and parental history of cardiovascular disease and cancer.