Abstract
Objective
To present audiometric data in three dimensions by considering age as an addition dimension.
Methods
Audioprofile surfaces (APSs) were fitted to a set of audiograms by plotting each measurement of an audiogram as an independent point in three dimensions with the x, y, and z axes representing frequency, hearing loss in dB, and age, respectively.
Results
Using the Java-based APS viewer as a stand-alone application, APSs were pre-computed for 34 loci. By selecting APSs for the appropriate genetic locus, a clinician can compare this APS-generated average surface to a specific patient’s audiogram.
Conclusion
APSs provide an easily interpreted visual representation of a person’s hearing acuity relative to others with the same genetic cause of hearing loss. APSs will support the generation and testing of sophisticated hypotheses to further refine our understanding of the biology of hearing.
Introduction
For nearly a century the audiogram has remained essentially unchanged, reflecting a history that dates back to 1896 when the first audiometer was developed by Carl E. Seashore at the University of Iowa to measure the ‘keenness of hearing’ [1]. The device was limited to measuring the intensity of a single sound (clicks) generated by turning a knob that would repeatedly open and close a mechanical contact. Later versions of the Seashore audiometer were used by the US Army and Navy to identify military recruits best able to listen for submarines or serve as radio-telegraphy operators[2]. Although the Seashore audiometer lacked a standard scale, it was one of the first devices built to register sound intensity logarithmically [3].
Thirty years later Harvey Fletcher and Robert L. Wegel developed the first commercially available audiometer, called the Western Electric A-1, an advance made possible by the invention of the vacuum tube[4]. It was the size of a small refrigerator and sold for $1,500[3]. At this time the audiogram as it is known today was formalized – a graphic representation of hearing thresholds at standardized frequencies depicted by intensity in decibels on the Y axis against frequency in hertz on the X axis. Acuity was plotted relative to a standardized curve of normal hearing in dB(HL) to accommodate frequency-specific differences in the threshold of hearing. Also included was the ‘threshold of pain’ at the measured frequencies.
In this study, we sought to achieve two objectives: first, in recognizing the heterogeneity of inherited deafness, we wanted to group similar genetic causes of hearing loss together to establish whether this type of grouping would be clinically informative; and second, we wanted to add a third dimension, age, to the typical audiogram to provide an easily interpreted visual representation of a person’s hearing thresholds relative to other persons with the same genetic cause of hearing loss.
To date, the standard approach to visualize progression of hearing loss in a genetically similar cohort has used age-related typical audiograms (ARTAs) [5]. An ARTA is a two-dimensional plot that includes multiple audiograms generated by fitting linear equations to each frequency and then interpolating idealized audiograms from the linear equations for specific ages ranging from 0–70 years in 10-year increments. Our method improves upon the ARTA in two important ways. First, it fits a three-dimensional surface to the audiograms and therefore considers ages as a continuous variable during fitting, thereby converting a set of discrete audiograms into a continuous surface that can allow interpolation between measured ages. Second, by rendering the fitted surface in 3D and using a color gradient scheme based on dB HL, progression of hearing loss is easily visualized. If desired, the 3D surface can be rendered in 2D in the same manor as an ARTA. We believe this representation of genetically similar types of hearing loss represents an important advance with clinical and research implications.
Methods
Clustering
Audiograms from persons with genetically similar causes of hearing loss were clustered using AudioGene, a software system employing machine-learning techniques to extract phenotypic information from audiograms, as previously described [6].
Audioprofile Surfaces
Audioprofile surfaces (APSs) were fitted to a set of audiograms by plotting each measurement of an audiogram as an independent point in three dimensions with the x, y, and z axes representing frequency (125 Hz, 250 Hz, etc), hearing loss in dB, and age, respectively. Each audiogram was transformed into 10 or fewer points in a three-dimensional space, depending on the number of frequencies measured. The x values, corresponding to frequencies, were transformed using a log scale such that 125 Hz is 1, 250 Hz is 2, and so on.
Using the points from a set of N audiograms, multiple surfaces were fitted using least squared regression with bi-squared robustness [7,8]. These surfaces were considered candidate audioprofile surfaces and then rank-ordered. The rank of a candidate APS was determined by its root mean squared error (RMSE) during k-fold cross-validation (CV). CV was performed by randomly splitting the dataset into k subsets or folds. Each fold was withheld in turn while the surfaces were fit to the remaining data. The RMSE of the withheld fold was then computed by using the fitted surface. These steps were repeated for each fold; the final RMSE value used was the average of the RMSE values across all folds (normalized RMSE). APSs were ranked from smallest to largest RMSE.
The equations for the candidate surfaces were chosen to capture the expected patterns of hearing loss, expanding the set of candidate surfaces at the discretion of the user. Hearing loss patterns that were commonly seen included ‘cookie-bite’, ‘down-sloping’, ‘up-sloping’ and ‘flat’. As an example, surface equation (1) represents a surface according to a second-degree polynomial along the x-axis (frequency) and a third-degree polynomial along the z-axis (age). Equations (2) and (3) obey the same degree polynomial along the x-axis as equation (1) but follow second and first-degree polynomials along the z-axis. The full set of equations used for fitting the different surfaces are shown here (equations 1–3):
| (1) |
| (2) |
| (3) |
Using the coefficients of the fitted surface equation, an audiogram can be generated for a specific set of ages by fixing the age (z-value) and then iterating over the x values (frequencies). These curves can be plotted in the same manner as the ARTA on a standard 2D audiogram. Extrapolating surfaces outside of the age range used for fitting was not done and is not recommended.
Software Access
The Matlab scripts for fitting audioprofile surfaces and computing the cross-validation RMSE are available on github with an example dataset [9]. Scripts are also available for plotting the resulting surfaces in 3D. For portability, a stand-alone Java application is available to view the surfaces of 34 different loci but this option does not include the ability to fit surfaces [10]. The Java application is compiled and can be run on Linux, Mac and Windows operating systems with Java installed. The source code for the viewer is also available on github [11].
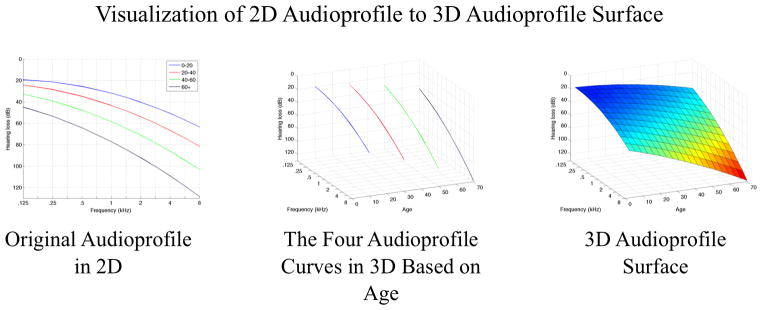
An example of an audioprofile and APS with an intermediate rendering to illustrate the perspective change from two to three dimensions is shown in Figure 1. The four audiograms represent average audiograms for 20-year increments and are shown in 3D with their age values set to split the age range, i.e. 0–20 is 10 years. In the final rendering, the APS is shown with wire-mesh and colors to indicate progression of hearing loss, which when coupled together, allow progression to be clearly seen.
Figure 1.
Comparing two-dimensional to three-dimensional audioprofiles. The relationship between audioprofiles and the audioprofile surface (APS) is shown, using simulated audiograms for illustrative purposes. The APS represents average thresholds as a function of frequency and age for a specific genetic type of hearing loss. By plotting the APS in three dimensions, differences in rate of change of thresholds with frequency and age are easily appreciated. As a clinical tool, by plotting an audiogram on an APS, it becomes possible to compare a specific patient’s data with average thresholds in the context of that particular genetic type of hearing loss. Prognostic information, such as rate of progression of hearing loss, is readily apparent and easily interpreted.
The standard audiogram with multiple audiograms at different ages can be thought of as a two-dimensional projection. In comparison, the APS can be thought of as a continuous representation of hearing loss with age, with each measurement representing a slice of the APS at a specific point on the age axis. This rendering represents the average thresholds for any specific point in time and therefore ignores transient effects that modulate hearing levels such as otitis media. With repeated measurements over time from multiple persons, the APS for each genetic type of hearing loss becomes more robust.
Results
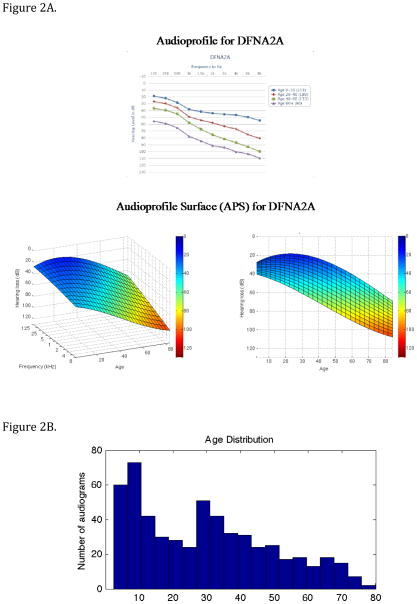
The audioprofile and APS for DFNA2 (KNCQ4) are shown in Figure 2. Two perspectives for the APS are seen: one volumetric perspective showing both age and frequency axes extending outward toward the viewer and the other showing the frequency axis hidden. Using the Java-based live animation display tool, any arbitrary perspective can be chosen to allow the user to view various attributes of the APS. As compared to the two-dimensional audioprofile, this versatility has several advantages. For example, by hiding the frequency axis, one can see that age-related progression of DFNA2 hearing loss is greatest in the high frequencies. The APS also allows for any age-specific audiogram to be synthetically generated from the surface by fixing the z value (age) of the surface equation and iteratively setting the value of x to be the value of specific frequencies.
Figure 2.
Figure 2A. Comparison between a multi-age composite audioprofile and APS for DFNA2 (KCNQ4). The color redundantly indicates the severity of hearing loss for the APS. Note that the two-dimensional representation of the three-dimensional APS clearly illustrates that KNCQ4 hearing loss is greatest in the high frequencies.
Figure 2B. Age distribution of patients used to generate the DFNA2A APS in 2A. Most age groups included audiograms on at least 20 persons, with a skew towards the younger age groups.
APS Viewer
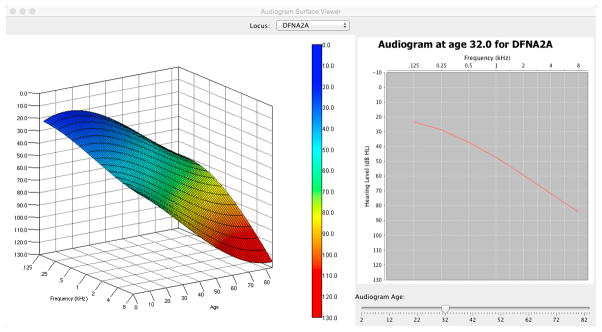
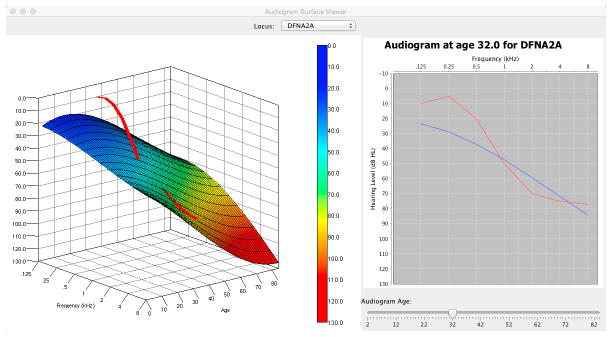
The Java-based APS viewer is a stand-alone application that allows clinicians to view pre-computed APSs for 34 loci and to manipulate the three-dimensional perspective without additional software (Java is required). By selecting APSs for different loci, the clinician can plot average-expected audiograms at specific ages and compare this APS-generated average to a specific patient’s audiogram. An example of a comparision between the APS for DFNA2A and a patient’s audiogram is shown in Figure 3. Both 3D and 2D views of the audioprofile can be seen, with the 2D view being the traditional audiogram at a specific age. The 2D reference audiogram was generated from the surface equation by fixing the age parameter and iterating over the frequency parameter. By comparing a patient’s audiogram at a specific age with both the APS and 2D audiogram, a clinician can determine how typical or atypical the patient’s progression is compared to the average for a given locus.
Figure 3.
Figure 3A. DFNA2 APS shown in 3D (left) and the corresponding audiogram generated from the surface at age 32 (right). 3B. Patient audiogram (red) at age 39 plotted in 3D space in relationship to the DFNA2A APS (left) and compared to average thresholds for DFNA2A at age 32 years (left).
Discussion
APSs and Their Clinical Application
In the era of precision medicine (also referred to as ‘personalized genomic medicine’), the APS offers two key benefits as compared to the traditional audiogram. First, by viewing hearing thresholds in the context of the APS, a patient can appreciate how their hearing compares to that of other persons with the same genetic cause of hearing loss. This information allows patients and doctors to make informed decisions regarding hearing healthcare. Second, as clinical trials are implemented to test novel hearing preservation therapies, gene-specific APSs can provide a metric against which to select patients for enrollment and against which to assess therapeutic efficacy.
APSs as a Research Tool
For the research community, the APS provides an invaluable tool with which to dissect complex interrelationships between genotypes and phenotypes. An example of the power of refinement is the phenotypic sub-classification of KCNQ4 (DFNA2) hearing loss. The APS is distinctly different depending upon mutation type, with truncating mutations exhibiting a more rapid decline in hearing thresholds at the high frequencies as compared to non-truncating mutations [12]. The APS of DFNA2A together with the APSs for patients with non-truncating or truncating mutations are shown in Figure 4. The difference in progression and the attenuation at different frequencies can be clearly seen.
Figure 4.
Figure 4A. DFNA2A APSs is shown on the left (i). After clustering, two surfaces are identifiable, one generated from persons segregating missense variants of KNCQ4 (ii), while the other is based on truncating variants of KCNQ4 (iii). Note the more rapid high frequency rate of decline associated with truncating mutations in this gene. B. The DFNA8/12 APS is shown on the left (i). Two APS subclusters are generated by cluster analysis of this dataset (ii and iii, which displays data from the frequency perspectice). Multivariate analysis shows that these two subclusters do not reflect mutation type, mutation location, patient age or patient sex, suggesting that the observed differences may reflect secondary genetic modifiers. Table 1 shows that this hypothesis is reasonable given the known variability in the protein constituents of the tectorial membrane.
Integrating low-cost comprehensive genetic testing for hearing loss [13] and AudioGene-based phenotype refinement permits researchers to explore hypotheses previously considered implausible to test. One germane example is in the identification of possible genetic modifiers. APSs can be used in a clustering technique called surface clustering to identify clusters of patients with similar patterns of hearing loss [14]. Applying this technique to patients with mutations in TECTA (DFNA8/12), two distinct clusters can be identified that are not dependent on mutation type, mutation domain, patient age or patient sex, raising the intriguing possibility that genetic modifiers may contribute to the observed differences. As a physical structure overlying the hair cells, the tectorial membrane is comprised of a limited number of proteins, variation in which may impact the ‘expected’ TECTA-associated hearing loss. The APS for TECTA and the associated sub-clusters are shown in Figure 4b.
Limitation of APSs
While the APS offers a unique improvement over the traditional audioprofile, it is not free from caveats. First, each gene-specific APS represents the average surface for the cohort of patients from which data have been collected. As such, all APS loci are dynamic and will change over time as more data are collected and as our understanding of genotype-phenotype relationships grows. As in the case of TECTA, sub-clusters will emerge that reflect phenotypic differences driven by a variety of genetic and/or environmental modifiers. This level of enhanced granularity is highly likely to improve our understanding of the biology of hearing and deafness, and serve an as important foundation for hearing preservation and hearing restoration initiatives.
Like audiograms, APSs only measure the attenuation of hearing at specific frequencies. Language understanding in association with specific audioprofiles is measured by the speech discrimination score (SDS) and the word recognition score (WRS), both of which will be incorporated into future versions of AudioGene to augment APS features and to determine whether specific genetic causes of hearing loss are associated with unique SDS and/or WRS findings.
Conclusion
APSs are three-dimensional representations of gene-specific average audiometric thresholds over time. They provide an easily interpreted visual representation of a person’s hearing acuity relative to others with the same genetic cause of hearing loss. For the clinician, this type of representation will be increasing valuable in providing patient-and-gene-specific outcomes as novel habilitation options for hearing loss are developed. For the research community, APSs will support the generation and testing of sophisticated hypotheses, such as the identification of genetic modifiers, further allowing us to refine our understanding of the biology of hearing.
Table 1.
Variant burden of the major proteins of the tectorial membrane
| Gene | Human Deafness Form | Total Variants | Functional Variants | Predicted Pathogenic | MAF ≥1 % | Functional Variants ≥1 % | Predicted Pathogenic ≥1 % |
|---|---|---|---|---|---|---|---|
| TECTA | DFNA8/12/DFNB21 | 379 | 176 | 118 | 23 | 4 | 1 |
| CEACAM16 | DFNA4B | 100 | 37 | 22 | 11 | 0 | 0 |
| OTOG | DFNB18B | ||||||
| OTOGL | DFNB84 | 480 | 199 | 15 | 49 | 13 | 1 |
| OTOA | DFNB22 | 211 | 63 | 35 | 12 | 14 | 1 |
| TECTB | 100 | 33 | 24 | 6 | 0 | 0 | |
| COL11A2 | DFNA13/DFNB53/STL3 | 376 | 98 | 78 | 36 | 4 | 4 |
| COL11A1 | STL2 | 492 | 133 | 87 | 60 | 5 | 1 |
| COL2A1 | STL1 | 449 | 88 | 56 | 57 | 4 | 1 |
| COL9A1 | STL4 | 313 | 92 | 70 | 43 | 4 | 1 |
| COL9A2 | STL5 | 242 | 55 | 36 | 41 | 6 | 4 |
Minor Allele Frequencies (MAF) calculated from the Exome Variant Server (EVS). Predicted Pathogenic based on PolyPhen2 prediction. Italics indicate data not available.
Acknowledgments
Funding: This research was supported in part by NIDCD Grants DC012049 (RJHS, TLC), DC011674 (AES) and NHMRC Postdoctoral Training Fellowship 546493 (MSH).
References
- 1.Seashore CE. University of Iowa studies in psychology. Vol. 2. Iowa City, Iowa: The University of Iowa; 1897. New Psychological Apparatus; pp. 153–163. [Google Scholar]
- 2.Seashore CE. THE IOWA PITCH RANGE AUDIOMETER AND ITS USES. Laryngoscope. 1923 Apr;33:295–308. [Google Scholar]
- 3.Vogel DA, McCarthy PA, Bratt GW, Brewer C. The Clinical Audiogram: Its History and Current Use. Communication Disorders Review. 2007 Jun 1; [Google Scholar]
- 4.Fletcher H. Annals of Otol, Rhinol & Laryngol. 35. 1926. New methods and apparatus for testing hearing; pp. 165–180. [Google Scholar]
- 5.Bom SJ, Van Camp G, Cryns K, Admiraal RJ, Huygen PL, Cremers CW. Autosomal dominant low-frequency hearing impairment (DFNA6/14): a clinical and genetic family study. Otology & neurotology LWW. 2002;23:876–884. doi: 10.1097/00129492-200211000-00012. [DOI] [PubMed] [Google Scholar]
- 6.Taylor KR, Deluca AP, Shearer AE, Hildebrand MS, Black-Ziegelbein EA, Anand VN, Sloan CM, Eppsteiner RW, Scheetz TE, Huygen PLM, Smith RJH, Braun TA, Casavant TL. AudioGene: Predicting Hearing Loss Genotypes from Phenotypes to Guide Genetic Screening. Human mutation. 2013 Apr;34:539–545. doi: 10.1002/humu.22268. [DOI] [PMC free article] [PubMed] [Google Scholar]
- 7.Bishop CM. Pattern Recognition and Machine Learning. Secaucus, NJ, USA: Springer-Verlag New York, Inc; 2006. [Google Scholar]
- 8.Holland PW, Welsch RE. Robust regression using iteratively reweighted least-squares. Communications in Statistics-Theory and Methods Taylor & Francis. 1977;6:813–827. [Google Scholar]
- 9.Audioprofile Surfaces Source Code [Internet] University of Iowa; [cited 2015 Apr 25]. Available from: https://github.com/clcg/audioprofile-surfaces. [Google Scholar]
- 10.APS Viewer [Internet] Univeristy of Iowa; [cited 2015 Apr 25]. Available from: http://audiogene.eng.uiowa.edu/aps-viewer. [Google Scholar]
- 11.Audioprofile Surface Viewer Source Code [Internet] University of Iowa; [cited 2015 Apr 25]. Available from: https://github.com/clcg/audioprofile-surface-viewer. [Google Scholar]
- 12.Kamada F, Kure S, Kudo T, Suzuki Y, Oshima T, Ichinohe A, Kojima K, Niihori T, Kanno J, Narumi Y, Narisawa A, Kato K, Aoki Y, Ikeda K, Kobayashi T, Matsubara Y. A novel KCNQ4 one-base deletion in a large pedigree with hearing loss: implication for the genotype-phenotype correlation. J Hum Genet. 2006;51:455–460. doi: 10.1007/s10038-006-0384-7. [DOI] [PubMed] [Google Scholar]
- 13.Shearer AE, Deluca AP, Hildebrand MS, Taylor KR, Gurrola J, Scherer S, Scheetz TE, Smith RJH. Comprehensive genetic testing for hereditary hearing loss using massively parallel sequencing. Proc Natl Acad Sci USA. 2010 Dec;107:21104–21109. doi: 10.1073/pnas.1012989107. [DOI] [PMC free article] [PubMed] [Google Scholar]
- 14.Taylor KR. Machine learning approaches for predicting genotype from phenotype and a novel clustering technique for subgenotype discovery: an application to inherited deafness. University of Iowa; 2014. [Google Scholar]


