

Abstract
Directional translocation of the ribosome through the messenger RNA open reading frame is a critical determinant of translational fidelity. This process entails a complex interplay of large-scale conformational changes within the actively translating particle, which together coordinate the movement of transfer and messenger RNA substrates with respect to the large and small ribosomal subunits. Using pre-steady state, single-molecule fluorescence resonance energy transfer imaging, we have tracked the nature and timing of these conformational events within the Escherichia coli ribosome from five structural perspectives. Our investigations reveal direct evidence of structurally and kinetically distinct, late intermediates during substrate movement, whose resolution is rate-determining to the translocation mechanism. These steps involve intra-molecular events within the EFG(GDP)-bound ribosome, including exaggerated, reversible fluctuations of the small subunit head domain, which ultimately facilitate peptidyl-tRNA’s movement into its final post-translocation position.
INTRODUCTION
The actively translating ribosome must maintain its reading frame on messenger RNA (mRNA) to properly synthesize the encoded protein. Accuracy in this process is ensured by precise temporal and spatial translocation of mRNA and transfer RNA (tRNA) substrates through adjacent aminoacyl (A), peptidyl (P) and exit (E) binding sites located at the interface of the large and small ribosome subunits (50S and 30S in bacteria)1–4. Perturbations in this mechanism affect cellular homeostasis, viral pathogenesis and human disease5. Elucidating how translocation occurs at the molecular scale is therefore paramount to understanding the regulation of protein synthesis and how directional movements are achieved in biological systems.
In Escherichia coli (E. coli), substrate movements are catalyzed by the highly conserved, five domain (I–V) GTPase, elongation factor G (EF-G). EF-G bound to the GTP nucleotide (EF-G(GTP)) selectively engages the pre-translocation (PRE) complex containing deacylated tRNA in the P site and peptidyl tRNA in the A site to facilitate directional movement of the mRNA-(tRNA)2 module. The translocation mechanism involves GTP hydrolysis while EF-G is bound to the ribosome2,6–8 (Fig. 1). Productive translocation generates a post-translocation (POST) complex in which the A- and P-site tRNAs have moved to the P and E sites, respectively.
Figure 1. Structural models of the bacterial ribosome and EF-G.
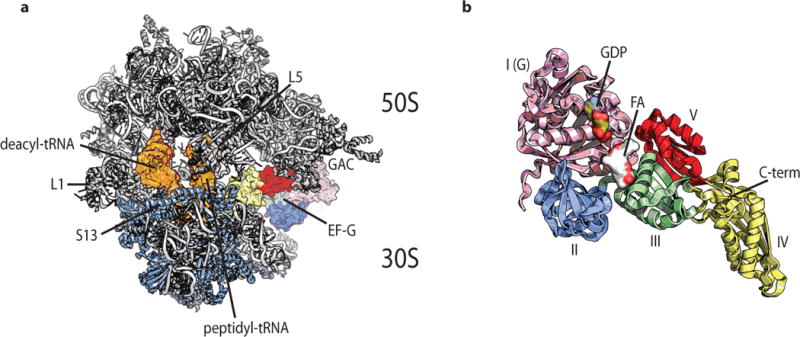
(a) The EF-G-bound, fusidic acid-stalled pre-translocation complex showing compacted positions of deacylated (deacyl) and peptidyl-tRNAs (orange). The rRNA and large subunit (50S) proteins are shown in grey; small subunit (30S) proteins are shown in blue. The positions of ribosomal proteins S13, L1 and L5 are indicated, as well as the GTPase activating center (GAC) and EF-G. (b) EF-G with structural domains, GDP and fusidic acid are indicated. Structural models were constructed from PDB accession codes 4V7B (ref. 21) and 4W29 (ref. 22).
The first descriptive framework of translocation, proposed by Spirin in 19689, posited that the ribosome must “unlock” to enable tRNA and mRNA movements with respect to the 30S subunit and “relock” to restrict substrate motions prior to subsequent steps in the elongation cycle. Bulk and single-molecule fluorescence investigations probing the “unlocking” process have revealed that translocation follows a multistep mechanism that entails large-scale conformational changes within and between the ribosomal subunits, correlated with rearrangements within EF-G10–13. These distinct structural events minimally include reversible rotation of the small subunit with respect to the large1,11,14,15, tRNA movements through partially translocated, “hybrid” positions1,14,16,17, closure of the L1 stalk at the E site12,18,19, and swiveling of the 30S head domain in the direction of tRNA movement13,20–24. However, the exact nature and temporal sequence of these structural processes, and the role of EF-G and GTP hydrolysis during translocation, remain unclear.
Landmark structures have recently revealed unexpected snapshot views of the EF-G-bound PRE complex21,22,25. Two structures, captured in the presence of fusidic acid (FA), an antibiotic which binds to the interface between domains I and III in EF-G, provide potentially critical new insights into bona fide intermediate states in the translocation process21,22 (Fig. 1). Contemporary translocation models posit that FA specifically prevents EF-G release from the ribosome after substrate translocation is complete while prior steps are unaffected12,15,26,27. However, in line with recent mechanistic investigations28, both structures suggest that FA traps the ribosome in a configuration where the mRNA-(tRNA)2 module is only partially translocated, where deacylated and peptidyl-tRNA occupy POST-like positions with respect to the small subunit body, and compacted PRE complex positions relative to the head domain21,22. These so-called intra-subunit hybrid tRNA positions are enabled by a pronounced, swivel-like motion (ca. 18°) of the small subunit head domain in the direction of substrate movement together with an orthogonal rotation of the small subunit body in the opposing direction. These new findings suggest that FA inhibits translocation prior to forming the POST complex by preventing reverse swivel of the head domain, a movement required to shift its register relative to the mRNA-(tRNA)2 module23,27,29. Discrepancies in the FA mechanism of action have yet to be reconciled.
In order to gain deeper insights into the order and timing of the molecular events mediating substrate translocation through the ribosome, we employed single-molecule fluorescence resonance energy transfer (smFRET) to image the complete translocation mechanism from five distinct structural perspectives under pre-steady state conditions. Three-color smFRET studies were also performed to establish the timing of EF-G binding and release from the ribosome relative to the conformational events underpinning translocation. The data obtained provide direct evidence of structurally “unlocked”, partially translocated intermediates and shed new light on how these transient configurations resolve to the POST state. These findings afford a structurally integrated, quantitative description of the complete translocation mechanism that clarifies the inhibitory action of FA. They also define intra-molecular conformational events within the EF-G(GDP)-bound ribosome, which include exaggerated, reversible movements of the small subunit head domain, as the rate-determining feature of directional substrate translocation.
RESULTS
To monitor key structural events taking place during translocation, we employed smFRET to image the relative movements of fluorophores site-specifically attached to small and large subunit ribosomal proteins, A- and P-site tRNAs, and EF-G within reconstituted PRE complexes (Online Methods). Components labeled in this fashion are fully functional in single-turnover and processive translation12,17,30,31. To achieve the time resolution required to capture transient intermediates, intra-molecularly stabilized fluorophores were utilized that exhibit enhanced brightness and photostability32 (Online Methods). As delineated below, five sets of uniquely labeled ribosome complexes were examined that provided distinct vantage points on the large-scale movements that accompany directional translocation. As tRNA composition within the PRE complex contributes to translocation rates12,33, each perspective was analyzed in two specific contexts: an ‘initiator’ PRE complex bearing deacylated tRNAfMet in the P site and fMet-Phe-tRNAPhe in the A site; an ‘elongator’ PRE complex bearing deacylated tRNAPhe in the P site and fMet-Phe-Lys-tRNALys in the A site.
EF-G rapidly translocates the rotated PRE complex
To probe the rotational state of the ribosome before, during and after translocation, we first employed a previously established smFRET signal that reports on intersubunit rotation in which donor (LD550) and acceptor (LD650) fluorophores are site-specifically placed on the N-terminus of ribosomal protein S13 and residue C202 in ribosomal protein L1 within the small and large subunits31,34, respectively (Fig. 2a; Online Methods). As anticipated by the ribosome’s capacity to undergo thermally driven fluctuations in conformation, where the small subunit reversibly rotates by 6–9° with respect to the large14,24,34, PRE complexes spontaneously transitioned between low (0.32 ± 0.06; Online Methods)- and high (0.70 ± 0.06 for initiator; 0.65 ± 0.06 for elongator)-FRET states. The major sub-population transited between low- and high-FRET states on the millisecond time scale (Supplementary Table 1).
Figure 2. Direct visualization of small subunit rotation during the process of translocation.
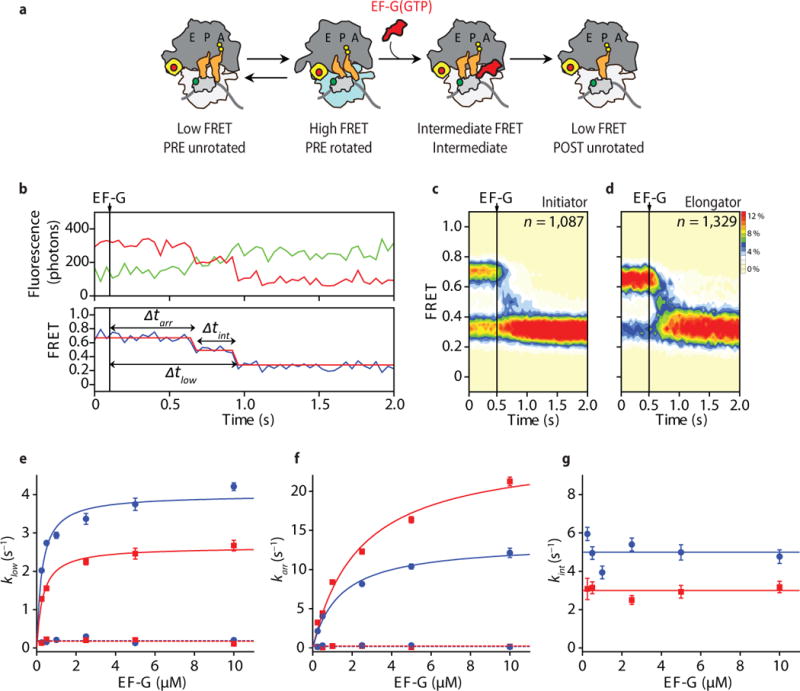
(a) Simplified schematic showing the sites of donor (30S protein S13 – light grey) and acceptor (50S protein L1 – yellow) fluorophores (indicated with green and red circles, respectively) used to image the rotation of the small subunit with respect to the large during translocation. (b) (top) Fluorescence and (bottom) smFRET trajectories of translocating S13-L1-labeled ribosomes. (c, d) Population FRET histograms for (c) initiator and (d) elongator complexes during EF-G(GTP) facilitated translocation. (e–g) Waiting time (indicated in panel b) distributions acquired across a range of EF-G concentrations were fit to double (Δtlow, Δtarr) or single exponentials (Δtint). (e) The rates at which the low-FRET, POST state were achieved. The EF-G concentration dependent component of these data were fit by hyperbolic functions (blue – initiator; red – elongator) with maximum rates of 4.0 ± 0.2 s−1 (initiator) and 2.6 ± 0.1 s−1 (elongator). The EF-G concentration independent rates are represented by dashed lines. (f) Arrival to the intermediate-FRET state. The EF-G concentration-dependent component of these data were fit by hyperbolic functions (blue – initiator; red – elongator) with maximum rates of 13.4 ± 0.6 s−1 (initiator) and 25.3 ± 1.6 s−1 (elongator). The EF-G concentration independent rates are represented by dashed lines. (g) The rates at which intermediate-FRET states resolve to the low-FRET, POST state (5.0 ± 0.7 s−1 – initiator; 3.0 ± 0.3 s−1 – elongator). Error bars represent standard deviations from 3 independent data sets.
On a time-averaged basis, initiator and elongator PRE complexes exhibited approximately 60:40 or 35:65 unrotated (low-FRET) to rotated (high-FRET) ratios, respectively (Supplementary Table 1). Upon stopped-flow delivery of saturating concentrations of EF-G and GTP (10 μM and 1 mM, respectively), individual FRET trajectories (Fig. 2b; Supplementary Fig. 1a, b) and population FRET histograms comprised of translocating molecules (Fig. 2c, d; Online Methods) revealed that both complexes exhibited rapid, irreversible transitions into stable, low-FRET configurations. Notably, this shift preferentially occurred from the high-FRET state, consistent with EF-G(GTP) specifically acting on the rotated ribosome to promote translocation to the unrotated POST state12,34,35.
To estimate the rates of translocation, the delay time between EF-G delivery and the appearance of the stable low-FRET POST configuration was recorded as a function of EF-G concentration (Fig. 2e; Online Methods). In line with previous investigations13,15,33, the distribution of dwell times preceding POST complex formation was characterized by two distinct sub-populations with apparent rates of translocation that differed by approximately an order of magnitude (Fig. 2e; Supplementary Fig. 1c, d). As previously noted12, the rates of faster translocating initiator (~66%) and elongator (~74%) PRE complexes exhibited an EF-G concentration dependence. At saturating concentrations, these sub-populations exhibited maximal rates of 4.0 ± 0.2 s−1 and 2.6 ± 0.1 s−1 for initiator and elongator PRE complexes, respectively (Fig. 2e; Supplementary Table 2; Online Methods). The slower, EF-G concentration-independent sub-populations translocated at rates congruent with the sub-population of ribosomes exhibiting slow rates of subunit rotation (Supplementary Fig. 1d; Supplementary Table 1). These findings corroborate the notion that EF-G(GTP) preferentially acts on the rotated PRE complex, whereas unrotated PRE complexes must spontaneously rotate before translocation can occur.
Translocation occurs via transient intermediates
Further examination of the pre-steady state population FRET histograms and individual FRET trajectories of S13-L1-labeled complexes revealed that translocation proceeds through at least one intermediate state with a mean FRET value of 0.51 ± 0.07 (Fig. 2b–d; Supplementary Fig. 1a, b). These intermediates exhibited an increased distance between S13 and L1 relative to the rotated state (Supplementary Table 3). Consistent with relative fluorescence intensity measurements tracking mRNA and tRNA translocation36,37, the rates entering this state were 13.4 ± 0.6 s−1 and 25.3 ± 1.6 s−1, for initiator and elongator complexes, respectively (Supplementary Table 2; Fig. 2f; Supplementary Fig. 1e). Strikingly, the rates entering the unrotated, POST state from this intermediate configuration were independent of EF-G concentration and comparatively slow (5.0 ± 0.7 s−1 and 3.0 ± 0.3 s−1 for initiator and elongator complexes, respectively) (Supplementary Table 2; Fig. 2g; Supplementary Fig. 1f). These findings suggest that translocation occurs via at least one on-path intermediate configuration (ca. 200–300 ms lifetime), which resolves through intra-molecular processes that are rate-limiting to POST complex formation.
Deacylated and peptidyl-tRNA compact during translocation
In order to gain deeper structural and kinetic insights into this rate-limiting aspect of the translocation mechanism, we monitored a reaction coordinate probing the intermolecular distance between deacylated and peptidyl-tRNAs17,18. Here, initiator PRE complexes contained deacylated tRNAfMet (Cy3-s4U8-tRNAfMet) and fMet-Phe-tRNAPhe (LD650-acp3U47-tRNAPhe) in the P and A sites, respectively, whereas the analogous elongator complexes bore deacylated tRNAPhe (Cy3-s4U8-tRNAPhe) and fMet-Phe-Lys-tRNALys (Cy5-acp3U47-tRNALys) (Fig. 3a). Complexes labeled in this manner are fully competent in both tRNA selection and translocation12,30. As anticipated17, initiator PRE complexes were highly dynamic, exhibiting transitions between three dominant configurations with mean FRET values of 0.66 ± 0.07 (high), 0.40 ± 0.07 (intermediate) and 0.18 ± 0.05 (low) (Fig. 3b; Supplementary Table 4). Elongator PRE complexes were notably less dynamic and predominantly exhibited low-FRET38 (0.33 ± 0.06; Fig. 3c; Supplementary Table 4). Mutational analyses17,35 and structural investigations39,40 define these states as representing classical (A/A, P/P) (high FRET), and two distinct hybrid tRNA configurations: H2 (A/A, P/E – low FRET) and H1 (A/P, P/E – intermediate FRET). Distinctions between inter-subunit rotation and tRNA dynamics within each PRE complex (Figs. 2c, d and Figs. 3b, c) reflect the loosely coupled nature of tRNA motions and subunit rotation18,39.
Figure 3. Direct visualization of tRNA and small subunit head domain movements during the process of translocation.
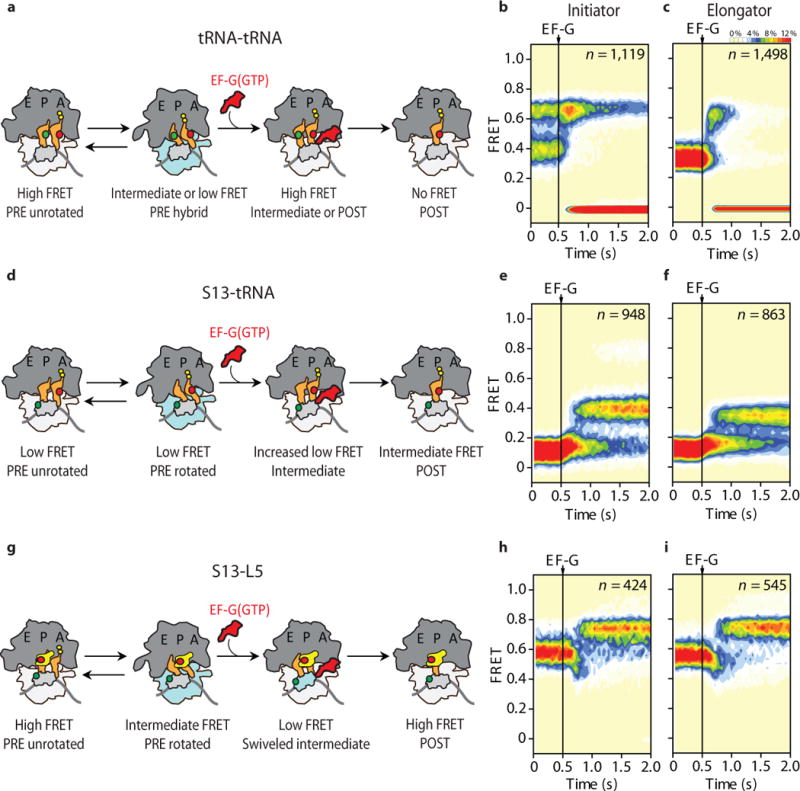
(a) Simplified schematic showing the sites of donor (P-site tRNA) and acceptor (A-site tRNA) labeling (indicated with green and red circles, respectively) used to image tRNA motions with respect to each other during translocation. Population FRET histograms of translocating (b) initiator and (c) elongator complexes during EF-G(GTP) facilitated translocation. (d) Schematic showing the sites of donor (30S protein S13 – light grey) and acceptor (A-site tRNA) labeling (indicated with green and red circles, respectively) used to image peptidyl-tRNA movements relative to the small subunit head domain during translocation. Population FRET histograms of (e) initiator and (f) elongator complexes during EF-G(GTP) facilitated translocation. (g) Schematic showing the sites of donor (30S protein S13 – light grey) and acceptor (50S protein L5 – yellow) labeling (indicated with green and red circles, respectively) used to image movements of the small subunit head domain relative to the large subunit central protuberance during translocation. Population FRET histograms of (h) initiator and (i) elongator complexes during EF-G(GTP) facilitated translocation, where for clarity only those molecules starting in the rotated state are displayed.
Upon stopped-flow addition of saturating concentrations of EF-G(GTP), both complexes displayed a rapid, transient enrichment of high-FRET (0.66 ± 0.07 and 0.61 ± 0.06 for initiator and elongator complexes, respectively), followed by a total loss of FRET (Fig. 3b, c; Supplementary Fig. 2a, b). As the loss of FRET is indicative of translocation-induced deacylated tRNA release, we attribute the enrichment of this high-FRET configuration to compacted tRNA positions associated with either on-path translocation intermediate or POST configurations, rather than a return to classical PRE complex positions.
Comparable to the S13-L1 reaction coordinate, the waiting time distributions for achieving tRNA compaction exhibited bimodal kinetic behaviors, where the faster sub-populations compacted with an EF-G concentration dependence, saturating at 9.2 ± 2.1 s−1 and 14.1 ± 0.7 s−1 for initiator and elongator complexes, respectively (Supplementary Table 2; Supplementary Fig. 2c). By contrast, the rates exiting this state, resulting in the loss of FRET, were independent of EF-G(GTP) concentration, averaging 4.9 ± 1.3 s−1 and 11.3 ± 2.2 s−1, respectively (Supplementary Table 2; Supplementary Fig. 2d). Hence, EF-G’s action on the rotated ribosome rapidly promotes a POST-like conformation in which the distance between ribosomal protein S13 and L1 is increased relative to the rotated state and deacylated and peptidyl-tRNAs adopt compacted intra-subunit hybrid positions.
Deacylated tRNA can release prior to complete translocation
Notably, the rates of deacylated tRNA release from the E site inferred from the loss of FRET suggests that its dissociation from the ribosome occurs independent of POST complex formation (Supplementary Table 2; Supplementary Fig. 2e). For tRNAfMet, the observed rate of release indicates that it occurs concomitant with, or shortly following, the ribosome’s return to its unrotated configuration. By contrast, the rate of tRNAPhe release specifies that it can occur during the delay period required for the intermediate to resolve into the POST state. These findings are consistent with reports that deacylated tRNA dissociates rapidly from the E site of the bacterial ribosome upon translocation41,42 and contrast with the notion that its release requires A-site tRNA binding43,44. Allosteric relationships of this kind have, however, been recently shown for the human ribosome45 suggesting that the determinants of deacylated tRNA release may be complex. We nevertheless conclude that the translocation intermediates observed under the present experimental conditions achieve configurations amenable to spontaneous dissociation of deacylated tRNA from the E site. Steric considerations suggest that such conformations may include swivel or tilt-like motions of the small subunit head domain and/or separation of the L1 stalk from deacylated tRNA.
The observed translocation intermediate exhibits head swivel
To track the position of the small subunit head domain relative to peptidyl-tRNA, we next monitored FRET between donor-labeled (LD550) S13 and acceptor-labeled (LD650 or Cy5) A-site tRNA (Fig. 3d). PRE complexes labeled in this manner exhibited a mean FRET value of 0.10 ± 0.06 and 0.13 ± 0.07 for initiator and elongator complexes, respectively (Fig. 3e, f). Consistent with near-identical distances separating the sites of labeling in both unrotated and rotated states (Supplementary Table 3), FRET dynamics arising from spontaneous conformational changes within the PRE complex were not observed.
Stopped-flow addition of saturating concentrations of EF-G(GTP) led to a rapid increase in the mean FRET values for both complexes (~0.16 FRET), followed by a slower transition into higher-FRET states (0.42 ± 0.06 and 0.34 ± 0.05 for initiator and elongator complexes, respectively) (Fig. 3e, f; Supplementary Fig. 3a, b). Consistent with both the S13-L1 and tRNA-tRNA reaction coordinates, these data indicate that peptidyl-tRNA achieves the POST state by way of a transient configuration in which its elbow domain (the site of labeling) moves towards, but remains distal to, the N-terminus of S13.
While the rates into and out of the transient intermediate (~0.16 FRET) could not be accurately determined, the rates of POST complex formation were readily quantified (3.7 ± 0.2 s−1 and 2.4 ± 0.1 s−1 for initiator and elongator complexes, respectively) (Supplementary Table 2; Supplementary Fig. 3c). This second transition corresponded to the relatively slow process of intermediate resolution into a POST state, in which peptidyl-tRNA resides in the P site and the small subunit adopts an unrotated, unswiveled configuration. Taken together with the analyses discussed above, we surmise from these data that the observed translocation intermediate likely includes a swiveled configuration of the small subunit head domain akin to what was evidenced in the recent EF-G bound, FA-stalled structures21,22.
Head domain motions are rate-limiting to translocation
To directly probe the head domain reaction coordinate during translocation, PRE complexes were prepared in which the N-termini of ribosomal proteins S13 and L5 were site-specifically labeled with donor (LD550) and acceptor (LD650) fluorophores, respectively (Fig. 3g; Online Methods). This FRET pair enabled an assessment of small subunit head domain motions relative to the static, large subunit central protuberance. Consistent with rapid, reversible rotation processes31, S13-L5-labeled initiator and elongator PRE complexes exhibited spontaneous fluctuations between intermediate- and high-FRET states with mean FRET values of 0.56 ± 0.07 and 0.76 ± 0.05, respectively (Supplementary Table 5). Interpreted in the context of prior FRET state assignments31, the aforementioned FRET signals, and previous structural data21,24,25,27,40 (Supplementary Table 3), we infer that such states represent rotated (hybrid) and unrotated (classical) configurations of the PRE complex, respectively.
In line with translocation initiating from the rotated ribosome and proceeding through intermediate configurations that slowly resolve into an unrotated POST state, stopped-flow delivery of EF-G(GTP) efficiently converted rotated PRE complexes (0.56 FRET) to the unrotated (0.76 FRET) POST complex, via at least one lower-FRET (<0.5), intermediate configuration (Fig. 3h, i; Supplementary Fig. 4a, b; Online Methods). These observations are notably consistent with the small subunit head domain adopting a swiveled position en route to complete translocation20–22.
At saturating concentrations of EF-G(GTP), the rates exiting the rotated configuration (0.56 FRET) were rapid (7.5 ± 0.8 s−1 and 11.5 ± 0.8 s−1 for initiator and elongator complexes, respectively; Supplementary Table 2). By contrast, formation of the high-FRET (0.76) POST state occurred relatively slowly (4.2 ± 0.2 s−1 and 2.1 ± 0.1 s−1 for initiator and elongator complexes, respectively) (Supplementary Table 2; Supplementary Fig. 4c). We conclude from these data that the observed intermediate closely resembles the ribosome conformation captured in the presence of FA, where POST-like, intra-subunit hybrid tRNA positions include an 18°–21° swivel of the small subunit head domain in the direction of substrate translocation21,22.
Inhibition of head domain swivel blocks translocation
To further probe the structural determinants of the observed translocation intermediate, experiments were repeated in the presence of distinct, ribosome-targeting antibiotics, specifically focused on the impact of saturating concentrations of hygromycin B (400 μM), viomycin (200 μM) and spectinomycin (3 mM) using elongator complexes. Here, the reported mechanisms of action of each drug anticipate inhibition of early steps in the translocation process that are subsequent to GTP hydrolysis and prior to peptidyl-tRNA movement into the P site12,36,37,46–48. Consistent with this expectation, hygromycin B, which binds within the major groove of helix 44 in the small subunit decoding region to stabilize peptidyl-tRNA binding at the A site37,49, potently inhibited the rate at which the translocation intermediate was formed (Supplementary Fig. 5a). Viomycin, which binds at the apex of helix 69 within the large ribosomal subunit and the minor groove of helix 44 to stabilize peptidyl-tRNA within the A site12,36,46, blocked all evidence of translocation intermediate formation (Supplementary Fig. 5b). Spectinomycin, which binds at the base of helix 34 within the small subunit head domain50, similarly prevented formation of the bona fide translocation intermediate but consistent with prior reports36,50, had the striking effect of stabilizing compacted tRNA positions in the absence of substantial small subunit head swivel (Supplementary Fig. 5c). As both hygromycin and spectinomycin have no significant impact on the rate at which EF-G engages the PRE complex37 and efficiently inhibit reverse subunit rotation15, we conclude that EF-G promotes compacted tRNA positions prior to small subunit head domain swivel. Given that deacylated tRNA movements likely occur in register with the small subunit head domain due to steric constraints imposed by the universally conserved 16S rRNA residues 1338 and 133951, we infer that the observed tRNA movements principally reflect a shift in the peptidyl-tRNA body toward the P site. These data suggest that reverse rotation of the small subunit body and forward head swivel – as observed in structures of the EF-G-bound, FA-stalled PRE complex21,22 – occur through structurally coupled processes after EF-G engages peptidyl-tRNA that together enable movement of the mRNA-(tRNA)2 module into its POST-like configuration.
Fusidic acid inhibits reverse head swivel
To more precisely ascertain the relationship between the EF-G-bound ribosome structures trapped by FA20–22 and the intermediates observed by smFRET, we next examined the impact of FA on the translocation mechanism (Fig. 4). Here, stopped-flow addition of saturating concentrations of EF-G(GTP) and FA (0.4 mM) to S13-L1-labeled elongator complexes resulted in the rapid formation of a long-lived (ca. 20 s) intermediate (Fig. 4a) with a FRET value (0.53 ± 0.06) indistinguishable from that of the transient intermediate observed during uninhibited translocation (Fig. 2c, d). Consistent with it representing an on-path intermediate, the FA-stalled complex was observed to decay slowly (~0.06 s−1) into the POST state. Evidence supporting this interpretation was also drawn from each of the other structural perspectives examined (tRNA-tRNA, S13-tRNA and S13-L5) (Figs. 4b–d).
Figure 4. The antibiotic fusidic acid efficiently stabilizes intermediate states of translocation.
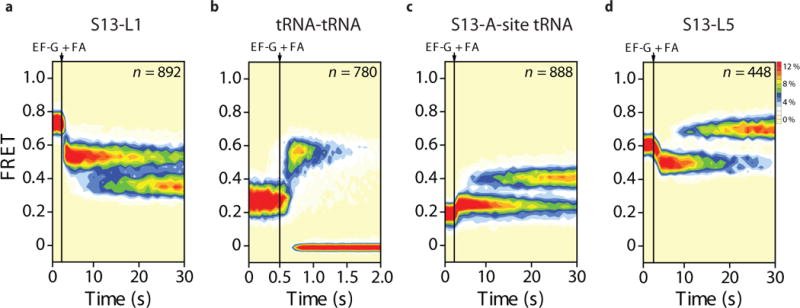
Population FRET histograms showing the response of elongator PRE complexes to the addition of EF-G(GTP) (10 μM; 1 mM) and fusidic acid (FA) (400 μM) when site-specifically labeled as described in Figures 2 and 3 at (a) ribosomal proteins S13 and L1, (b) deacyl- and peptidyl-tRNA, (c) ribosomal protein S13 and peptidyl-tRNA and (d) ribosomal proteins S13 and L5.
Although the rate was substantially reduced by FA (Fig. 4b), deacylated tRNA was again observed to release from the E site more rapidly than intermediate state resolution (~2 s−1 vs. ~0.06 s−1; Figs. 4a, c, d). Hence, analogous to the state captured structurally21,22, we conclude that saturating concentrations of FA efficiently stabilize the elongator complex in a POST-like configuration that exhibits compacted hybrid tRNA positions and increased distances between the N-terminus of S13 and both the L1 and L5 proteins compared to the rotated ribosome. Given that FA occupies the space vacated by inorganic phosphate (Pi) in EF-G (Fig. 1b), we infer that FA binding prevents late remodeling events in the EF-G(GDP)-ribosome complex originating at the interface between domain III and the GTPase domain I. The inhibition of such events prevents the rate-determining, intra-molecular relocking processes that enable reverse head swivel and peptidyl-tRNA capture within the P site.
Translocation intermediates resolve while EF-G is bound
To directly confirm that the observed intermediates and productive translocation occur while EF-G remains bound to the ribosome, we next performed three-color FRET experiments in which the distance between acceptor-labeled (LD650) S13 and donor-labeled (Cy3B) peptidyl-tRNA in the A site was monitored during stopped-flow addition of acceptor-labeled (LD750) EF-G(GTP)12 (Fig. 5a; Online Methods). Consistent with the observed rate of POST-complex formation and the reported rate of EF-G turnover (ca. 1–3 s−1)12,52,53, productive translocation events had a total EF-G residence time of approximately 280 ms (Fig. 5b). Thus, EF-G remains bound to the ribosome throughout the process of forming and resolving the observed translocation intermediate. Confirming this interpretation, the lifetime of the EF-G-bound complex was dramatically extended (ca. 30 s) when analogous experiments were performed in the presence of saturating concentrations of FA (Fig. 5c). We conclude that in the absence of inhibition, EF-G(GDP) leaves the ribosome concomitant with, or immediately subsequent to the reverse swivel of the small subunit head domain that accompanies ribosome relocking.
Figure 5. EF-G resides on the ribosome through the complete process of translocation.
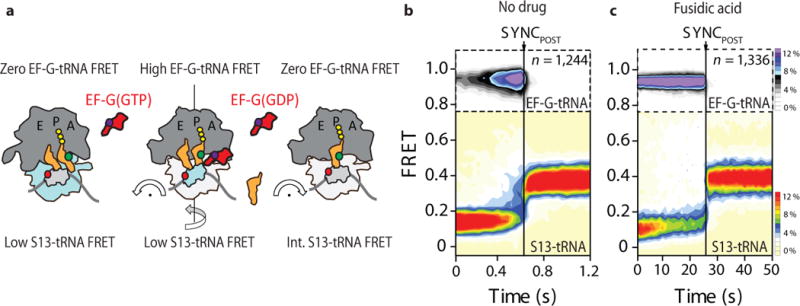
(a) Schematic of the three-color smFRET strategy employed to simultaneously image the timing of EF-G binding to the ribosome and the process of translocation in which the donor (green) fluorophore on A-site tRNA can simultaneously exhibit FRET to acceptor (red)-labeled ribosomal protein S13 (light grey) within the small subunit head domain and acceptor (purple)-labeled EF-G (red). (b,c) Population FRET histograms showing the evolution of FRET between (top panels) EF-G and peptidyl-tRNA and (bottom panels) peptidyl-tRNA and ribosomal protein S13 in which both are post-synchronized to the loss of FRET between EF-G and tRNA in the (b) absence and (c) presence of fusidic acid (400 μM).
Exaggerated head domain motions precede subunit relocking
To further delineate the translocation reaction coordinate, post-synchronized FRET histograms were generated from the individual FRET trajectories for each of the four elongator PRE complexes. In each case, synchronization was set to the final FRET state reached (Supplementary Fig. 6; Fig. 6) to examine each system’s progression into, and out of, intermediate states. This analysis revealed evidence of additional short-lived configurations along the translocation reaction coordinate that had been masked. In particular, the S13-L5-labeled complex showed a transient, exaggerated dip in FRET efficiency (~0.4 FRET) subsequent to achieving the FA-stabilized translocation intermediate (~0.5 FRET) and immediately prior to POST complex formation (Fig. 6). This finding indicates that the N-terminus of S13 exhibits an increased distance with respect to L5 (beyond that observed in the FA-stabilized intermediate) en route to achieving its final POST position.
Figure 6. Post-synchronized population FRET histograms of the translocation reaction coordinate from the perspective of head domain motions.
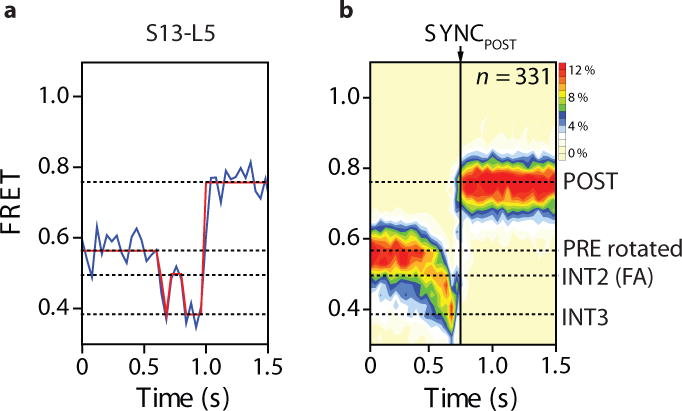
(a) A representative FRET trajectory from the S13-L5 FRET complex (idealization overlaid in red) during translocation is shown, where the dashed lines specify the FRET state assignments. (b) Population FRET histogram showing the response of translocating S13-L5-labeled elongator complexes in response to the addition of EF-G(GTP) (10 μM; 1 mM). Here, the data set was post-synchronized to the final FRET state observed during translocation.
To verify this interpretation, we introduced a fifth structural perspective on the translocation reaction coordinate, which tracked the distance between the S13 N-terminus and the elbow domain of deacylated tRNA (Supplementary Fig. 7a–e). Here, transient dips to lower FRET accompanied deacylated tRNA release from the ribosome. Inspection of individual FRET trajectories from this and the S13-L5 perspective (Fig. 6a; Supplementary Fig. 7f, g) revealed that the rate-determining events leading to the POST state proceed via rapid, reversible fluctuations of the head domain from the FA-stabilized intermediate to positions that move the N-terminus of S13 even more distal to the subunit interface than anticipated by the FA-stalled ribosome structures21,22. Correspondingly, the rate-limiting relocking process that ultimately triggers reverse swivel specifically includes exaggerated movements of the small subunit head domain. Such intra-molecular conformational events, which occur prior to EF-G(GDP) dissociation, enable deacylated tRNA dissociation and resolve the ribosome and peptidyl-tRNA into their POST configurations.
DISCUSSION
Recent structures of the EF-G bound ribosome complex highlight the complex nature of the translocation process by revealing that movements of the mRNA-(tRNA)2 module occur in distinct stages on the small subunit. In the absence of peptidyl-tRNA, EF-G can promote an intra-subunit hybrid tRNA configuration where deacylated tRNA occupies a “POST-like” (pe/E) position. Here, the tRNA’s 5′-CCA-3′ terminus and elbow domain reside within the E site relative to the large and small subunit body domains, while its anticodon remains in a “PRE-like” configuration relative to the small subunit head domain20,23. Within the EF-G-bound PRE complex trapped by fusidic acid (FA), peptidyl-tRNA can also achieve intra-subunit hybrid positions by compacting towards the pe/E tRNA21,22. These previously unanticipated tRNA positions are accompanied by a swivel-like motion of the head domain in the direction of substrate movement, concomitant with reverse rotation of the small subunit body domain along an orthogonal axis. Together, these motions enable EF-G’s tRNA-like, domain IV to establish a network of interactions with the peptidyl-tRNA mRNA codon-anticodon pair as well as the small subunit head and body21,22.
While these FA-stalled structures imply the existence of a potentially critical intermediate during translocation, such conclusions are inconsistent with previous bulk and single-molecule fluorescence data indicating that FA only blocks EF-G release from the ribosome while having no effect on other aspects of the process12,15,26. By tracking the complete translocation reaction coordinate from five perspectives and through three-color imaging, the present investigations provide direct insights into the order and timing of distinct conformational events within the ribosome that had previously been obscured. Taken together with previous literature, these data suggest important clarifications to contemporary translocation models12,36,48 (Fig. 7), including FA’s mechanism of action.
Figure 7. Revised model of the translocation mechanism depicting early and late events in the process.
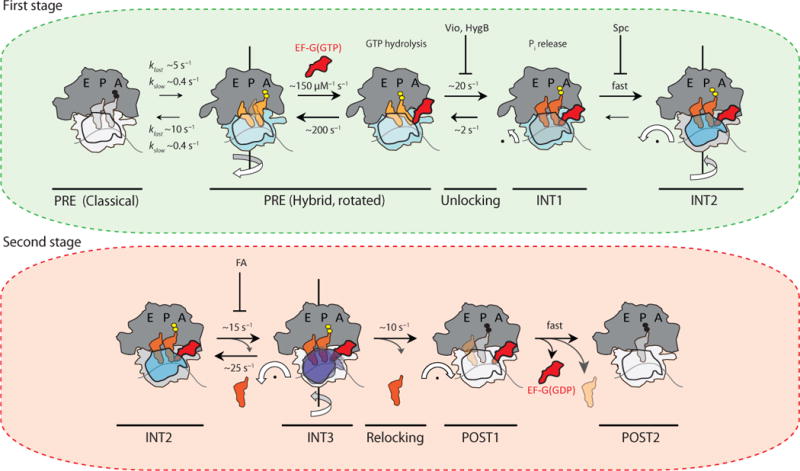
(a) In the first stage of translocation, EF-G(GTP) engages rotated (light blue) configurations of the dynamic PRE complex to stabilize canonical tRNA hybrid (P/E; A/P) positions (light orange). Unrotated (light grey) PRE complexes must spontaneously rotate prior to translocation. GTP hydrolysis and unlocking lead to an intermediate displaying compacted tRNA positions (dark orange) prior to head domain swivel (INT1). These steps are accompanied by inorganic phosphate (Pi) release. INT1 rapidly converts into the relatively stable intermediate (INT2) displaying pronounced (18–21°) head swivel (dark blue) and partial reverse rotation of the small subunit body domain (grey). The inhibitory impacts of viomycin (Vio), hygromycin B (HygB) and spectinomycin (Spc) are indicated in this context, while having little or no effect on Pi release37,48. (b) In the second stage of translocation, exaggerated head domain motions (purple) lead to rapid, reversible excursions of INT2 to a third transient intermediate (INT3). Deacylated tRNA may be released during this exchange. From INT3, the head domain relocks to achieve its unswiveled position (white). In the process mRNA and peptidyl-tRNA are rectified to their POST configurations, followed immediately by EF-G(GDP) release from the ribosome. The rates depicted in this model represent estimates based on the two distinct PRE complexes examined. The values shown for EF-G binding to, and non-productive release from, the PRE complex were taken from ref. 12 and references therein.
In our revised translocation model, the first major set of events (Fig. 7a) are initiated by EF-G(GTP) rapidly and preferentially associating with the rotated PRE complex. This interaction has the net effect of stabilizing deacylated and peptidyl-tRNA in their canonical (H1) hybrid (P/E; A/P) positions54 by specifically depopulating the H2 hybrid state, in which only deacylated tRNA is hybrid (P/E; A/A)17,35. Prior investigations of PRE complexes bearing fluorescently labeled peptidyl-tRNA and ribosomal protein L11 have interpreted this step as EF-G promoting hybrid state formation41,55. While conformational flexibilities in EF-G may allow it to non-productively hydrolyze GTP on unrotated PRE ribosomes56,57, events of this kind are not observed to have any impact on the complex, indicating that EF-G is unable to appropriately engage peptidyl-tRNA on the unrotated ribosome. In this view, the spontaneous unrotated-to-rotated exchange prior to EF-G binding is a critical component of the global translocation rate12,35.
Subsequent to GTP hydrolysis and H1 hybrid state stabilization, the PRE complex then rapidly converts (ca. 20 s−1) into an intermediate configuration (INT1) that can be stabilized by spectinomycin (Supplementary Fig. 5c)36, in which tRNA compaction has occurred in the absence of substantial head domain swivel. By inference from prior studies, this step likely occurs in parallel with Pi release37,48 and prior to reverse rotation of the small subunit body15. INT1 then rapidly (ca. >50 s−1) converts into a second, relatively stable intermediate (INT2) that closely resembles the PRE complex trapped by FA21,22 (Fig. 4). Thus, in addition to compacted tRNAs, the INT2 complex exhibits a pronounced degree of head swivel (~18–21°) and partial reverse rotation of the small subunit body domain.
Interpreted in the context of relative fluorescence investigations tracking labeled mRNA and tRNA, these early translocation events likely constitute the process of “unlocking”9,48 as INT2 represents a POST-like configuration of the mRNA-(tRNA)2 module that is achieved immediately subsequent to unlocking, and in parallel with Pi release21,22,37,48. In the presence of saturating concentrations of FA, INT2 is efficiently stabilized by FA binding to the area vacated by Pi within the unlocked, EF-G(GDP)-bound ribosome, which becomes available during, or immediately subsequent to INT2 formation28. Although the INT2 complex is only partially translocated (discussed further below), fluorescence intensity changes in mRNA and/or peptidyl-tRNA identify the mRNA-(tRNA)2 module as being fully translocated12,15,26.
The second major set of events in the translocation mechanism revealed by the present investigations relates to the process of “relocking”. In these steps the true POST complex is formed, wherein reverse head swivel and reverse subunit rotation have occurred and peptidyl-tRNA has been captured within the P site (Fig. 7b). Relocking proceeds through a multistep mechanism that includes fast, reversible fluctuations of the small subunit head domain, which result in transient excursions to a third intermediate (INT3) that has previously escaped detection (Fig. 6b; Supplementary Fig. 7). The total duration of the relocking process, estimated by the residence time of EF-G on the ribosome (~280 ms) (Fig. 5), specifies that frustrated attempts at INT2 resolution are rate-limiting to ribosome relocking and thus complete translocation. Taken together with previous data3,58, the reversible nature of the INT2-INT3 exchange, as well as the temporal separation of these structural processes from both GTP hydrolysis and Pi release, suggests that rectification of the ribosome to the POST state proceeds via a Brownian ratchet rather than a power stroke mechanism.
Previous studies have noted a molecular restriction in the ribosome, including residues G1338 and A1339 within the small subunit head domain and the 790 loop in the small subunit body domain, which potentially impedes deacylated tRNA passage from the P site to the E site51. However, the specific motions taking place during relocking, which simultaneously increase the distance between the N-termini of S13 and L5, as well as between S13 and deacylated tRNA (Supplementary Fig. 7), allow deacylated tRNA release from the E site prior to complete translocation (Fig. 4). While the timing of its release may be particular to distinct tRNA species or PRE complexes, we conclude that deacylated tRNA’s clearance of this barrier may be necessary but not sufficient for INT3’s resolution to the POST state (POST1).
Fluctuations between INT2 and INT3, which can persist in the absence of deacylated tRNA, represent the final steps needed to properly place peptidyl-tRNA in the P site. We speculate than such motions reflect exaggerations of the ratchet-like movements of the body and head domain that accompany INT2 formation. Distinct movements, including head domain tilting away from the subunit interface associated with trans-translation59 or more complex, mixed movements along multiple axes, cannot, however, be ruled out. Regardless of their specific nature, we posit that these spontaneous events within the EF-G(GDP)-bound ribosome reposition the peptidyl-tRNA anticodon with respect to the small subunit22,27 so as to fully engage the small subunit P site. Such processes may be facilitated by conformational rearrangements in EF-G and domain IV contacts with peptidyl-tRNA and the small subunit. Here, EF-G would serve as a pawl by preventing the non-productive decay of INT2 while facilitating relocking and reverse head swivel to reestablish contacts between peptidyl-tRNA and residues G1338 and A1339. As EF-G(GDP) has low affinity for the unrotated ribosome, EF-G(GDP) then rapidly releases from the ribosome (POST2).
In this model, the rate-determining features of the translocation reaction coordinate are controlled by intra-molecular events within the EF-G(GDP)-bound ribosome. This view specifies that ribosome complexes achieved during processive translation, which harbor distinct tRNA species, nascent peptides and mRNAs of unique sequence and secondary structure, may give rise to substantially altered, non-uniform translation rates. Intrinsic dynamics within the ribosome also bear relevance to programmed changes in the translation reading frame5, which may be more likely to occur after deacylated tRNA release from the E site60 and exacerbated by ribosome interactions with structured mRNA elements52. Such insights warrant high-resolution structural investigations of specific ribosome complexes associated with aberrant translation as well as fast time resolution and multi-color single-molecule investigations employed in combination with quantitative molecular dynamics simulations.
Online Methods
Reagents
Fusidic acid sodium salt (Sigma-Aldrich), spectinomycin sulfate (MP Biomedicals), viomycin sulfate (USP) and hygromycin B (Sigma-Aldrich) were used at the purity stated by the commercial suppliers (≥97 %). Guanosine triphosphate (GTP), guanosine diphosphate (GDP) and GDPNP were purchased from Sigma, and GTP was further purified on a Mono Q 5/50 GL ion exchange column (GE Healthcare Life Sciences).
Preparation of fluorescently labeled ribosomes, EF-G and tRNAs
Native 30S subunits enzymatically labeled on S13 (N-Sfp) with LD550 (Lumidyne Technologies) and 50S subunits labeled with LD650 on L1 (T202C) or L5 (N-Acp) were prepared and purified as previously described31,34,61. EF-G was enzymatically labeled (C-Sfp) with LD750 (Lumidyne Technologies) as previously described12. Cy3- and Cy5-fMet-tRNAfMet (s4U8), Cy3-Phe-tRNAPhe(s4U8), Cy3B- and LD650-Phe-tRNAPhe(acp3U47) were purified35 and labeled17 as previously described. tRNALys was purchased (Sigma), purified by hydrophobic chromatography and labeled with Cy3B and Cy5 (acp3U47) as previously described38.
Preparation of pre-translocation ribosome complexes
For all labeling strategies presented, initiator pre-translocation complexes (P-site tRNAfMet; A-site fMet-Phe-tRNAPhe) were prepared as previously described17. Elongator pre-translocation complexes (P-site tRNAPhe; A-site fMet-Phe-Lys-tRNALys) were prepared by incubating surface-immobilized initiator complexes (P-site fMet-tRNAfMet) with EF-G(GTP) (10 μM; 1 mM) and 12 nM EF-Tu(GTP)-Phe-tRNAPhe ternary complex for 5 minutes (forming the POST initiator complex). The A site was then enzymatically filled with tRNALys as previously described38.
Acquisition and analysis of smFRET data
Single-molecule fluorescence imaging was performed at 25° C using a prism-based total internal reflection fluorescence microscope45. Site-specifically labeled ribosome complexes programmed with 5′-biotinylated mRNA substrates were surface-immobilized within polyethylene glycol-passivated, streptavidin-coated quartz microfluidic chambers17. All experiments were conducted in Tris Polymix Buffer (50 mM Tris-OAc pH 7.5, 100 mM KCl, 5 mM NH4OAc, 0.5 mM Ca(OAc)2, 0.1 mM EDTA, 5 mM putrescine, 1 mM spermidine and 1.5 mM BME) with 5 mM Mg(OAc)2, a cocktail of triplet state quenchers62 (1 mM Trolox, 1 mM nitrobenzyl alcohol and 1 mM cyclooctatetraene) and an enzymatic oxygen scavenging system63.
smFRET data were acquired by directly exciting donor fluorophores (LD550, Cy3 or Cy3B) with a 532 nm solid-state laser (LaserQuantum), while fluorescence emission from the donor and acceptor(s) (Cy5 or LD650 and LD750 for 3-color experiments) was collected using a 60×, 1.27 N.A. Plan-Apo water immersion objective (Nikon), spectrally separated using a MultiCam LS device (Cairn) equipped with T635lpxr-UF2 and 740dcxr dichroic mirrors (Chroma) and imaged onto ORCA-Flash 4.0 v2 sCMOS cameras (Hamamatsu)45. Data were acquired at 40- or 1-s (fusidic acid) time resolution using custom software implemented in LabView (National Instruments)45. Using this approach, fluorescence and FRET trajectories could be obtained from hundreds of surface-immobilized, fluorescently labeled ribosome complexes simultaneously, where an average of 500 photons were collected for each ribosome complex per image frame. Individual ribosome complexes were imaged prior to, during and after stopped-flow injection of EF-G. The translocation of each complex was monitored at various EF-G concentrations, and recorded single-molecule fluorescence and FRET trajectories were extracted using custom made MATLAB (MathWorks) software. Time-dependent donor and acceptor fluorescence intensities from individual ribosome complexes were transformed into FRET efficiency using the relationship, FRET = Iacceptor/(Idonor + Iacceptor). Traces were selected for analysis using the following criteria: a single catastrophic photobleaching event, at least 8:1 signal-to-background-noise ratio and 6:1 signal-to-signal-noise ratio, less than four donor fluorophore blinking events, a correlation coefficient between donor and acceptor <0.5 and a lifetime of at least 50 frames (2s) in any FRET state ≥0.15. Reported FRET efficiency errors were obtained from the standard deviation of normal distribution fits of compiled FRET histograms.
Individual FRET traces were analyzed using hidden Markov modeling (HMM)-based idealization methods using the QuB software package, where kinetic analyses were conducted through idealization to specific models using the segmental k-means algorithm in QuB17. In each model, transitions between all FRET states (including a photobleached or blinking state) were allowed. For the S13-L1 analysis, a two-state model with FRET values were 0.32 and 0.67 was used to determine the rates of intersubunit rotation and equilibrium populations in the pre-translocation complex. For the tRNA-tRNA analysis, a three-state model was used for the initiator complex, with FRET values of 0.18, 0.40 and 0.66. The elongator complex, which did not show intermediate-FRET dwells, was idealized using a two-state model with FRET values of 0.33 and 0.61.
For the S13-A-site tRNA initiator complex analysis, a two-state model was used with FRET values of 0.10 and 0.42. For elongator complexes, a two-state model was used with FRET values of 0.13 and 0.34. For the S13-L5 analysis, a two-state model was used with FRET values of 0.56 and 0.76. For clarity in the translocation example traces, two states were added (exaggerated dip – 0.385, FA-stalled intermediate – 0.50). For the S13-P-site tRNA complexes, separate three-state models were used for initiator and elongator complexes due to the different site of P-site tRNA labeling. For initiator, the FRET values were 0.40, 0.50 and 0.59; for elongator the FRET values were 0.55, 0.64 and 0.80.
Translocating traces were selected based on their idealizations according to criteria specific to each FRET signal. For the S13-L1 labeled complexes, translocating molecules were defined as traces displaying transition from the high-FRET state to a stable (1 s or larger dwell time) low-FRET (POST) state (Supplementary Fig. 1a, b). For the tRNA-tRNA labeled complexes, translocating traces were selected based on donor intensity loss prior to acceptor intensity loss (corresponding to labeled E-site tRNA loss) as well as high-FRET (intermediate or POST) state occupation prior to FRET loss (Supplementary Fig. 2a, b). For the S13-A-site-tRNA labeled complexes, translocating traces were selected based on FRET shift from the low-FRET state to the stable (1s or longer dwell times) intermediate-FRET (POST) state (Supplementary Fig. 3a, b). For the S13-L5 labeled complexes, translocating traces were selected based on FRET transition from the intermediate-FRET state to the stable (1s or longer dwell times) high-FRET (POST) state (Supplementary Fig. 4a, b). The resulting times were compiled into histograms, transformed to cumulative distributions and fit to exponential functions in Origin (OriginLab). The rates are presented as mean ± standard error determined from three independent data sets.
Monitoring FRET between EF-G and the ribosome
To simultaneously monitor the translocation reaction coordinate and EF-G engagement with the A site, 600 nM LD750-labeled EF-G(GTP) was stopped-flow delivered to surface-immobilized PRE complexes containing LD650-labeled S13 and deacylated tRNAPhe in the P site and Cy3B-labeled fMet-Phe-Lys-tRNALys (acp3U47) in the A site. S13-tRNA FRET and EF-G-tRNA FRET were calculated as follows, assuming no acceptor (LD650) to acceptor (LD750) FRET: S13-tRNA FRET = ILD650/(ICy3B + ILD650); EF-G-tRNA FRET = ILD750/(ICy3B + ILD750).
Kinetic model rates
Rate constants were derived on the basis of the model in Figure 7 employing the rates obtained from the various translocation signals. All rates were derived from elongator complexes imaged in the presence of saturating concentrations of EF-G. The rates of the EF-G-bound state (G) to tRNA compacted state (INT2) transition were derived from the tRNA-tRNA signal. The rate of reversible high-FRET state arrival (Supplementary Fig. 2b) provided the forward rate constant kG→INT2 = 18.3 ± 1.3 s−1, while the rate kINT2→G was approximated by the rate of reversal from the high-FRET state, 1.6 ± 0.3 s−1. The rate of POST formation following INT3 was obtained using the S13-L5 signal – the average time between the low-FRET (INT3) state arrival and the stable high-FRET (POST) state arrival (Fig. 6, kINT3→POSTnet = 11.0 ± 0.4 s−1). As this rate was calculated for selected traces with long final dwells in the POST state, it constitutes a net forward rate between these two states. The reverse (POST→INT3) rate, dictated by transitions from the S13-L5 high-FRET state to the low-FRET state, was very small and estimated to be 0.06 ± 0.01 s−1 by maximum point likelihood optimization (QuB). In order to calculate the rates determining the INT2↔INT3 transitions, we first note that kG→POSTnet = [(kG→INT2net)−1 + (kINT2→INT3net)−1 + (kINT3→POSTnet)−1]−1 and kG→INT2net = kG→INT2 * kINT2→INT3net/(kINT2→INT3net + kINT2→G). Combining these two equations, and noting that krelocking = kG→POSTnet = 2.4 ± 0.3 s−1 (based on the three independent signals of elongator complex POST formation, see Fig. 2e and Supplementary Figs. 3c, 4c), we obtain kINT2→INT3net = [(kINT2→G/kG→INT2) + 1]/[ (kG→POSTnet)−1 – (kG→INT2)−1 – (kINT3→POSTnet)−1] ≅ 4 s−1. Having the net rate that characterizes the relocking intermediate (INT2→INT3), we sought to obtain the forward and reverse rates of the process. An estimate for the forward rate was obtained from the distribution of the transition times from the rotated, hybrid (intermediate-FRET, 0.56) state of the S13-L5 signal to the INT3 (low-FRET, ~0.4) state (Fig. 3i; Fig. 6) with an average rate of kG→INT3 = 7.1 ± 0.3 s−1, consistent with kINT2→INT3 ≅ 13 s−1. With the forward and net rates, the reverse rate was obtained as kINT3→INT2 = kINT3→POSTnet [(kINT2→INT3/kINT2→INT3net) – 1] ≅ 24 s−1.
Supplementary Material
Acknowledgments
We thank R. Green (Johns Hopkins University) for providing the S13 knockout strain and P. Schultz (Scripps Research Institute) for providing the L5 knockout strain. We also thank D. Terry of the Blanchard laboratory for his assistance with the 3-color FRET data acquisition and analysis. This work was supported by the US National Institutes of Health (2R01GM079238 and R01GM098859 to S.C.B.).
Footnotes
AUTHOR CONTRIBUTIONS
M.R.W. prepared dye-labeled ribosomes and EF-G. R.B.A. and M.R.W. prepared dye-labeled tRNAs. J.L.A. and M.R.W. performed the smFRET imaging. J.L.A. analyzed the smFRET results. J.L.A. and M.R.W. made the figures. S.C.B., M.R.W. and J.L.A. designed the study. All authors discussed the results and contributed to the writing of the manuscript.
COMPETING FINANCIAL INTERESTS
SCB and RBA have an equity interest in Lumidyne Technologies.
References
- 1.Agirrezabala X, Frank J. Elongation in translation as a dynamic interaction among the ribosome, tRNA, and elongation factors EF-G and EF-Tu. Q Rev Biophys. 2009;42:159–200. doi: 10.1017/S0033583509990060. [DOI] [PMC free article] [PubMed] [Google Scholar]
- 2.Holtkamp W, Wintermeyer W, Rodnina MV. Synchronous tRNA movements during translocation on the ribosome are orchestrated by elongation factor G and GTP hydrolysis. Bioessays. 2014;36:908–18. doi: 10.1002/bies.201400076. [DOI] [PubMed] [Google Scholar]
- 3.Moore PB. How should we think about the ribosome? Annu Rev Biophys. 2012;41:1–19. doi: 10.1146/annurev-biophys-050511-102314. [DOI] [PubMed] [Google Scholar]
- 4.Voorhees RM, Ramakrishnan V. Structural basis of the translational elongation cycle. Annu Rev Biochem. 2013;82:203–36. doi: 10.1146/annurev-biochem-113009-092313. [DOI] [PubMed] [Google Scholar]
- 5.Dinman JD. Mechanisms and implications of programmed translational frameshifting. Wiley Interdiscip Rev RNA. 2012;3:661–73. doi: 10.1002/wrna.1126. [DOI] [PMC free article] [PubMed] [Google Scholar]
- 6.Munro JB, Sanbonmatsu KY, Spahn CM, Blanchard SC. Navigating the ribosome’s metastable energy landscape. Trends Biochem Sci. 2009;34:390–400. doi: 10.1016/j.tibs.2009.04.004. [DOI] [PMC free article] [PubMed] [Google Scholar]
- 7.Shoji S, Walker SE, Fredrick K. Ribosomal translocation: one step closer to the molecular mechanism. ACS Chem Biol. 2009;4:93–107. doi: 10.1021/cb8002946. [DOI] [PMC free article] [PubMed] [Google Scholar]
- 8.Chen J, Tsai A, O’Leary SE, Petrov A, Puglisi JD. Unraveling the dynamics of ribosome translocation. Curr Opin Struct Biol. 2012;22:804–14. doi: 10.1016/j.sbi.2012.09.004. [DOI] [PMC free article] [PubMed] [Google Scholar]
- 9.Spirin AS. On the mechanism of ribosome function. The hypothesis of locking-unlocking of subparticles. Dokl Akad Nauk SSSR. 1968;179:1467–70. [PubMed] [Google Scholar]
- 10.Peske F, Matassova NB, Savelsbergh A, Rodnina MV, Wintermeyer W. Conformationally restricted elongation factor G retains GTPase activity but is inactive in translocation on the ribosome. Mol Cell. 2000;6:501–5. doi: 10.1016/s1097-2765(00)00049-6. [DOI] [PubMed] [Google Scholar]
- 11.Horan LH, Noller HF. Intersubunit movement is required for ribosomal translocation. Proc Natl Acad Sci U S A. 2007;104:4881–5. doi: 10.1073/pnas.0700762104. [DOI] [PMC free article] [PubMed] [Google Scholar]
- 12.Munro JB, Wasserman MR, Altman RB, Wang L, Blanchard SC. Correlated conformational events in EF-G and the ribosome regulate translocation. Nat Struct Mol Biol. 2010;17:1470–7. doi: 10.1038/nsmb.1925. [DOI] [PMC free article] [PubMed] [Google Scholar]
- 13.Guo Z, Noller HF. Rotation of the head of the 30S ribosomal subunit during mRNA translocation. Proc Natl Acad Sci U S A. 2012;109:20391–4. doi: 10.1073/pnas.1218999109. [DOI] [PMC free article] [PubMed] [Google Scholar]
- 14.Cornish PV, Ermolenko DN, Noller HF, Ha T. Spontaneous intersubunit rotation in single ribosomes. Mol Cell. 2008;30:578–88. doi: 10.1016/j.molcel.2008.05.004. [DOI] [PMC free article] [PubMed] [Google Scholar]
- 15.Ermolenko DN, Noller HF. mRNA translocation occurs during the second step of ribosomal intersubunit rotation. Nat Struct Mol Biol. 2011;18:457–62. doi: 10.1038/nsmb.2011. [DOI] [PMC free article] [PubMed] [Google Scholar]
- 16.Ermolenko DN, et al. Observation of intersubunit movement of the ribosome in solution using FRET. J Mol Biol. 2007;370:530–40. doi: 10.1016/j.jmb.2007.04.042. [DOI] [PubMed] [Google Scholar]
- 17.Munro JB, Altman RB, O’Connor N, Blanchard SC. Identification of two distinct hybrid state intermediates on the ribosome. Mol Cell. 2007;25:505–17. doi: 10.1016/j.molcel.2007.01.022. [DOI] [PMC free article] [PubMed] [Google Scholar]
- 18.Munro JB, et al. Spontaneous formation of the unlocked state of the ribosome is a multistep process. Proc Natl Acad Sci U S A. 2010;107:709–14. doi: 10.1073/pnas.0908597107. [DOI] [PMC free article] [PubMed] [Google Scholar]
- 19.Fei J, Kosuri P, MacDougall DD, Gonzalez RL., Jr Coupling of ribosomal L1 stalk and tRNA dynamics during translation elongation. Mol Cell. 2008;30:348–59. doi: 10.1016/j.molcel.2008.03.012. [DOI] [PubMed] [Google Scholar]
- 20.Ratje AH, et al. Head swivel on the ribosome facilitates translocation by means of intra-subunit tRNA hybrid sites. Nature. 2010;468:713–6. doi: 10.1038/nature09547. [DOI] [PMC free article] [PubMed] [Google Scholar]
- 21.Ramrath DJ, et al. Visualization of two transfer RNAs trapped in transit during elongation factor G-mediated translocation. Proc Natl Acad Sci U S A. 2013;110:20964–9. doi: 10.1073/pnas.1320387110. [DOI] [PMC free article] [PubMed] [Google Scholar]
- 22.Zhou J, Lancaster L, Donohue JP, Noller HF. How the ribosome hands the A-site tRNA to the P site during EF-G-catalyzed translocation. Science. 2014;345:1188–91. doi: 10.1126/science.1255030. [DOI] [PMC free article] [PubMed] [Google Scholar]
- 23.Zhou J, Lancaster L, Donohue JP, Noller HF. Crystal structures of EF-G-ribosome complexes trapped in intermediate states of translocation. Science. 2013;340:1236086. doi: 10.1126/science.1236086. [DOI] [PMC free article] [PubMed] [Google Scholar]
- 24.Dunkle JA, et al. Structures of the bacterial ribosome in classical and hybrid states of tRNA binding. Science. 2011;332:981–4. doi: 10.1126/science.1202692. [DOI] [PMC free article] [PubMed] [Google Scholar]
- 25.Brilot AF, Korostelev AA, Ermolenko DN, Grigorieff N. Structure of the ribosome with elongation factor G trapped in the pretranslocation state. Proc Natl Acad Sci U S A. 2013;110:20994–9. doi: 10.1073/pnas.1311423110. [DOI] [PMC free article] [PubMed] [Google Scholar]
- 26.Savelsbergh A, Rodnina MV, Wintermeyer W. Distinct functions of elongation factor G in ribosome recycling and translocation. RNA. 2009;15:772–80. doi: 10.1261/rna.1592509. [DOI] [PMC free article] [PubMed] [Google Scholar]
- 27.Gao YG, et al. The structure of the ribosome with elongation factor G trapped in the posttranslocational state. Science. 2009;326:694–9. doi: 10.1126/science.1179709. [DOI] [PMC free article] [PubMed] [Google Scholar]
- 28.Borg A, et al. Fusidic acid targets elongation factor G in several stages of translocation on the bacterial ribosome. J Biol Chem. 2015;290:3440–54. doi: 10.1074/jbc.M114.611608. [DOI] [PMC free article] [PubMed] [Google Scholar]
- 29.Khade PK, Joseph S. Messenger RNA interactions in the decoding center control the rate of translocation. Nat Struct Mol Biol. 2011;18:1300–2. doi: 10.1038/nsmb.2140. [DOI] [PMC free article] [PubMed] [Google Scholar]
- 30.Geggier P, et al. Conformational sampling of aminoacyl-tRNA during selection on the bacterial ribosome. J Mol Biol. 2010;399:576–95. doi: 10.1016/j.jmb.2010.04.038. [DOI] [PMC free article] [PubMed] [Google Scholar]
- 31.Wasserman MR, et al. Chemically related 4,5-linked aminoglycoside antibiotics drive subunit rotation in opposite directions. Nat Commun. 2015;6:7896. doi: 10.1038/ncomms8896. [DOI] [PMC free article] [PubMed] [Google Scholar]
- 32.Altman RB, et al. Enhanced photostability of cyanine fluorophores across the visible spectrum. Nat Methods. 2012;9:428–9. doi: 10.1038/nmeth.1988. [DOI] [PMC free article] [PubMed] [Google Scholar]
- 33.Studer SM, Feinberg JS, Joseph S. Rapid kinetic analysis of EF-G-dependent mRNA translocation in the ribosome. J Mol Biol. 2003;327:369–81. doi: 10.1016/s0022-2836(03)00146-3. [DOI] [PubMed] [Google Scholar]
- 34.Wang L, et al. Allosteric control of the ribosome by small-molecule antibiotics. Nat Struct Mol Biol. 2012;19:957–63. doi: 10.1038/nsmb.2360. [DOI] [PMC free article] [PubMed] [Google Scholar]
- 35.Wang L, Altman RB, Blanchard SC. Insights into the molecular determinants of EF-G catalyzed translocation. RNA. 2011;17:2189–200. doi: 10.1261/rna.029033.111. [DOI] [PMC free article] [PubMed] [Google Scholar]
- 36.Pan D, Kirillov SV, Cooperman BS. Kinetically competent intermediates in the translocation step of protein synthesis. Mol Cell. 2007;25:519–29. doi: 10.1016/j.molcel.2007.01.014. [DOI] [PMC free article] [PubMed] [Google Scholar]
- 37.Peske F, Savelsbergh A, Katunin VI, Rodnina MV, Wintermeyer W. Conformational changes of the small ribosomal subunit during elongation factor G-dependent tRNA-mRNA translocation. J Mol Biol. 2004;343:1183–94. doi: 10.1016/j.jmb.2004.08.097. [DOI] [PubMed] [Google Scholar]
- 38.Feldman MB, Terry DS, Altman RB, Blanchard SC. Aminoglycoside activity observed on single pre-translocation ribosome complexes. Nat Chem Biol. 2010;6:54–62. doi: 10.1038/nchembio.274. [DOI] [PMC free article] [PubMed] [Google Scholar]
- 39.Fischer N, Konevega AL, Wintermeyer W, Rodnina MV, Stark H. Ribosome dynamics and tRNA movement by time-resolved electron cryomicroscopy. Nature. 2010;466:329–33. doi: 10.1038/nature09206. [DOI] [PubMed] [Google Scholar]
- 40.Agirrezabala X, et al. Structural characterization of mRNA-tRNA translocation intermediates. Proc Natl Acad Sci U S A. 2012;109:6094–9. doi: 10.1073/pnas.1201288109. [DOI] [PMC free article] [PubMed] [Google Scholar]
- 41.Adio S, et al. Fluctuations between multiple EF-G-induced chimeric tRNA states during translocation on the ribosome. Nat Commun. 2015;6:7442. doi: 10.1038/ncomms8442. [DOI] [PMC free article] [PubMed] [Google Scholar]
- 42.Chen J, Petrov A, Tsai A, O’Leary SE, Puglisi JD. Coordinated conformational and compositional dynamics drive ribosome translocation. Nat Struct Mol Biol. 2013;20:718–27. doi: 10.1038/nsmb.2567. [DOI] [PMC free article] [PubMed] [Google Scholar]
- 43.Chen C, et al. Allosteric vs. spontaneous exit-site (E-site) tRNA dissociation early in protein synthesis. Proc Natl Acad Sci U S A. 2011;108:16980–5. doi: 10.1073/pnas.1106999108. [DOI] [PMC free article] [PubMed] [Google Scholar]
- 44.Wilson DN, Nierhaus KH. The E-site story: the importance of maintaining two tRNAs on the ribosome during protein synthesis. Cell Mol Life Sci. 2006;63:2725–37. doi: 10.1007/s00018-006-6125-4. [DOI] [PMC free article] [PubMed] [Google Scholar]
- 45.Ferguson A, et al. Functional Dynamics within the Human Ribosome Regulate the Rate of Active Protein Synthesis. Mol Cell. 2015;60:475–86. doi: 10.1016/j.molcel.2015.09.013. [DOI] [PMC free article] [PubMed] [Google Scholar]
- 46.Ermolenko DN, et al. The antibiotic viomycin traps the ribosome in an intermediate state of translocation. Nat Struct Mol Biol. 2007;14:493–7. doi: 10.1038/nsmb1243. [DOI] [PubMed] [Google Scholar]
- 47.Rodnina MV, Savelsbergh A, Katunin VI, Wintermeyer W. Hydrolysis of GTP by elongation factor G drives tRNA movement on the ribosome. Nature. 1997;385:37–41. doi: 10.1038/385037a0. [DOI] [PubMed] [Google Scholar]
- 48.Savelsbergh A, et al. An elongation factor G-induced ribosome rearrangement precedes tRNA-mRNA translocation. Mol Cell. 2003;11:1517–23. doi: 10.1016/s1097-2765(03)00230-2. [DOI] [PubMed] [Google Scholar]
- 49.Borovinskaya MA, Shoji S, Fredrick K, Cate JH. Structural basis for hygromycin B inhibition of protein biosynthesis. RNA. 2008;14:1590–9. doi: 10.1261/rna.1076908. [DOI] [PMC free article] [PubMed] [Google Scholar]
- 50.Borovinskaya MA, Shoji S, Holton JM, Fredrick K, Cate JH. A steric block in translation caused by the antibiotic spectinomycin. ACS Chem Biol. 2007;2:545–52. doi: 10.1021/cb700100n. [DOI] [PMC free article] [PubMed] [Google Scholar]
- 51.Schuwirth BS, et al. Structures of the bacterial ribosome at 3.5 A resolution. Science. 2005;310:827–34. doi: 10.1126/science.1117230. [DOI] [PubMed] [Google Scholar]
- 52.Caliskan N, Katunin VI, Belardinelli R, Peske F, Rodnina MV. Programmed -1 frameshifting by kinetic partitioning during impeded translocation. Cell. 2014;157:1619–31. doi: 10.1016/j.cell.2014.04.041. [DOI] [PMC free article] [PubMed] [Google Scholar]
- 53.Katunin VI, Savelsbergh A, Rodnina MV, Wintermeyer W. Coupling of GTP hydrolysis by elongation factor G to translocation and factor recycling on the ribosome. Biochemistry. 2002;41:12806–12. doi: 10.1021/bi0264871. [DOI] [PubMed] [Google Scholar]
- 54.Moazed D, Noller HF. Intermediate states in the movement of transfer RNA in the ribosome. Nature. 1989;342:142–8. doi: 10.1038/342142a0. [DOI] [PubMed] [Google Scholar]
- 55.Chen C, et al. Single-molecule fluorescence measurements of ribosomal translocation dynamics. Mol Cell. 2011;42:367–77. doi: 10.1016/j.molcel.2011.03.024. [DOI] [PMC free article] [PubMed] [Google Scholar]
- 56.Walker SE, Shoji S, Pan D, Cooperman BS, Fredrick K. Role of hybrid tRNA-binding states in ribosomal translocation. Proc Natl Acad Sci U S A. 2008;105:9192–7. doi: 10.1073/pnas.0710146105. [DOI] [PMC free article] [PubMed] [Google Scholar]
- 57.Lin J, Gagnon MG, Bulkley D, Steitz TA. Conformational changes of elongation factor G on the ribosome during tRNA translocation. Cell. 2015;160:219–27. doi: 10.1016/j.cell.2014.11.049. [DOI] [PMC free article] [PubMed] [Google Scholar]
- 58.Liu T, et al. Direct measurement of the mechanical work during translocation by the ribosome. Elife. 2014;3:e03406. doi: 10.7554/eLife.03406. [DOI] [PMC free article] [PubMed] [Google Scholar]
- 59.Ramrath DJ, et al. The complex of tmRNA-SmpB and EF-G on translocating ribosomes. Nature. 2012;485:526–9. doi: 10.1038/nature11006. [DOI] [PubMed] [Google Scholar]
- 60.Marquez V, Wilson DN, Tate WP, Triana-Alonso F, Nierhaus KH. Maintaining the ribosomal reading frame: the influence of the E site during translational regulation of release factor 2. Cell. 2004;118:45–55. doi: 10.1016/j.cell.2004.06.012. [DOI] [PubMed] [Google Scholar]
- 61.Munro JB, Altman RB, Tung CS, Sanbonmatsu KY, Blanchard SC. A fast dynamic mode of the EF-G-bound ribosome. EMBO J. 2010;29:770–81. doi: 10.1038/emboj.2009.384. [DOI] [PMC free article] [PubMed] [Google Scholar]
- 62.Dave R, Terry DS, Munro JB, Blanchard SC. Mitigating unwanted photophysical processes for improved single-molecule fluorescence imaging. Biophys J. 2009;96:2371–81. doi: 10.1016/j.bpj.2008.11.061. [DOI] [PMC free article] [PubMed] [Google Scholar]
- 63.Aitken CE, Marshall RA, Puglisi JD. An oxygen scavenging system for improvement of dye stability in single-molecule fluorescence experiments. Biophys J. 2008;94:1826–35. doi: 10.1529/biophysj.107.117689. [DOI] [PMC free article] [PubMed] [Google Scholar]
Associated Data
This section collects any data citations, data availability statements, or supplementary materials included in this article.