

Abstract
Background/Objectives
Antibiotics are commonly prescribed for children. Use of antibiotics early in life has been linked to weight gain but there are no large-scale, population-based, longitudinal studies of the full age range among mainly healthy children.
Subjects/Methods
We used electronic health record data on 163,820 children aged 3-18 years and mixed effects linear regression to model associations of antibiotic orders with growth curve trajectories of annual body mass index (BMI) controlling for confounders. Models evaluated three kinds of antibiotic associations – reversible (time-varying indicator for an order in year before each BMI), persistent (time-varying cumulative orders up to BMIj), and progressive (cumulative orders up to prior BMI [BMIj-1]) – and whether these varied by age.
Results
Among 142,824 children under care in the prior year, a reversible association was observed and this short-term BMI gain was modified by age (p < 0.001); effect size peaked in mid-teen years. A persistent association was observed and this association was stronger with increasing age (p < 0.001). The addition of the progressive association among children with at least three BMIs (n = 79,752) revealed that higher cumulative orders were associated with progressive weight gain; this did not vary by age. Among children with an antibiotic order in the prior year and at least seven lifetime orders, antibiotics (all classes combined) were associated with an average weight gain of approximately 1.4 kg at age 15 years. When antibiotic classes were evaluated separately, the largest weight gain at 15 years was associated with macrolide use.
Conclusions
We found evidence of reversible, persistent, and progressive effects of antibiotic use on BMI trajectories, with different effects by age, among mainly healthy children. The results suggest that antibiotic use may influence weight gain throughout childhood and not just during the earliest years as has been the primary focus of most prior studies.
Introduction
Antibiotics have long been recognized to promote growth in animals 1,2 and sub-therapeutic doses of antibiotics in animal feeds are commonly used for this purpose.3-5 There has been increasing interest in whether therapeutic antibiotics might produce this effect in humans. It has been hypothesized that antibiotics may impact metabolism and energy balance by altering intestinal microbial populations. Observations of differences in gut microbiota in obese vs. lean human subjects 6-11 suggest that microbial changes in the human gut may be a cause of obesity.12
Disruption of the gut microbiota ecology 13 with antibiotics adversely affects physiology.6,14-16 Antibiotics can lead to pervasive changes in the gut microbiota 12,17; after short-term use, microbiota can return to pre-treatment patterns,18 but the composition can remain changed for several years and long-term use can result in permanent alterations.17,19-23 Antibiotic-induced changes to the microbiota in early life tend to be long-lasting, as early-established bacteria tend to out-compete newly introduced ones.24
A recent review of therapeutic antibiotic use and weight gain in humans reported that a large majority of studies observed such effects.12 Most studies were limited by small sample sizes (median = 113) and narrow populations studied.25,26 Of the fourteen that focused on children, half examined exposure in children under 3 years and four were confined to infancy. The majority studied only one antibiotic class and individuals with serious infections or chronic diseases, with the possibility that weight gain reflected resolution of the infection.12
We used electronic health record data from a large health system to evaluate whether and how antibiotics may be associated with longitudinal body mass index (BMI) trajectories. This study addresses many of the limitations of prior studies in its evaluation of longitudinal associations between antibiotics and BMI trajectories, across childhood, using a large population-based sample of mainly healthy children without chronic diseases.
Methods
Study population and design
The study population and design have been previously reported.27 Data were obtained from children and adolescents (hereafter “children”) with a primary care provider in the Geisinger Health System. These children are representative of the general population in the study area of 37 counties in central and northeastern Pennsylvania.28-31 The study was approved by Institutional Review Boards at both the Geisinger Health System and Johns Hopkins Bloomberg School of Public Health.
Data collection
Data collection using electronic health record data has been previously described.27 We collected data on 257,729 children ages 2-18 years between January 2001 and February 2012. After data cleaning, geocoding, and exclusion of 2-year olds,30,31 163,820 children were included in the analysis. Children can enter or leave care by the health system at any time as family circumstances change, so children in this cohort have varying periods of contact with the health system. Data were obtained on sociodemographics, outpatient, inpatient and emergency encounters, vital signs, laboratory tests, procedures, and medication orders. Orders and encounters were accompanied by International Classification of Diseases, 9th Revision, Clinical Modification (ICD-9) diagnostic codes.
Conceptual framework, hypotheses, and antibiotic metrics
We evaluated associations of antibiotic exposure with BMI trajectories during childhood. Because this was a longitudinal study, we were able to evaluate three non-exclusive hypotheses (H1, H2, H3 below) about whether the associations of antibiotics were exclusively short-latency and short-term or there were longer-term implications (Figure). Antibiotic orders were used as a surrogate for antibiotic dosing because information on dose, duration, and refills can be missing or difficult to discern in electronic health record data. Only one antibiotic order per day was counted. Relevant antibiotics were identified through the Medi-Span Generic Product Identifier Therapeutic Classification System.32
Figure.
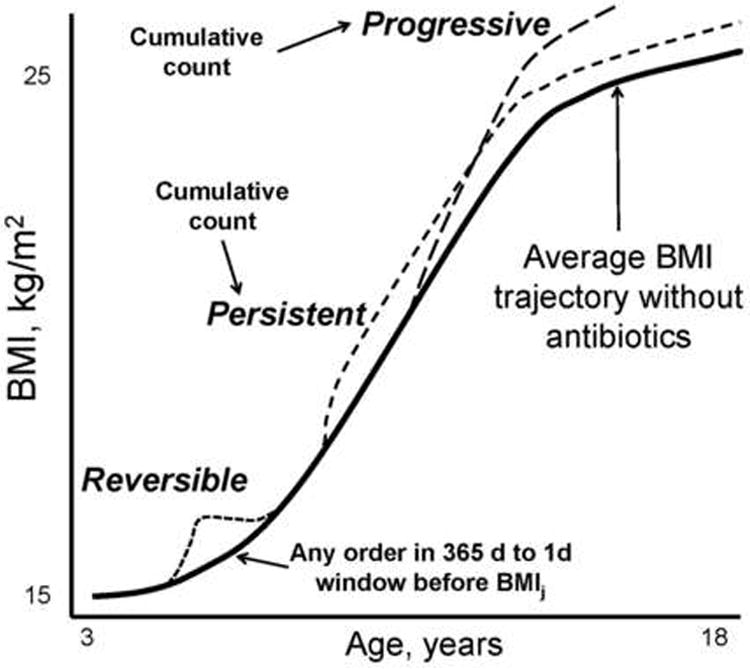
Schematic representation of reversible, persistent, and progressive associations of antibiotic orders with body mass index (BMI) trajectories. All three association types were evaluated with time-varying antibiotic order variables. The cumulative counts for the persistent and progressive associations varied slightly. See text for details.
Using these data, we summarized the antibiotic history using three time-varying metrics:
H1 – reversible effect: Indicator (0/1) of any antibiotic order in the year before each BMI measurement (X1 = recent exposure).
H2 – persistent effect: Cumulative number of antibiotic orders by the health system before BMIj (X2 = cumulative exposure).
H3 – progressive effect: Cumulative number of antibiotic orders by the health system before the prior BMI (BMIj-1) (X3 = lagged cumulative exposure).
Because cumulative number of antibiotic orders was skewed, X2 and X3 were modeled via dummy variables encoding categorical levels (0, 1, 2-3, 4-6, or 7+ orders).
The recent exposure coefficient (X1) encoded a reversible association; it allowed for an “increment” (or decrement) to the next BMI if there was an antibiotic order in the prior year, which reverted to 0 when there was no such order. The cumulative exposure coefficient (X2) encoded a persistent association; once exposure had occurred to a given level, it continued to contribute at that level to subsequent BMIs (until more orders were added). The lagged cumulative exposure coefficient (X3) encoded a progressive association; it allowed past exposure to contribute to subsequent BMIs as a progression (or attenuation) of its original impact. Interactions with age evaluated whether associations varied by periods of childhood.
Variable creation
We computed BMIs by standard procedures using clinic-based measures.27 We analyzed untransformed BMI because this yields estimates that are more interpretable, precise, and sensitive to factors that alter change when modeling trajectories compared with age-standardized metrics such as z-transformed BMI (BMI z-scores), because BMI z-scores are age-adjusted, cross-sectional deviations from national norms, which removes some of the longitudinal change across years within children.33-35 Age (years) was encoded as duration between the child's date of birth and each BMI. For children with more than one BMI for an age-year, one was randomly selected to mitigate prevalent disease sampling bias. Two primary comorbidities were examined because they were relatively common and not thought to be in the causal pathway from antibiotics to obesity; asthma (493.x) and diabetes (250.x) were considered present if there were two or more outpatient encounters or medication orders with ICD-9 codes up to one year after the last BMI. Medical Assistance for health insurance was used as a surrogate for low family socioeconomic status (SES).27 Children were considered under care by the health system if they had any evidence of contact (e.g., encounter, medication order, laboratory test) with the health system within or before the window of interest. First BMIs without a prior period during which the child was under care were excluded (n = 49,587) because we could not determine antibiotic use prior to the BMI measurement.
Data analysis
We used mixed effects linear regression models to model growth trajectories of BMI by age.27 In initial analyses, outliers and distributional skewing were identified and crude longitudinal trends and bivariable relationships between BMI and predictor variables described. Models included fixed-effects terms for age, age2, and age3 to allow BMI to increase and decrease flexibly over time (age was grand mean-centered at 10.7 years), sex, race/ethnicity (African-American, Hispanic, and other vs. white), and Medical Assistance (ever vs. never). Random intercept age and age2 terms also were included and allowed to covary with unstructured covariance. Fitting was accomplished by restricted maximum likelihood estimation. We allowed residual variances to vary by age groups (3-5, 5-8, and over 8 years). Models included cross-products of sex and Medical Assistance with all three age terms and of race/ethnicity with age and age2, all as fixed effects. Stata (StataCorp LP, College Station, TX) was used for data analysis. All p-values were two-sided and there was no adjustment for multiple comparisons.
To evaluate antibiotic associations, we regressed BMI in a given year (BMIj) on antibiotic history up to that time through the antibiotic main effect terms (recent, cumulative, and lagged cumulative orders) and their interactions with age (i.e., with age, age2, and age3), added to models in stages. We undertook extensive model-checking and sensitivity analyses to ensure the validity of our findings, including the use of residual and partial residual plots.36 For the latter, we compared modeled relationships with a lowess-smooth37 of the plot; there was good agreement. To evaluate robustness of findings to model assumptions, final models were re-fit using a Huber-White estimator of coefficient variances. As there were no substantive differences only the results of the primary analyses are presented.
To evaluate magnitudes of associations, we calculated the predicted difference in BMI at age 15 years for a child with an antibiotic order in the prior year and at least seven lifetime orders, compared to a child without antibiotic orders, matched on all other variables in our models. Predictions were developed incorporating reversible and persistent associations (Model 2c), and then with progressive association added (Model 3a), separately for four inclusions: (1) all antibiotics and all observed annual BMIs; (2) all antibiotics and the first six observed annual BMIs among children with at least six BMIs; (3) macrolides only and all observed annual BMIs; and (4) macrolides only and the first six observed annual BMIs among children with at least six BMIs. Analyses tailored to the first six observed annual BMIs sought to mitigate systematic under-counting of antibiotic orders among children with fewer observed BMIs. Because we could verify that these children were under care by the health system for at least six consecutive years, we would be less likely to under-count cumulative use over time compared to children under care for shorter periods of time. Standard errors, test statistics and 95% confidence intervals for the predictions were computed from the variance/covariance matrix of the component coefficients by standard formulas for statistical contrasts.38 The predicted BMI difference was converted to weight in kilograms using the average height in study children at 15 years.
In an additional sensitivity analysis we evaluated associations of cesarean delivery, a microbiome modifier 39,40 that is associated with childhood obesity,41,42 with BMI trajectories in the sub-population of 12,629 children delivered by a Geisinger physician with at least a BMI at age 3 years. Deliveries were identified with ICD-9 V30-V39 codes in the child's EHR (fifth digit of code). Model parameterization differed slightly due to the absence of observations from teenagers, longer and more complete follow-up within children, and a shift in the distribution of cumulative antibiotic orders to larger values. The age3 term was removed as was the allowance for residual variances to vary by age, both because of the smaller age range. Progressive antibiotic associations were not evaluated.
Results
Description of children and antibiotic use
Children were primarily white, contributing on average three age-year BMIs to the analysis (Table 1). Antibiotic orders were common, with over 59% of children with at least one order and an average of over four orders while under care (Table 1). Among all 163,820 children there were 683,821 antibiotic orders, and 475,275 BMIs from 142,824 children who were under care in the year before their first BMI. The mean (SD) duration in years from their first to their last BMI for children (n = 142,824) whose first BMI was at age 3-6 years, 7-10 years, 11-14 years, and 15-18 years was 3.8 (3.3), 4.6 (3.5), 3.3 (2.3) and 0.9 (1.0) years, respectively. As expected, children with at least one year of documented contact with the health system prior to their first BMI had a higher proportion with an antibiotic order and a higher mean cumulative number of orders than did all children (Table 1). Among children with contact with GHS in their first year of life, 49% had an antibiotic order in that year. Among children who received antibiotics, there were approximately two orders per year (Table 2). The orders (n [%]) by class were: cephalosporins (n = 117,894 [17.2]), clindamycin (n = 7,110 [1.0]), macrolides (n = 111,881 [16.4]), metronidazole (n = 3,116 [0.5]), penicillins (n = 367,797 [53.8]), quinolones (n = 4,513 [0.7]), sulfonamides (n = 44,942 [6.6]), tetracyclines (n = 22,930 [3.4]), and other classes (n = 3,638 [0.6]).
Table 1. Summary statistics for two groups of children in analysis (age 3 to 18 years at any time between 2001 and 2012 with valid body mass index).
| Study Variable | All Children | Children Under Observation in the Year Preceding at Least One BMI |
|---|---|---|
|
| ||
| Number (children) | 163,820 | 142,824 |
|
| ||
| Number (observations) | 524,862 | 475,275 |
|
| ||
| Age at first BMI, years, mean (SD), range | 8.9 (5.0), 3-18 | 8.5 (5.0), 3-18 |
|
| ||
| Race/ethnicity, percent | ||
| White | 91.3 | 92.5 |
| Black | 4.7 | 4.5 |
| Hispanic | 1.1 | 0.9 |
| Other | 1.6 | 1.4 |
| Missing | 1.3 | 0.8 |
|
| ||
| Sex, female, percent | 49.7 | 49.8 |
|
| ||
| Age at last BMI, years, mean (SD), range | 11.8 (5.1), 3-18 | 11.9 (5.1), 3-18 |
|
| ||
| Duration between first and last BMI, years, mean (SD), range | 2.9 (3.1), 0-11.1 | 3.3 (3.1), 0-11.1 |
|
| ||
| Number of annual BMIs available for analysis, mean (SD), range | 3.2 (2.4), 1-13 | 3.5 (2.4), 1-13 |
|
| ||
| BMI, first, kg/m2, mean (SD), range | 19.7 (5.3), 10.5-54.5 | 19.5 (5.2), 10.5-54.5 |
|
| ||
| BMI, last, kg/m2, mean (SD), range | 21.5 (6.0), 10.7-55.6 | 21.6 (6.0), 10.7-55.6 |
|
| ||
| No. of daily* orders, lifetime, age 0-18 years, mean, median, SD, range | 4.0, 2, 6.1, 0-123 | 4.6 (6.3), 0-123 |
|
| ||
| Lifetime antibiotic order count to last BMI by child, % of children | ||
| Zero | 40.8 | 32.0 |
| One | 13.3 | 15.2 |
| Two to three | 15.2 | 17.4 |
| Four to six | 12.5 | 14.4 |
| Seven or more | 18.3 | 20.9 |
Abbreviations: BMI = body mass index; SD = standard deviation
Only one order per day was counted
Table 2. Antibiotic orders by child age.
| Child age (years) | Number (%*) with contact with GHS of any type** | Number (%†) with ANY antibiotics order at this age | Mean (SD) number of orders per child under observation | Mean (SD) number of orders per child who received antibiotics |
|---|---|---|---|---|
| 0 | 29858 (18.2) | 14752 (49.4) | 1.19 (1.82) | 2.40 (1.95) |
| 1 | 33842 (20.7) | 19814 (58.5) | 1.55 (2.05) | 2.65 (2.07) |
| 2 | 38694 (23.6) | 20572 (53.2) | 1.20 (1.78) | 2.25 (1.89) |
| 3 | 46041 (28.1) | 22626 (49.1) | 1.04 (1.56) | 2.11 (1.64) |
| 4 | 47383 (28.9) | 22800 (48.1) | 0.99 (1.49) | 2.05 (1.56) |
| 5 | 48089 (29.4) | 23370 (48.6) | 0.99 (1.46) | 2.05 (1.50) |
| 6 | 45870 (28.0) | 22371 (48.8) | 0.98 (1.45) | 2.00 (1.50) |
| 7 | 44614 (27.2) | 19816 (44.4) | 0.84 (1.35) | 1.90 (1.45) |
| 8 | 44183 (27.0) | 18300 (41.4) | 0.75 (1.24) | 1.81 (1.35) |
| 9 | 43735 (26.7) | 17117 (39.1) | 0.69 (1.19) | 1.76 (1.31) |
| 10 | 43788 (26.7) | 16501 (37.7) | 0.65 (1.13) | 1.72 (1.24) |
| 11 | 46357 (28.3) | 15727 (33.9) | 0.57 (1.06) | 1.69 (1.18) |
| 12 | 45746 (28.0) | 15680 (34.3) | 0.58 (1.09) | 1.69 (1.25) |
| 13 | 45474 (27.8) | 15739 (34.6) | 0.59 (1.10) | 1.69 (1.28) |
| 14 | 46067 (28.1) | 16470 (35.8) | 0.61 (1.14) | 1.71 (1.32) |
| 15 | 48070 (29.3) | 17584 (36.6) | 0.64 (1.17) | 1.76 (1.34) |
| 16 | 49434 (30.2) | 18306 (37.0) | 0.67 (1.25) | 1.82 (1.47) |
| 17 | 45760 (27.9) | 18396 (40.2) | 0.73 (1.29) | 1.82 (1.46) |
| 18 | 39913 (24.4) | 15307 (38.5) | 0.69 (1.24) | 1.79 (1.43) |
Of total of 163,820 in analysis
“Under observation”
Percent of number under observation
Associations of antibiotic use with BMI trajectories
There was evidence of a reversible association of antibiotics with higher BMI (Table 3, Model 1). This association was modified by age; the short-term BMI gain was strongest in the mid-teen years. The cumulative order term was next added to the model to evaluate the persistent association while controlling for the reversible association (Table 3). Estimates increased across categories of cumulative orders (1, 2-3, 4-6, and 7+), consistent with a dose-response relation (Model 2a). Cross-products of level of cumulative orders with age, age2, and age3 were next added (Model 2b), with evidence of effect modification by age. To achieve parsimony while focusing on inference and prediction, this model was reduced to include only the linear age cross-products (Model 2c). Estimates increased across categories of cumulative orders and also in their cross-products with age, evidence that the persistent association was stronger with increasing age. Lagged cumulative orders were next added to evaluate progressive associations (Table 4). There was a trend of increasing beta coefficients across cumulative order groups, evidence of a dose-response relation (Model 3a). There was no consistent evidence that the progressive association varied by age (Model 3b) or by higher order age terms (results not shown).
Evaluation of associations of antibiotics with BMI trajectories for children observed in the prior year, evaluating an antibiotic order in the prior year and cumulative orders up to the BMI measurement† (reversible and persistent effects).
| Variable | Model 1 Beta (SE) |
Model 2a Beta (SE) |
Model 2b Beta (SE) |
Model 2c Beta (SE) |
|---|---|---|---|---|
| Number of children | UO‡ 142,824 | UO 142,824 | UO 142,824 | UO 142,824 |
| Number of BMI observations | 475,275 | 475,275 | 475,275 | 475,275 |
| Antibiotic order 1.0 y to 1 d before BMIj, yes vs. no | 0.054 (0.008)*** | 0.046 (0.008)*** | 0.054 (0.009)*** | 0.044 (0.008)*** |
| Antibiotic in window × age | 0.016 (0.002)*** | 0.017 (0.002)*** | 0.017 (0.003)*** | 0.015 (0.003)*** |
| Antibiotic in window × age2 | -0.001 (0.0003)*** | -0.001 (0.0003)*** | -0.002 (0.0003)*** | -0.001 (0.0003)*** |
| Antibiotic in window × age3 | -0.0003 (0.00006)*** | -0.0004 (0.00006)*** | -0.0004 (0.00007)*** | -0.0004 (0.00006)*** |
| Cumulative antibiotic orders to BMIj, count | ||||
| One | 0.013 (0.009) | 0.012 (0.016) | 0.020 (0.011) | |
| One × age | 0.004 (0.004) | 0.0009 (0.002) | ||
| One × age2 | 0.0005 (0.0005) | |||
| One × age3 | -0.00003 (0.0001) | |||
| Two or three | 0.025 (0.010)* | 0.025 (0.017) | 0.048 (0.012)*** | |
| Two/three × age | 0.00009 (0.005) | 0.005 (0.002)* | ||
| Two/three × age2 | 0.001 (0.0005)* | |||
| Two/three × age3 | 0.0002 (0.0001)* | |||
| Four to six | 0.049 (0.012)*** | 0.071 (0.019)*** | 0.084 (0.014)*** | |
| Four-six × age | 0.010 (0.005) | 0.009 (0.003)*** | ||
| Four-six × age2 | 0.0009 (0.0006) | |||
| Four-six × age3 | 0.00005 (0.0001) | |||
| Seven or more | 0.100 (0.014)*** | 0.100 (0.022)*** | 0.146 (0.017)*** | |
| Seven/more × age | 0.012 (0.006)* | 0.013 (0.003)*** | ||
| Seven/more × age2 | 0.002 (0.0007)** | |||
| Seven/more × age3 | 0.0001 (0.0001) |
Models controlled for age (centered), sex, race/ethnicity, and Medical Assistance as described in the Methods.
UO = under observation; all children in these models were observed in the prior year
P-values:
p < 0.001;
0.001 ≤ p < 0.01;
0.01 ≤ p < 0.05
Table 4.
Evaluation of associations of antibiotics with BMI trajectories for children with at least three BMIs, evaluating an order in the prior year, cumulative antibiotic orders up to the BMI measurement, and lagged cumulative antibiotic orders up to the prior BMI measurement† (reversible, persistent, and progressive effects)
| Variable | Model 3a Beta (SE) |
Model 3b Beta (SE) |
|---|---|---|
| Number of children | UO‡ 79,752 | UO 79,752 |
| Number of BMI observations | 329,658 | 329,658 |
| Antibiotic order 1.0 y to 1 d before BMIj, yes vs. no | 0.044 (0.010)*** | 0.045 (0.010)*** |
| Antibiotic in window × age | 0.013 (0.003)*** | 0.013 (0.003)*** |
| Antibiotic in window × age2 | -0.001 (0.0004)*** | -0.001 (0.0004)*** |
| Antibiotic in window × age3 | -0.0004 (0.00009)*** | -0.0004 (0.00009)*** |
| Cumulative antibiotic orders to BMIj, count | ||
| One | 0.020 (0.014) | 0.020 (0.014) |
| One × age | 0.005 (0.003) | 0.005 (0.003) |
| Two or three | 0.051 (0.017)** | 0.051 (0.017)** |
| Two/three × age | 0.011 (0.003)*** | 0.010 (0.004)** |
| Four to six | 0.082 (0.020)*** | 0.082 (0.021)*** |
| Four-six × age | 0.017 (0.003)*** | 0.017 (0.004)*** |
| Seven or more | 0.112 (0.025)*** | 0.113 (0.025)*** |
| Seven/more × age | 0.024 (0.004)*** | 0.023 (0.005)*** |
| Lagged cumulative antibiotic orders to BMIj-1, count | ||
| One | 0.025 (0.011)* | 0.026 (0.011)* |
| One × age | 0.001 (0.002) | |
| Two or three | 0.021 (0.012) | 0.023 (0.013) |
| Two/three × age | 0.001 (0.003) | |
| Four to six | 0.047 (0.015)** | 0.046 (0.016)** |
| Four-six × age | -0.001 (0.003) | |
| Seven or more | 0.090 (0.018)*** | 0.097 (0.019)*** |
| Seven/more × age | 0.004 (0.004) |
Models controlled for age (centered), sex, race/ethnicity, and Medical Assistance as described in the Methods.
UO = under observation; all children in these models had at least three BMIs and were observed in the year before the first BMI
P-values:
p < 0.001;
0.001 ≤ p < 0.01;
0.01 ≤ p < 0.05
Sensitivity analyses
We did not observe all children across their entire childhoods, so our models “spliced” data from different children at different ages. We evaluated age-stratified models of children within narrower age ranges to evaluate whether “splicing” distorted inferences. When Model 2c without age3 was repeated in three age strata (3-8, 9-13, 14-18 years), inferences were substantively the same in each age stratum as in the all ages model. In our primary models, we assumed that effects of all classes of antibiotics were similar. To evaluate this assumption, we re-estimated Model 3a separately for three classes with the most orders (penicillins, cephalosporins, and macrolides, controlling for other antibiotic use, compared to children who had received none). Inferences were generally similar for all three classes but magnitude estimates were larger for macrolides (next section). To evaluate confounding by comorbid conditions, asthma and diabetes were added to Models 2c and 3a. Both were associated with higher BMI at the average age (results not shown). There were no consistent or substantive changes to antibiotic inferences when each was added alone; there was slight attenuation of antibiotic associations without change in inferences (results not shown) when both were added together. Because in prior work we observed that stimulant use was associated with BMI trajectories,27 we added duration of stimulant use (categorical) and cross-products with age to the antibiotic models. There were no substantive changes in antibiotic associations or inferences after these additions (results not shown).
The sub-population of 12,629 primary care patients delivered by a Geisinger physician had improved observation over their lifetimes than did the entire population of 163,820 children, with all observed from birth to the last BMI with a minimum of three years of observation. These children, between the ages of 3 and 8 years at the end of observation, had mean (SD, median) duration from birth to last BMI of 5.1 (1.4, 5.1) years and mean (SD, median) cumulative antibiotic orders of 6.3 (6.4, 5.0). Of the 12,629 children, 4,382 (34.7%) were delivered by cesarean. A strong association of cesarean delivery with BMI was found that increased with age, though we were unable to account for initial birth weight in the model due to limitations in the EHR data. The analysis also revealed a stronger antibiotic association than in the primary analysis appearing at a much earlier age. There was little evidence of effect modification by delivery mode on antibiotic associations.
Estimation of the magnitude of the antibiotic association
The magnitude of the predicted weight gain (compared to no antibiotic use) was calculated separately for each of the three most commonly used classes of antibiotics (penicillins, cephalosporins, macrolides). The magnitude of the predicted weight gain associated with antibiotic use ranged from 0.73 to 1.50 kilograms among the various models (Table 5). The excess weight gain was larger after the addition of progressive associations to reversible and persistent, from all antibiotics to macrolides alone, and from all BMIs to the first six BMIs. Among the antibiotic classes the predicted weight gain at age 15 years was highest for macrolides, but the penicillin and cephalosporin classes use were also separately associated with weight gain.
Table 5.
Average (95% CI) kilograms of additional weight at age 15 years compared to children who did not receive antibiotics, for boys and girls combined with the average height in our data, for both models 2c (persistent) and 3a (progressive)*. Data are presented for four groups: all antibiotic classes using all body mass indexes (BMIs); all antibiotic classes including a child's first six BMIs; macrolides only using all BMIs; and macrolides only including a child's first six BMIs.
| Model | All antibiotics, all observed** BMIs | All antibiotics, first 6 observed BMIs | Macrolides only***, all observed BMIs | Macrolides only, first 6 observed BMIs |
|---|---|---|---|---|
| PERSISTENT (model 2c) | ||||
| # children | 142,824 | 26,228 | 142,824 | 26,228 |
| # BMIs | 475,275 | 135,093 | 475,275 | 135,093 |
| Mean (95% CI) BMI gain at age 15 years | 0.258 | 0.387 | 0.412 | 0.531 |
| Mean (95% CI) weight gain (kg) at age 15 years | 0.73 (0.59, 0.86) | 1.09 (0.82, 1.36) | 1.13 (0.86, 1.45) | 1.50 (1.00, 2.00) |
| PROGRESSIVE (model 3a) | ||||
| # children | 79,752 | 26,228 | 79,752 | 26,228 |
| # BMIs | 329,658 | 135,093 | 329,658 | 135,093 |
| Mean (95% CI) BMI gain at age 15 years | 0.352 | 0.483 | 0.430 | 0.502 |
| Mean (95% CI) weight gain (kg) at age 15 years | 1.0 (0.82, 1.18) | 1.36 (1.04, 1.63) | 1.22 (0.86, 1.54) | 1.41 (0.86, 1.95) |
To be included in these calculations children had to have been under observation in the relevant time windows.
Observed indicates patient record documents was under observation in relevant window for each BMI
Compared to reference groups, in model that also separately accounted for all other antibiotic use
In the delivery mode subset analysis, in the highest group of cumulative antibiotic orders (12 or more), the antibiotic association was equivalent to 1.10 more kg at age 8 years (95% CI 0.68 to 1.52 kg), amounting to a 3.5% increase in overall mass over the average at that age. The cesarean delivery association at age 8 years of 0.80 kg (95% CI 0.54 to 1.06 kg) was approximately equivalent to the association with 5 to 7 cumulative antibiotic orders (0.75 kg, 95% CI 0.34 to 1.15 kg).
Discussion
In a large, longitudinal study of children representative of the general population in the region, there were associations between receipt of antibiotics and increases in BMI. Associations were complex: reversible associations as a function of antibiotic orders in the prior year that were stronger in the mid-teen years; persistent associations as a function of cumulative orders that got stronger with age; and progressive associations as a function of lagged cumulative orders that did not vary by age. Dose-response relations were observed for both persistent and progressive associations. Several of the observations have not been previously examined, including that antibiotics during childhood may influence BMI at any age, both recent and cumulative doses impact BMI, that antibiotics can impact BMI for long periods of time, and that some impacts strengthen with age. In a subgroup analysis, there was little evidence that delivery mode modified associations of antibiotics with BMI trajectories, but children delivered by cesarean did have higher BMIs at the average age and more rapid BMI growth with increasing age, consistent with prior studies.43 Despite recent declines in antibiotic prescribing in the ambulatory pediatric setting, over-use of broad-spectrum antibiotics continues.44,45 The findings add to mounting evidence in favor of more judicious use of antibiotics in clinical practice.
The estimated magnitude of the effect predicted by our models ranged from 0.73 to 1.50 kilograms at age 15 years. However, we likely under-estimated these magnitudes, as our sensitivity analyses showed stronger effects among children who were under care for longer periods of time (i.e., in subgroup using the first six annual BMIs, who were all under care for at least six consecutive years, and in the delivery mode analysis). Not all children were observed in the first two years of life when antibiotics may have a stronger influence on obesity risk.46 The effects were larger for certain antibiotic classes, and we did not account for more than seven lifetime orders because of the very skewed distribution. Finally, we relied on a surrogate (i.e., physician orders) for antibiotic dose and duration, and we cannot be certain about complete ascertainment of antibiotic use given the possible receipt of care outside the health system.
Prior studies have reported a range of findings regarding the impact and timing of antibiotic exposure on BMI and obesity risk. Antibiotics given to children in the first 6 months of life were found to be associated with subsequent risk of over-weight 47,48 but those given from 6-23 months were not related to later BMI.25 Erythromycin was associated with weight gain in preterm neonates with feeding intolerance 49; antibiotics improved weight gain in children with malnutrition.50,51 Vancomycin, macrolides, and tetracyclines (and penicillin) were associated with weight gain, while penicillin was associated with weight loss in one study in children in Guatemala.52 A recent large study using electronic health record data reported that antibiotic use in the first 23 months of life was associated with increased risk of obesity at 24-59 months, especially for broad-spectrum antibiotics.46 The differences in findings across studies are likely due, in part, to the range of specific disease populations studied (e.g., cystic fibrosis, endocarditis, peptic ulcer), differences in the antibiotics under study, and differences in the age groups studied.
We found that associations between antibiotic exposure and BMI change were reversible, persistent, and progressive. These findings are consistent with previous studies of the complex association between antibiotics and the microbiome.53 Some human studies have reported recovery of the microbiota after exposure to antibiotics, supporting our reversible association.53 In other studies, changes resulting from the antibiotic exposure have lasted for as long as four years, consistent with our observed persistent association.23,53,54 Our finding that associations differed by age is biologically plausible. Gut microbiota can change throughout childhood and even during adulthood.55 The changes in the proportion of calories from carbohydrates with age may be another explanation,56 as microbiota facilitate lipogenesis when presented with high carbohydrate diets, thus promoting positive energy balance and gains in body mass.57
Increasing evidence points to the possibility that obesity is the consequence of selective environmental exposures during sensitive developmental periods that alter basic programming of metabolic parameters.58-60 The finding of progressive effects implies that antibiotics may alter the growth trajectories of children in ways that become amplified over time. This has important life-course implications: while the magnitude of weight increase attributable to antibiotics may be modest by the end of childhood, the finding of progressive effects raises the possibility of accumulating and accelerating effects compounding over the life course.
Our study has several limitations. We did not observe complete childhood trajectories, but rather, a series of exposures and outcomes over a portion of childhood typically spanning 3-5 years for each child. Importantly, we lacked prior antibiotic history on children before they entered care with the Geisinger Health System, so that cumulative counts may be more severely biased in children who entered the health system at later ages. We could not ascertain antibiotic prescribing outside of the health system or compliance with antibiotic orders. We may have assessed exposure more accurately in sicker children with more frequent contact with the healthcare system. We were unable to include information on maternal prenatal antibiotic use or child birth weight because EHR data on adults were not included in the study's data and birth weight was not routinely recorded in an easily retrievable way. We believe most of these are all likely to bias our results towards the null and to reduce the magnitude of the observed associations. It is possible that our inability to control for maternal factors influencing development such as prenatal antibiotic use could confound our results. For maternal factors during pregnancy to account for our findings would require these to be highly correlated with cumulative antibiotic use over many years in children 3-8 years later. We have been unable to find support in the literature for such a correlation. However, it is known that some factors during pregnancy are associated with postnatal antibiotic use in children.25
In conclusion, in the largest study to date of the association between antibiotics and longitudinal BMI trajectories in children, we observed a combination of reversible, persistent, and progressive associations across several antibiotic classes. We studied a population-based sample of children mainly without chronic diseases and included a broad age range, allowing us to study whether effects differed by age. The results suggest that antibiotic use may influence weight gain throughout childhood and not just during the earliest years as has been the primary focus of most prior studies.
Acknowledgments
Funding source: The project described was supported by Grant Number U54 HD-070725 from the Eunice Kennedy Shriver National Institute of Child Health & Human Development (NICHD). The project is co-funded by the NICHD and the Office of Behavioral and Social Sciences Research (OBSSR). The content is solely the responsibility of the authors and does not necessarily represent the official views of the National Institutes of Health.
Abbreviations
- BMI
body mass index
- HER
electronic health record
- GHS
Geisinger Health System
- SD
standard deviation
- SES
socioeconomic status
Footnotes
Conflict of interest statement: All authors report there are no competing financial interests.
References
- 1.Moore PR, Evenson A, Luckey TD, McCoy E, Elvehjem CA, Hart EB. Use of sulfasuxidine, streptothricin, and streptomycin in nutritional studies with the chick. J Biol Chem. 1946 Oct;165(2):437–441. [PubMed] [Google Scholar]
- 2.Stokstad ELR, Jukes TH, Pierce J, Page JAC, Franklin AL. The multiple nature of the animal protein factor. J Biol Chem. 1949 Sep;180(2):647–654. [PubMed] [Google Scholar]
- 3.Jukes TH. Antibiotics in Animal Feeds and Animal Production. Bioscience. 1972;22(9):526–&. [Google Scholar]
- 4.Kiser JS. Perspective on Use of Antibiotics in Animal Feeds. Journal of Animal Science. 1976;42(4):1058–1071. doi: 10.2527/jas1976.4241058x. [DOI] [PubMed] [Google Scholar]
- 5.Butaye P, Devriese LA, Haesebrouck F. Antimicrobial growth promoters used in animal feed: effects of less well known antibiotics on gram-positive bacteria. Clinical microbiology reviews. 2003 Apr;16(2):175–188. doi: 10.1128/CMR.16.2.175-188.2003. [DOI] [PMC free article] [PubMed] [Google Scholar]
- 6.Turnbaugh PJ, Hamady M, Yatsunenko T, Cantarel BL, Duncan A, Ley RE, et al. A core gut microbiome in obese and lean twins. Nature. 2009 Jan 22;457(7228):480–484. doi: 10.1038/nature07540. [DOI] [PMC free article] [PubMed] [Google Scholar]
- 7.Ley RE, Turnbaugh PJ, Klein S, Gordon JI. Microbial ecology: human gut microbes associated with obesity. Nature. 2006 Dec 21;444(7122):1022–1023. doi: 10.1038/4441022a. [DOI] [PubMed] [Google Scholar]
- 8.Santacruz A, Marcos A, Warnberg J, Marti A, Martin-Matillas M, Campoy C, et al. Interplay between weight loss and gut microbiota composition in overweight adolescents. Obesity (Silver Spring) 2009 Oct;17(10):1906–1915. doi: 10.1038/oby.2009.112. [DOI] [PubMed] [Google Scholar]
- 9.Zhang H, DiBaise JK, Zuccolo A, Kudrna D, Braidotti M, Yu Y, et al. Human gut microbiota in obesity and after gastric bypass. Proc Natl Acad Sci U S A. 2009 Feb 17;106(7):2365–2370. doi: 10.1073/pnas.0812600106. [DOI] [PMC free article] [PubMed] [Google Scholar]
- 10.Angelakis E, Merhej V, Raoult D. Related actions of probiotics and antibiotics on gut microbiota and weight modification. The Lancet infectious diseases. 2013 Oct;13(10):889–899. doi: 10.1016/S1473-3099(13)70179-8. [DOI] [PubMed] [Google Scholar]
- 11.Schwiertz A, Taras D, Schafer K, Beijer S, Bos NA, Donus C, et al. Microbiota and SCFA in lean and overweight healthy subjects. Obesity (Silver Spring) 2010 Jan;18(1):190–195. doi: 10.1038/oby.2009.167. [DOI] [PubMed] [Google Scholar]
- 12.Million M, Lagier JC, Yahav D, Paul M. Gut bacterial microbiota and obesity. Clinical microbiology and infection : the official publication of the European Society of Clinical Microbiology and Infectious Diseases. 2013 Apr;19(4):305–313. doi: 10.1111/1469-0691.12172. [DOI] [PubMed] [Google Scholar]
- 13.Macfarlane S. Antibiotic treatments and microbes in the gut. Environmental microbiology. 2014 Jan 29; doi: 10.1111/1462-2920.12399. [DOI] [PubMed] [Google Scholar]
- 14.Riley LW, Raphael E, Faerstein E. Obesity in the United States - dysbiosis from exposure to low-dose antibiotics? Frontiers in public health. 2013;1:69. doi: 10.3389/fpubh.2013.00069. [DOI] [PMC free article] [PubMed] [Google Scholar]
- 15.Turnbaugh PJ, Ley RE, Mahowald MA, Magrini V, Mardis ER, Gordon JI. An obesity-associated gut microbiome with increased capacity for energy harvest. Nature. 2006 Dec 21;444(7122):1027–1031. doi: 10.1038/nature05414. [DOI] [PubMed] [Google Scholar]
- 16.Harris K, Kassis A, Major G, Chou CJ. Is the gut microbiota a new factor contributing to obesity and its metabolic disorders? Journal of obesity. 2012;2012:879151. doi: 10.1155/2012/879151. [DOI] [PMC free article] [PubMed] [Google Scholar]
- 17.Dethlefsen L, Huse S, Sogin ML, Relman DA. The pervasive effects of an antibiotic on the human gut microbiota, as revealed by deep 16S rRNA sequencing. PLoS biology. 2008 Nov 18;6(11):e280. doi: 10.1371/journal.pbio.0060280. [DOI] [PMC free article] [PubMed] [Google Scholar]
- 18.De La Cochetiere MF, Durand T, Lepage P, Bourreille A, Galmiche JP, Dore J. Resilience of the dominant human fecal microbiota upon short-course antibiotic challenge. Journal of clinical microbiology. 2005 Nov;43(11):5588–5592. doi: 10.1128/JCM.43.11.5588-5592.2005. [DOI] [PMC free article] [PubMed] [Google Scholar]
- 19.Robinson CJ, Young VB. Antibiotic administration alters the community structure of the gastrointestinal micobiota. Gut microbes. 2010 Jul;1(4):279–284. doi: 10.4161/gmic.1.4.12614. [DOI] [PMC free article] [PubMed] [Google Scholar]
- 20.Robinson CJ, Bohannan BJ, Young VB. From structure to function: the ecology of host-associated microbial communities. Microbiology and molecular biology reviews : MMBR. 2010 Sep;74(3):453–476. doi: 10.1128/MMBR.00014-10. [DOI] [PMC free article] [PubMed] [Google Scholar]
- 21.Dethlefsen L, Relman DA. Incomplete recovery and individualized responses of the human distal gut microbiota to repeated antibiotic perturbation. Proc Natl Acad Sci U S A. 2011 Mar 15;108(Suppl 1):4554–4561. doi: 10.1073/pnas.1000087107. [DOI] [PMC free article] [PubMed] [Google Scholar]
- 22.Jernberg C, Lofmark S, Edlund C, Jansson JK. Long-term impacts of antibiotic exposure on the human intestinal microbiota. Microbiology. 2010 Nov;156(Pt 11):3216–3223. doi: 10.1099/mic.0.040618-0. [DOI] [PubMed] [Google Scholar]
- 23.Jernberg C, Lofmark S, Edlund C, Jansson JK. Long-term ecological impacts of antibiotic administration on the human intestinal microbiota. The ISME journal. 2007 May;1(1):56–66. doi: 10.1038/ismej.2007.3. [DOI] [PubMed] [Google Scholar]
- 24.Martin MA, Sela DA. Infant gut microbiota: developmental influences and health outcomes. In: Clancy KBH, Hinde K, Rutherford JN, editors. Building Babies: Primate Development in Proximate and Ultimate Perspective. New York: Spring Science + Business Media; 2011. pp. 233–256. [Google Scholar]
- 25.Trasande L, Blustein J, Liu M, Corwin E, Cox LM, Blaser MJ. Infant antibiotic exposures and early-life body mass. Int J Obes (Lond) 2013 Jan;37(1):16–23. doi: 10.1038/ijo.2012.132. [DOI] [PMC free article] [PubMed] [Google Scholar]
- 26.Lane JA, Murray LJ, Harvey IM, Donovan JL, Nair P, Harvey RF. Randomised clinical trial: Helicobacter pylori eradication is associated with a significantly increased body mass index in a placebo-controlled study. Alimentary pharmacology & therapeutics. 2011 Apr;33(8):922–929. doi: 10.1111/j.1365-2036.2011.04610.x. [DOI] [PubMed] [Google Scholar]
- 27.Schwartz BS, Bailey-Davis L, Bandeen-Roche K, Pollak J, Hirsch AG, Nau C, et al. Attention deficit disorder, stimulant use, and childhood body mass index trajectory. Pediatrics. 2014 Apr;133(4):668–676. doi: 10.1542/peds.2013-3427. [DOI] [PMC free article] [PubMed] [Google Scholar]
- 28.Liu AY, Curriero FC, Glass TA, Stewart WF, Schwartz BS. The contextual influence of coal abandoned mine lands in communities and type 2 diabetes in Pennsylvania. Health Place. 2013 Apr 25;22C:115–122. doi: 10.1016/j.healthplace.2013.03.012. [DOI] [PubMed] [Google Scholar]
- 29.Casey JA, Curriero FC, Cosgrove SE, Nachman KE, Schwartz BS. High-Density Livestock Operations Crop Field Application of Manure, and Risk of Community-Associated Methicillin-Resistant Staphylococcus aureus Infection in Pennsylvania. JAMA internal medicine. 2013 Sep 16; doi: 10.1001/jamainternmed.2013.10408. [DOI] [PMC free article] [PubMed] [Google Scholar]
- 30.Casey JA, Cosgrove SE, Stewart WF, Pollak J, Schwartz BS. A population-based study of the epidemiology and clinical features of methicillin-resistant Staphylococcus aureus infection in Pennsylvania, 2001-2010. Epidemiol Infect. 2013 Jun;141(6):1166–1179. doi: 10.1017/S0950268812001872. [DOI] [PMC free article] [PubMed] [Google Scholar]
- 31.Schwartz BS, Stewart WF, Godby S, Pollak J, Dewalle J, Larson S, et al. Body mass index and the built and social environments in children and adolescents using electronic health records. Am J Prev Med. 2011 Oct;41(4):e17–28. doi: 10.1016/j.amepre.2011.06.038. [DOI] [PubMed] [Google Scholar]
- 32.Medi-Span. Master Drug Data Base Documentation Manual. Indianapolis, IN: Medi-Span; 2007. [Google Scholar]
- 33.Berkey CS, Colditz GA. Adiposity in adolescents: change in actual BMI works better than change in BMI z score for longitudinal studies. Ann Epidemiol. 2007 Jan;17(1):44–50. doi: 10.1016/j.annepidem.2006.07.014. [DOI] [PubMed] [Google Scholar]
- 34.Cole TJ, Faith MS, Pietrobelli A, Heo M. What is the best measure of adiposity change in growing children: BMI, BMI %, BMI z-score or BMI centile? Eur J Clin Nutr. 2005 Mar;59(3):419–425. doi: 10.1038/sj.ejcn.1602090. [DOI] [PubMed] [Google Scholar]
- 35.Kuczmarski RJ, Ogden CL, Guo SS, Grummer-Strawn LM, Flegal KM, Mei Z, et al. 2000 CDC Growth Charts for the United States: methods and development. Vital and health statistics Series 11, Data from the national health survey. 2002 May;(246):1–190. [PubMed] [Google Scholar]
- 36.Bandeen-Roche K, Hall CB, Stewart WF, Zeger SL. Modelling disease progression in terms of exposure history. Statistics in medicine. 1999 Nov 15;18(21):2899–2916. doi: 10.1002/(sici)1097-0258(19991115)18:21<2899::aid-sim203>3.0.co;2-f. [DOI] [PubMed] [Google Scholar]
- 37.Cleveland WS. Robust locally weighted regression and smoothing scatterplots. J Am Stat Assoc. 1979;74(829-836) [Google Scholar]
- 38.Seber GAF. Linear Regression Analysis. New York: Wiley; 1977. [Google Scholar]
- 39.Munyaka PM, Khafipour E, Ghia JE. External influence of early childhood establishment of gut microbiota and subsequent health implications. Frontiers in pediatrics. 2014;2:109. doi: 10.3389/fped.2014.00109. [DOI] [PMC free article] [PubMed] [Google Scholar]
- 40.Goedert JJ, Hua X, Yu G, Shi J. Diversity and composition of the adult fecal microbiome associated with history of cesarean birth or appendectomy: Analysis of the American Gut Project. EBioMedicine. 2014 Dec 1;1(2-3):167–172. doi: 10.1016/j.ebiom.2014.11.004. [DOI] [PMC free article] [PubMed] [Google Scholar]
- 41.Mueller NT, Whyatt R, Hoepner L, Oberfield S, Dominguez-Bello MG, Widen EM, et al. Prenatal exposure to antibiotics, cesarean section and risk of childhood obesity. Int J Obes (Lond) 2015 Apr;39(4):665–670. doi: 10.1038/ijo.2014.180. [DOI] [PMC free article] [PubMed] [Google Scholar]
- 42.Blustein J, Attina T, Liu M, Ryan AM, Cox LM, Blaser MJ, et al. Association of caesarean delivery with child adiposity from age 6 weeks to 15 years. Int J Obes (Lond) 2013 Jul;37(7):900–906. doi: 10.1038/ijo.2013.49. [DOI] [PMC free article] [PubMed] [Google Scholar]
- 43.Li HT, Zhou YB, Liu JM. The impact of cesarean section on offspring overweight and obesity: a systematic review and meta-analysis. Int J Obes (Lond) 2013 Jul;37(7):893–899. doi: 10.1038/ijo.2012.195. [DOI] [PubMed] [Google Scholar]
- 44.Hersh AL, Jackson MA, Hicks LA. Principles of judicious antibiotic prescribing for upper respiratory tract infections in pediatrics. Pediatrics. 2013 Dec;132(6):1146–1154. doi: 10.1542/peds.2013-3260. [DOI] [PubMed] [Google Scholar]
- 45.Hersh AL, Shapiro DJ, Pavia AT, Shah SS. Antibiotic prescribing in ambulatory pediatrics in the United States. Pediatrics. 2011 Dec;128(6):1053–1061. doi: 10.1542/peds.2011-1337. [DOI] [PubMed] [Google Scholar]
- 46.Bailey LC, Forrest CB, Zhang P, Richards TM, Livshits A, DeRusso PA. Association of Antibiotics in Infancy With Early Childhood Obesity. JAMA pediatrics. 2014 Sep 29; doi: 10.1001/jamapediatrics.2014.1539. [DOI] [PubMed] [Google Scholar]
- 47.Ajslev TA, Andersen CS, Gamborg M, Sorensen TI, Jess T. Childhood overweight after establishment of the gut microbiota: the role of delivery mode, pre-pregnancy weight and early administration of antibiotics. Int J Obes (Lond) 2011 Apr;35(4):522–529. doi: 10.1038/ijo.2011.27. [DOI] [PubMed] [Google Scholar]
- 48.Ray K. Gut microbiota: Adding weight to the microbiota's role in obesity--exposure to antibiotics early in life can lead to increased adiposity. Nature reviews Gastroenterology & hepatology. 2012 Nov;9(11):615. doi: 10.1038/nrgastro.2012.175. [DOI] [PubMed] [Google Scholar]
- 49.Mansi Y, Abdelaziz N, Ezzeldin Z, Ibrahim R. Randomized controlled trial of a high dose of oral erythromycin for the treatment of feeding intolerance in preterm infants. Neonatology. 2011;100(3):290–294. doi: 10.1159/000327536. [DOI] [PubMed] [Google Scholar]
- 50.Trehan I, Goldbach HS, LaGrone LN, Meuli GJ, Wang RJ, Maleta KM, et al. Antibiotics as part of the management of severe acute malnutrition. N Engl J Med. 2013 Jan 31;368(5):425–435. doi: 10.1056/NEJMoa1202851. [DOI] [PMC free article] [PubMed] [Google Scholar]
- 51.Smith MI, Yatsunenko T, Manary MJ, Trehan I, Mkakosya R, Cheng J, et al. Gut microbiomes of Malawian twin pairs discordant for kwashiorkor. Science. 2013 Feb 1;339(6119):548–554. doi: 10.1126/science.1229000. [DOI] [PMC free article] [PubMed] [Google Scholar]
- 52.Guzman MA, Scrimshaw NS, Monroe RJ. Growth and development of Central American children. I. Growth responses of rural Guatemalan school children to daily administration of penicillin and aureomycin. Am J Clin Nutr. 1958 Jul-Aug;6(4):430–438. doi: 10.1093/ajcn/6.4.430. [DOI] [PubMed] [Google Scholar]
- 53.Lozupone CA, Stombaugh JI, Gordon JI, Jansson JK, Knight R. Diversity, stability and resilience of the human gut microbiota. Nature. 2012 Sep 13;489(7415):220–230. doi: 10.1038/nature11550. [DOI] [PMC free article] [PubMed] [Google Scholar]
- 54.Jakobsson HE, Jernberg C, Andersson AF, Sjolund-Karlsson M, Jansson JK, Engstrand L. Short-term antibiotic treatment has differing long-term impacts on the human throat and gut microbiome. Plos One. 2010;5(3):e9836. doi: 10.1371/journal.pone.0009836. [DOI] [PMC free article] [PubMed] [Google Scholar]
- 55.Agans R, Rigsbee L, Kenche H, Michail S, Khamis HJ, Paliy O. Distal gut microbiota of adolescent children is different from that of adults. FEMS microbiology ecology. 2011 Aug;77(2):404–412. doi: 10.1111/j.1574-6941.2011.01120.x. [DOI] [PMC free article] [PubMed] [Google Scholar]
- 56.U.S. Department of Agriculture Agricultural Research Service. Energy Intakes: Percentages of Energy from Protein, Carbohydrate, Fat, and Alcohol, by Gender and Age, What We Eat in America, NHANES 2009-2010. [Accessed August 8, 2014];2012 www.ars.usda.gov/ba/bhnrc/fsrg. 2014.
- 57.Arora T, Sharma R. Fermentation potential of the gut microbiome: implications for energy homeostasis and weight management. Nutrition reviews. 2011 Feb;69(2):99–106. doi: 10.1111/j.1753-4887.2010.00365.x. [DOI] [PubMed] [Google Scholar]
- 58.Barker DJ. Obesity and early life. Obes Rev. 2007 Mar;8(Suppl 1):45–49. doi: 10.1111/j.1467-789X.2007.00317.x. [DOI] [PubMed] [Google Scholar]
- 59.Huang TT, Drewnosksi A, Kumanyika S, Glass TA. A systems-oriented multilevel framework for addressing obesity in the 21st century. Prev Chronic Dis. 2009 Jul;6(3):A82. [PMC free article] [PubMed] [Google Scholar]
- 60.Ludwig DS, Gortmaker SL. Programming obesity in childhood. Lancet. 2004 Jul-23;364(9430):226–227. doi: 10.1016/S0140-6736(04)16688-9. [DOI] [PubMed] [Google Scholar]